
Abstract
The complexity of structural materials is increasing the importance of the technology for high accuracy measurement. How to obtain the displacement information of structural feature points accurately and efficiently is the key issue of deformation analysis. In this article, displacement analysis of a composite arched structure is investigated based on the terrestrial laser scanning technique. A new method based on the measured point cloud is proposed to analyze the displacement of surficial points, resulting in not only the displacement size but also the displacement direction. The innovation lies in extracting the displacement information with a network and remapped point cloud, which is called the network method. The displacement map obtained demonstrates that the transverse displacement in the experiment plays an important role in the safety of the structure, which could not be observed and obtained by the surface approximation method. Therefore, the panorama- and pointwise displacement analysis technologies contribute to ensure the safety of increasingly complex constructions.
Keywords
Introduction
High accuracy measurement is becoming increasingly important in the field of health monitoring considering the complexity of composite structures. How to obtain the displacement information of structural feature points accurately and efficiently is the key issue for structure deformation analysis. In this article, displacement of a composite arched structure is investigated based on a three-dimensional (3D) terrestrial laser scanning (TLS) technique. The structure deformation is analyzed by extracting the displacement information of network points with TLS surface-based scan characteristics. A network method (NM) based on a dense point cloud is proposed to extract the surficial point displacement, with explicit displacement directions. The article is organized as follows. Section “Introduction” gives an introduction to the background and literature. Section “Experimental setup” describes the experiment setup and TLS measurement. The detailed steps of NM are introduced and performed in section “Data Analysis.” In section “Discussion,” the displacement results of two epochs using the NM are illustrated and analyzed. Meanwhile, the displacement from the NM is compared with the surface approximation (SA) method and the accuracy is discussed. Finally, a conclusion is presented in section “Conclusion.”
TLS technology
Traditional methods, which are limited to necessities of physical contact with the structures, restrict measurements to only the contact area and, thus, the amount of information regarding the deformation field is limited. 1 In the case of a higher complexity of mechanical behavior, it would be useful to have a larger amount of measurement data, where surface-based measurements or full-field measurements are dominant. Among the numerous surface-based measurement techniques available today, those applied in mechanical characterization include interferometry measurement, such as holographic interferometry (HI), digital speckle pattern interferometry (DSPI), digital holographic interferometry (DHI), and moiré interferometry (MI), which needs more complex experimental apparatuses, geometric moiré (MG) and grid methods (GM), which require surface treatment, such as the application of a grid onto the object’s surface for the measurements. 2
The displacement information of certain critical points has an extremely important effect on the structural deformation in engineering projects, but these points are not convenient or suitable places to install the sensors and set the targets. In these situations, it is difficult to use traditional sensor technologies to achieve advantageous measurement results of some special parts of the structures, such as sharp corners, bulges, and depressions. Therefore, a new method is necessary and significant to analyze the displacement of feature points based on a surface-based point cloud. Several measurement technologies and corresponding analysis methods have been learned.3–5
TLS technology has been adopted extensively in many fields,6–12 such as civil engineering, to understand and monitor the deformation of structures. It is commonly used to create 3D point clouds or digital elevation models to describe and characterize deformation behavior and better analyze and understand surface processes by comparing multiple acquisitions over time.13–16
Deformation analysis
In this article, the deformation of the structure is analyzed by extracting the displacement of some important feature points. Feature extraction from point cloud data can be achieved automatically with the aid of two-dimensional projection and inverse transformation, which are applied in, for example, 3D street views with enormous point cloud data. 17 However, this method requires the combined use of laser scanner, camera, position, and orientation systems and, thus, is not convenient to apply in single or local structures where the point cloud data are relatively small.
The TLS is an efficient technology for spatial information acquisition, which can determine a dense, 3D point cloud with fast, non-contact measurement. 18 Displacements were computed by a triangular mesh of the object’s surface and by the shortest distance between two surface models and applied in the deformation map of the dam. 19 The regular shape measured by TLS was computed by fitting lines and the vertical displacement is consistent with the traditional measurement of, for example, inductive transducers and leveling. 20 Displacement was obtained based on data co-registration 21 and a cross-correlation-based method. 22 The surface fitting method with moving least squares was used to derive a surface deformation field. 23
Many kinds of measurement technologies are applied in the deformation analysis.24–26 Vazquez 27 investigate the dynamic and semi-static displacement of a bridge with the GPS time series. Kibitkin et al. 28 analyzed the displacement vector fields and standard errors of deformation to choose the input parameters for the digital image correlation (DIC) method.
Experimental setup
Experimentation was designed and carried out in close cooperation with structural engineers. An arched brick structure was constructed and equipped with load and testing equipment, aiming at the measurement and investigation of structural deformation behavior under vertical loads. The loads lasted continuously for 20 min each time (also named “epoch” subsequently) through four I-beams, which are beams with I-shaped cross sections. Measurements were carried out in the load pause of about 10 min. The arch structure was supported by two piers. With the increasing loads, the left pier was always stable with the ground, while the right one moved along the direction straight rightward. Some traditional measurements were set up by structural engineers, but, for the sake of detailed deformation information and surface-based results, the TLS measurement was conducted as presented in this article.
The TLS instrument adopted was the Z+F Imager 5006. It scans the surface of structures and records the surface information as a dense point cloud with coordinates in three dimensions and the intensity of a reflected laser. The scanning accuracy is 0.4 mm rms (root mean square) and the distance resolution is 0.1 mm with a sampling speed up to one million points per second. In the experiment, the TLS scanning time for a single epoch is about 6 min and the point cloud density obtained is an average of 2 mm between neighboring points. Because of the complex setup of loading, the TLS scanner could only be positioned on a second floor to maintain optimal visibility of the main arch surface and have stable standpoint for itself. As a result, the point cloud data measured occurred as a blank due to the shadow of the I-beams, electrical wires, and so on. However, this would not influence the result of the analysis, since the polynomial surface involved is continuous and smooth globally, and the feature points to be extracted are not in the blank area.
The experiment setup is shown in Figure 1 from the standpoint of TLS measurement, where the white structures are the arch and two piers, and the load is applied from the top and distributed through four parallel I-beams in contact with the arch top surface. Absolute displacement analysis of net points is performed with the epoch data of TLS point clouds gathered experimentally.

An arch experiment setup from the standpoint of TLS.
Sheltering is unavoidable when the TLS laser propagation encounters obstacles. It can be observed in Figure 1 that the I-beams contact the arch surface from the top, which could shelter the laser beams. Therefore, the top surface forms blank areas, as shown in Figure 2.
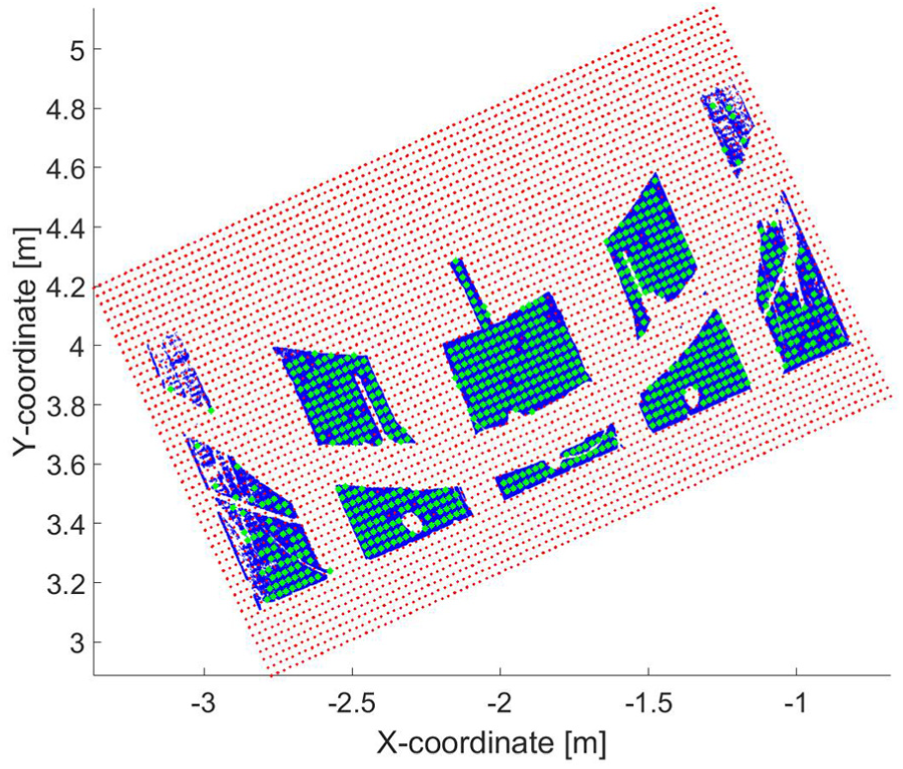
Network from the top view.
Data analysis
The introduction of the network aims at the displacement extraction in the surface area with explicit directions. This article proposes an NM to make full use of areal information and feature points for displacement analysis, where the point states in two epochs are compared at the exact points with a certain accuracy. The main principle lies in the construction of a reference network and the remapping of the point cloud. The reference network is constructed based on the processing of the local point cloud, where reducing the noises and uncertainties is highly emphasized.
The main steps of displacement extraction with the NM are described as follows. First, local stable planes are fitted on the stable reference object with TLS measurement. Stable points are extracted based on geometrical relations of the planes. Second, reference networks are constructed for the two pieces of measurement data for which the displacement is to be computed. Third, the arch point cloud is filtered iteratively to discard the outliers. Fourth, the point cloud is remapped according to the network and the point pairs are determined. Finally, the displacement is obtained with both size and direction information.
Construction of reference networks requires first and foremost stable objects. In the current experiment, the piers are considered as rigid bodies and, therefore, the features of the piers could be finalized to give the scans the same reference to compare scans captured at different times. Stable feature points are extracted with the aid of geometrical relations of a few high-quality planes on the piers, which are obtained by means of approximating TLS measurement data. The approximation of the point cloud is based on the least squares method and forms three planes, S1–3, as shown in Figure 1. The intersection of planes S1–3 generates point pa and pb, and the lines in the depth direction of the piers, marked as the lines connecting pb and pc in Figure 1. Considering the depth of the pier is generally stable and the direction of the depth is obtained as described above, the other two points pc and pd are determined uniquely given a depth of the pier of 1.5 m.
The network is constructed with the four stable points: pa, pb, pc, and pd. Equal-distance interpolation is carried out on each side to form a network of size M*N points where the length and width of the arch are divided into M = 100 and N = 50 equal parts, respectively. The network is shown in Figure 2 with red and green points. The blue points are the TLS measurement data of the arch top surface.
Attention is paid especially to the accuracy of the network construction. The approximation of planes S1–3 is repeated three times each to determine the most optimal solution for the planes. The accuracy is an average of 0.7 mm of the approximated planes S1–3. Because of plane characteristics, the approximated plane accuracy should approach the accuracy of the measurement points. The plane accuracy result agrees with measurement uncertainty from the work by Wujanz et al. 29 as 0.68 ± 0.05 mm, computing with the laser intensity value. The uncertainty could come from the TLS measurement uncertainty and, additionally, the properties of the surface measured. Nevertheless, the submillimeter accuracy is acceptable for the detection of large deformations, especially for the later epochs in this experiment, while the method could also give valuable references for the early epochs.
The point cloud data in Figure 2 are preprocessed with polynomial approximation, so that the points with errors larger than three times standard deviation (SD) are discarded. The complexity of the polynomial surface is determined by model testing, where the fourth-order polynomial with 15 parameters is chosen. Iterative filtering is carried out, where, finally, the SD is under 2 mm after five iterations. The accuracy of the point cloud should be improved for further research, for example, with preknowledge of the object shapes. 30
The network is a reference to the point cloud data measured. Because the M and N values are, respectively, the same in two epochs, point pairs are generated in the two epochs at each net point where the index is absolutely the same, written as (i, j) with i ≤ M and j ≥ N. The two epochs are connected through reference networks constructed with the same stable points in two epochs.
It could be observed in Figure 2 that the network encircles the top surface of the arch, where the point cloud could be remapped to the network, similar to pixels. The cloud points are matched to the net points by means of nearest neighbor search based on the k-dimensional tree method, where the points as close as a distance threshold of 1 mm to the net points are recorded. The distance threshold is chosen depending on the requirement of the data processing. On one hand, a small threshold leads to fewer cloud points matched to the network and, thereafter, fewer point data for displacement analysis; on the other hand, a large threshold results in more points remaining, but the latter could not represent the position of the net points reliably.
The green points in Figure 2 correspond to the positions of remapped measurement points and the matched net points. With the remapped point cloud, we manage to calculate the spatial displacement of each point. Because the matched net point pairs own the same index in two epochs, the epochal deviation of the one-by-one remapped measurement points, that is, the 3D displacement, is obtained under the same index.
Discussion
The displacements of the remapped point cloud are finally obtained by the NM, which could reflect the areal deformation behavior and the explicit displacement directions. The displacement vectors of two epochs are shown in Figure 3 from the lateral view, where Figure 3(a) depicts the displacement of an early epoch, E3, corresponding to a small load, and Figure 3(b) describes the displacement of a later epoch, E13, with a large load. The E3 (with load 120 kN) is a typical term without crack and E13 (520 kN) stands for a stage with crack.

Spatial displacement with NM: displacement distribution of (a) E3 and (b) E13.
The detailed displacement analysis is performed due to the explicit result of the pointwise displacement. It could be observed in Figure 3 that the structure behaviors vary in different parts of the arch in the early and late epochs. In the middle part of the arch, Figure 3(a) shows a much smaller displacement than Figure 3(b), while both displacement directions are almost vertical, as shown in the B1 and B2 areas of Figure 3. The displacement is increasing for the part of the arch close to the fixed left pier, but the direction changes from down left (as in area A1) to approximately vertical (as in area A2). This agrees with the fact that the shape of the arch increases the bearing capability of the structure, since the load is diverted in the horizontal plane and, thus, the vertical aspect is protected. However, after the load has increased greatly, the protection mechanism disappears, and the displacement direction turns to the vertical direction correspondingly. For the area of the right part of the arch, the direction of the displacement changes from up left (area C1) to mainly up (area C2), and the displacement size becomes smaller. This interesting phenomenon is caused by the fact that the right supporting pier is moving to the right during the loading process.
The accuracy of NM feature displacement is discussed through comparison with polynomial deformation. The fourth-order polynomial surface is approximated and the vertical displacement of the points referred to is computed. The difference of the displacement with two methods is shown in Figure 4, where the blue polyline corresponds to the displacement with NM and the red polyline refers to the polynomial surface.
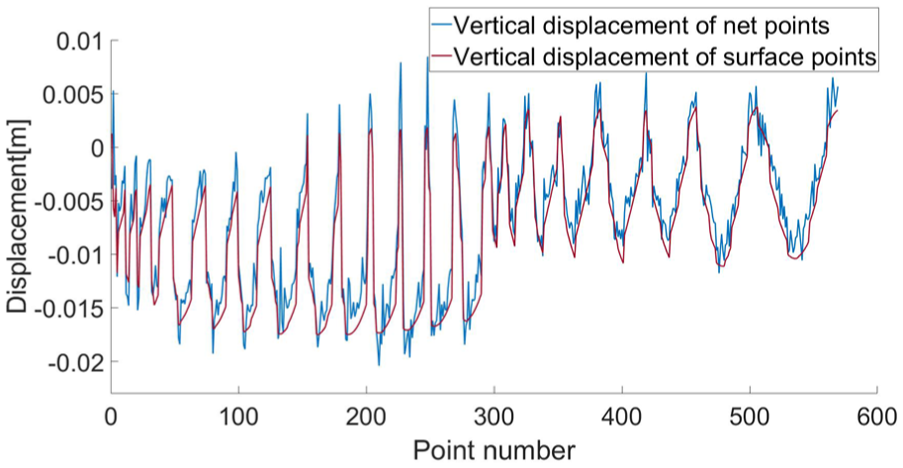
Difference of NM and SA in vertical displacement.
It could be observed in Figure 4 that the displacement trend of NM agrees well with the SA method. The NM displacement shows more details and the SA method gives only rough results. This is because it is possible to filter some important features using the SA method, which could be important for the description of displacement behaviors. Table 1 shows the mean value and SD of the vertical displacement of the NM and SA method. It is illustrated that the results are very close to each other and the difference is around 1 mm.
Comparison of vertical displacement of NM and SA.

NM: network method; SA: surface approximation; SD: standard deviation.
The NM gives extra results in the X and Y directions compared to the SA method, which offers displacement in the Z direction. Comparison is made and shown in Figure 5, where the blue polyline shows the difference between the displacement of the SA and the vertical direction displacement of the NM, and the red polyline corresponds to the deviation of the displacement of the SA and the 3D displacement of the NM. It is demonstrated in Figure 5 that the vertical direction displacement of the NM approaches the displacement of the SA, while the 3D displacement of the NM is larger than the displacement of SA due to the displacement in the X and Y directions. The corresponding mean differences are listed in Table 2.

Comparison on NM and SA of 3D and vertical displacement.
Difference of the NM and SA displacement.

NM: network method; SA: surface approximation; SD: standard deviation.
The mean difference is computed by the NM value, subtracting the SA value and averaging. It is shown in Table 2 that the mean differences between the NM vertical displacement and the SA displacement are around 1 mm in both epochs, while the mean difference between the NM 3D displacement and the SA displacement is significantly larger. It is hinted that the NM result is point-to-point displacement, which offers extra displacement information in the X and Y directions and possibly contains the points which are significantly deformed but filtered by SA.
Conclusion
In this article, TLS measurements were carried out for a structure load experiment to investigate the deformation behavior of an arched structure. A new method is proposed to obtain the displacement information of structural surficial points efficiently, where not only the displacement size but also the displacement direction could be successfully acquired. A network is constructed with stable objects and the point cloud is remapped according to the network. The remapped points are extracted and the deviations with different epoch data are calculated.
Accuracy of the network is highly emphasized, where multi-tries are performed to generate a reliable reference network. The fitted planes obtained an accuracy under 1 mm. The arch point cloud was filtered with optimal polynomials, where the outliers are discarded with five iterations and the uncertainty is under 2 mm, to improve the displacement result.
It is shown that the transverse displacement in the experiment plays an important role in the safety of the structure. Therefore, it is not sufficient to assess the health of structures based solely on vertical displacements, which is one shortcoming of SA assessment methods. Therefore, a panorama- and surface-based monitoring technology is required to ensure the safety of increasingly complex constructions.
Footnotes
Acknowledgements
The authors wish to acknowledge the support of all the colleagues in Geodetic Institute of Leibniz University Hannover for their valid information.
Handling Editor: Francesc Pozo
Declaration of conflicting interests
The author(s) declared no potential conflicts of interest with respect to the research, authorship, and/or publication of this article.
Funding
The author(s) disclosed receipt of the following financial support for the research, authorship, and/or publication of this article: The publication of this article was funded by the Open Access Fund of the Leibniz Universität Hannover and also supported by Natural Science Foundation of Jiangsu Province (no. BK20160558).