
Abstract
An underwater glider is an autonomous underwater vehicle that is propelled by changes in volume. Due to this propulsion method, it is possible to make observations with these devices continuously for 30–60 days. Of the gliders’ physical properties, the volume change has the greatest influence on the cruising speed. The speed can be increased by increasing the volume change, but this also increases the energy consumption. Therefore, the change in buoyancy is very important for the operation of underwater gliders. Hence, it is necessary to optimize the change in buoyancy. In this study, we describe a technique for optimizing the design of underwater gliders intended to operate in the East Sea of Korea using a combined buoyancy engine and thruster propulsion system. First, we carried out a simulation study to optimize the volume change of the buoyancy engine based on the average flow velocity distribution, water temperature, and vertical salinity distribution in the East Sea. Then, we used our simulations to predict the optimal change in volume of the underwater glider. Finally, we discuss the advantages of operating with thrusters in special environments under specific water temperature, salinity distribution, and ocean current conditions.
Introduction
Oceanographic observations began with shipping, before the common era (BC). The progress of civilization led to further development of shipping for the purpose of trading and exploration for resources. In the 20th century, technological solutions were applied for oceanographic observations. This has led to many advances in oceanography and physical oceanography. 1 In physical oceanography, the properties of the ocean that are most important to observe are the water temperature and salinity. Typical oceanographic observations are made using vessels or buoys, which are employed for stationary point observations. The development of satellites made it possible to observe large areas. 2 It is also possible to use ships to observe large areas, but this is dependent on manpower and weather conditions. It is not possible to make oceanographic observations using buoys over wide areas of ocean. Satellite observations can be made over a wide area at a single time. However, these observations are costly and have the disadvantage of poor accuracy. Many calibration points are needed to increase the accuracy of satellite observations.
Unmanned survey techniques are being developed to overcome the issues relating to time, space, and cost. The most popular unmanned robot is the Argo Float. The Argo Float was first proposed by OceanObs in 1999. Currently, more than 3000 observations are being carried in the course of semi-real-time surveillance and systematic observations of the sea temperature, salinity, and ocean currents. These observations are in conjunction with the Global Climate Observing System (GCOS)/Global Ocean Observing System (GOOS), Climate Variability and predictability (CLIVAR), and Global Ocean Data Assimilation Experiment (GODAE) projects of the World Meteorological Organization (WMO)/Intergovernmental Oceanographic Commission (IOC). 3 An Argo float is a device that dives to the target depth for collection of long-term ocean data. The data collection can last for more than 1 year, depending on the direction of current. However, following the ocean currents has the disadvantage that it is difficult to obtain observations from a specific area.
Autonomous underwater vehicles (AUVs) and remotely operated underwater vehicles (ROVs) are autonomous observation devices with a higher degree of freedom. AUVs are generally torpedo shaped, with one or more thrusters and three or more rudders. These can generally operate for 1 week. An ROV consists of three or more thrusters and has a box-like structure.
A user can directly control a robot connected to a ship by a cable, and perform in-water construction tasks, precision observations, and so on. AUVs have limitations when it comes to long-term observations, and ROVs are not suitable for wide area ocean surveys. 4
Stommel proposed the concept of an underwater glider in 1989. His aim was to obtain long-term observations and vertical profiles of the ocean space. 5 Underwater gliders are underwater vehicles that operate by transforming vertical forces into horizontal propulsion forces by varying the buoyancy of the device, without requiring a thruster. This propulsion method makes it possible to carry out 50 (alkaline battery) to 120 (lithium primary battery) days of continuous observations. This case is based on the slocum G2 model of the Teledyne Webb Research.
Since 2001, the development of these devices has been supported by the US Office of Naval Research (ONR), which developed SeaGlider, by Washington University, which developed Spray Glider, by Woods Hole Oceanographic Institution and the Scripps Research Institute, which developed Slocum Glider, and the Webb Research Corporation.6–8
As described above, underwater gliders can make observations over a long period of time and have sufficient degrees of freedom (DOFs) to move to their desired positions. However, for long-term operation, these gliders move slowly, at speeds of less than 0.5 kN. Therefore, the direction of the ocean currents has a very important role in the route selection. Generally, when operating an underwater glider in a region with fast ocean currents, the path of the glider is selected to follow the direction of the ocean current. However, it is difficult to plan such paths and remain in the territorial seas adjacent to specific countries, such as the East Sea in Korea. Hence, we require a design that can move faster than the average ocean current. The physical variable that has the greatest influence on the cruising speed of an underwater glider is the volume change. Gliders can move faster as their volume change increases, but this causes a corresponding increase in energy consumption. This means that more energy is needed than the AUV, which has a thruster, to keep the glider moving at a constant speed or accelerating. Also, if the volume change is too little, the glider will travel along the ocean currents and operate in the same manner as the ARGO Float. Therefore, controlling the buoyancy change of the underwater glider is very important and should thus be optimized.
As described above, underwater gliders can make observations over a long period of time and have sufficient freedom to move to desired locations. However, they move slowly, at long-term speeds of less than 0.5 kN. Therefore, the directions of ocean currents play an important role in route selection for underwater gliders. Generally, when operating an underwater glider in a region with fast ocean currents, the glider is designed to move in the same direction as the ocean current. However, it is difficult to plan such paths through territorial seas, such as the East Sea, which is adjacent to three countries. Hence, we need to develop a glider that can move faster than the average ocean current. The physical variable that has the greatest influence on the cruising speed of an underwater glider is the volume change. The speed increases with the volume change, but this is accompanied by an increase in the energy consumption, and thus requires more energy than an AUV with a thruster to move at a constant speed or accelerate. Also, if the volume change is too small, the glider will travel along the ocean currents and operate like an Argo Float. Therefore, controlling the change in the buoyancy of the underwater glider is very important for smooth operation. Hence, we should optimize the design of the buoyancy change.
In this article, we present a mathematical formula with 6 DOFs. This is a kinematic equation that expresses the mathematical properties of the underwater glider and can be used to explain the relationship between the volume change and the horizontal velocity of the underwater glider. We use this equation to determine the optimum yaw angle of the underwater glider. We determine the appropriate change in the buoyancy by comparing the amount of buoyancy control to the power consumption. In addition, we propose using a combination of varying the buoyancy and using an additional propulsion system to make a glider that is suited to the physical characteristics of the East Sea. Finally, we validated our optimized design for an underwater glider by carrying out a simulation based on the physical characteristics of the East Sea.
Underwater glider
An underwater glider is an underwater vehicle that uses a buoyancy engine to adjust the amount of buoyancy and sails up and down repeatedly. Figure 1 shows the force generated by an underwater glider in two dimensions. When the underwater glider is viewed as a homogeneous rigid body, the forces of buoyancy (B), gravity (F), pitch angle (θ), angle of attack (α), and drag force (D) caused by the shape of the hull are incident on the center of gravity. When the force of gravity is larger than the buoyancy force, that is, the glider is in a negative buoyancy state, it moves in the positive z direction. At this time, the center of gravity of the underwater glider is varied to produce a certain pitch angle. The glider then moves in the oblique direction instead of the vertical direction. Conversely, when the buoyancy force is greater than the gravitational force, the glider moves in the negative z direction. At this time, the underwater glider moves horizontally by moving along the diagonal line induced by the pitch angle.

Definition of force and motion.
Mathematical definition
To optimize the design of the underwater glider, it is necessary to verify the optimal motion in the water before development. We can use the same dynamic analysis for underwater gliders as is used for common underwater vehicles. An underwater vehicle is generally expressed using equations of motion with 6 DOFs. We represent the underwater glider mathematically by assuming that it has a rigid body, as shown in Figure 2. We define the Earth-fixed frame and the body-fixed frame. The 6-DOF equation consists of forces and moments in the x, y, and z directions, with respect to the center of the rigid body. The movement of the body in the fixed body coordinate system is converted into a universal coordinate system (the Earth-fixed frame) so that we can analyze its motion. Equation (1) represents the 6-DOF equations of motion of a typical underwater vehicle. 4 In equation (1), m is the mass of the underwater glider, (u, v, w) and (p, q, r) are the velocity and angular velocity in the body-fixed coordinate system, respectively, and I is the mass moment of inertia


Notation of underwater glider.
The most important factor affecting the design of an underwater glider is the change in the buoyancy. If the change in buoyancy is large, the horizontal velocity increases, but this leads to a proportional increase in the energy consumption. To optimize this, we need to know the relationship between the change in the buoyancy of the underwater glider and the horizontal velocity. The external force X, which takes into account the hydrodynamic coefficient and the hydrostatic coefficient acting on the underwater glider undergoing the surge motion defined in equation (1), can be expressed by the following 6-DOF equation

The underwater glider moves horizontally/vertically at a constant speed, u, except for when the buoyancy changes. Thus, we obtain a steady state, in which the acceleration and the angular velocity approaches zero. Applying the steady state to equation (2) yields equation (3)

At this time,
The velocity u of the hull is expressed in body-fixed coordinates. The velocity of the Earth-fixed coordinates with respect to the x and y axes is represented by equation (4), and the velocity of the transformed x and z axes is represented by equation (5)


The relationship between buoyancy control and the velocity of the horizontal/vertical motion is shown in Figure 3. The weight of the modeled underwater glider is 60 kg, and the buoyancy control varies from 1% to 9% of the total weight.
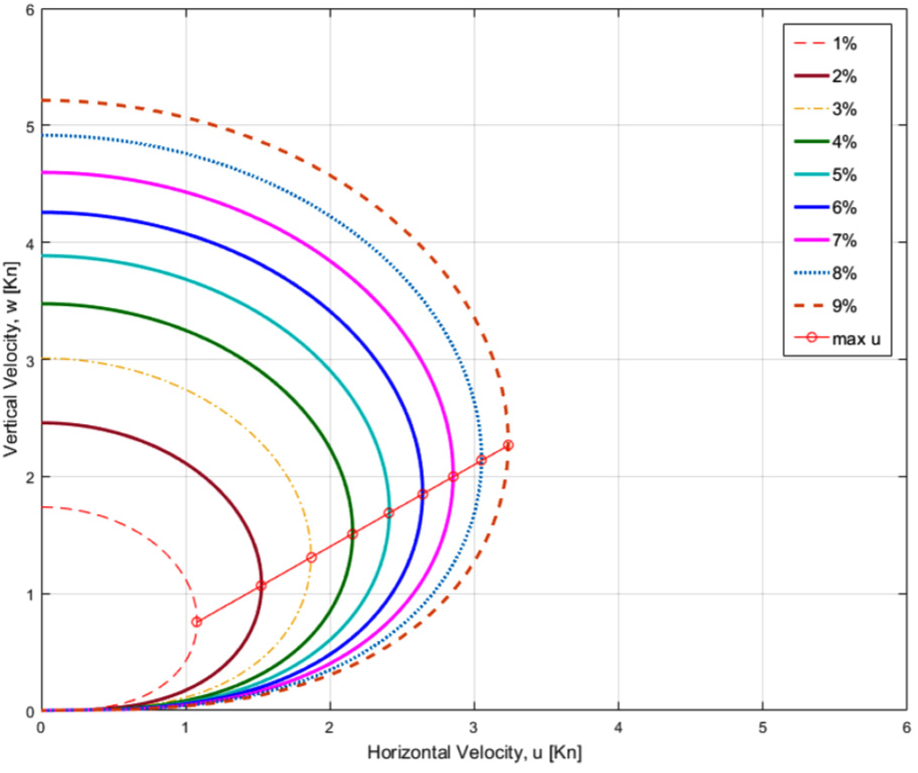
Speed of underwater glider in Earth-fixed coordinates.
Optimum design of an underwater glider for operation in the East Sea
Regional characteristics of the sea around Korea
South Korea is surrounded by sea on three sides. In the case of the East Sea, the average depth is 1684 m and the maximum depth is 4049 m. The average speed of the Western Sea and the Southern Sea is fast, and the water depth is 100 m, which is shallow compared to the East Sea, making it difficult to operate the glider because it interferes with obstacles such as fishing nets.9,10 Also, the mean velocity of the ocean currents around the East Sea is less than 0.7 kN, but natural phenomena cause the flow rate to change constantly around this region.11,12 Geographically, Korea is located to the south of North Korea and to the east of Japan. For this reason, the optimal sea area for operating underwater gliders in Korean waters is held to be the East Sea.
Korea has four changes of season per year. Summer is very hot and winter is very cold. Especially in summer, the difference in temperature between the surface of the water and water at a depth of 30 m is 9.7°, as shown in Figure 4. This vertical distribution of temperature and salinity causes the density of the seawater to vary vertically. If the weight of our underwater glider is 60 kg, the weight at a depth of 30 m is 150 g larger than at the surface (0 m depth). This halves the efficiency when varying the buoyancy by 0.5% (±300 g). Therefore, the vertical water temperature and salinity distribution are important parameters to take into account when designing underwater gliders. Figure 4 shows the water temperature and salinity data for the 2-month period from February to December 2017 at line 105 of point 10 (37.5533 °N, 130.9317 °E) of the East Sea, according to the Korean Hydrographic and Oceanographic Agency.

Conductivity, temperature, and pressure (CTD) data at Point 10 of the 105 line of the Korea East Sea (2017, Korea Hydrographic and Oceanographic Agency).
Operating conditions of real gliders
Conductivity, Temperature and Pressure (CTD) observations were performed using a Slocum glider between 13 June 2017 and 17 June 2017 (UTC time). The initial goal was to observe points 105-6 to 105-10. However, when the average flow velocity was more than 0.8 knots while moving to the 105-7 position, which lies beyond point 105-6, it was not possible to estimate how to move the glider toward this point due to the motion in the direction of the ocean current, which was in the north-westward direction. Figure 5 shows an example of the operation of the Slocum glider being pushed from the target point by the currents of the East Sea.
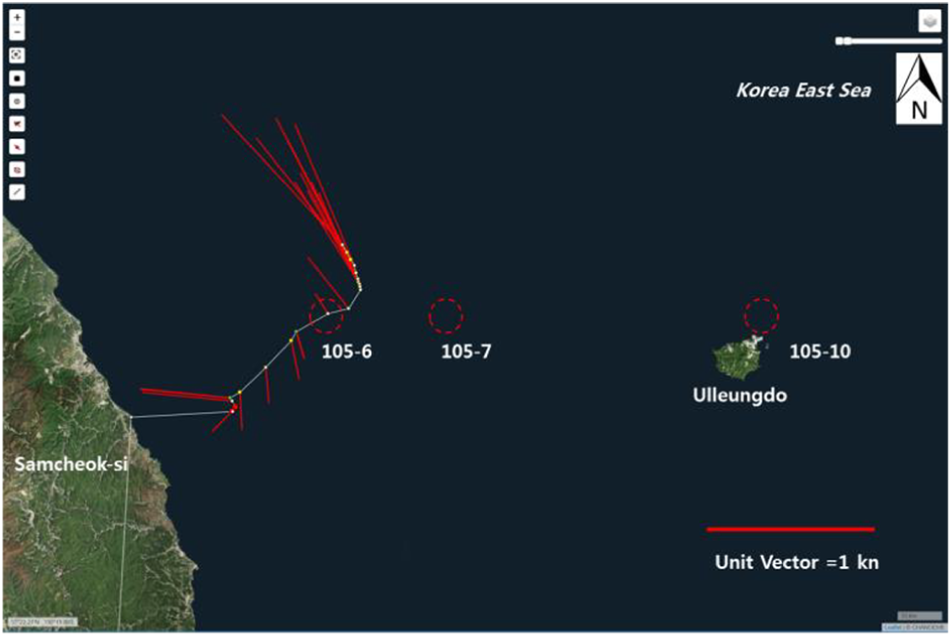
Trajectory of the Slocum glider in the Korean East Sea.
Design of the underwater glider
In this study, we selected several design conditions in advance to optimize the design of the underwater glider. First, we limited the weight and size of less than three people to 60 kg or less for assembling, launching, and recovering the device. Second, the operating depth was limited to 200 m. This is due to the large change in the salinity of the water up to 200 m. We also aimed to design an underwater glider that can undergo combined operation using a thruster when the glider itself cannot overcome the current, as in the actual operation example in the previous section.
We selected a general torpedo shape for the outline of the underwater glider. We designed the nosecone and cowling by applying the Myring profile equation.13,14 The internal moving mass, which we used to control the pitch angle, was 10 kg. The moving mass consisted of a lithium ion battery and the total travel distance was designed to be 15 cm. The overall shape is shown in Figure 6 and the specifications are shown in Table 1.

Overview of the underwater glider.
Specification of underwater glider.

Buoyancy engine design and performance test
As described above, the mean velocity of the current in the East Sea is about 0.7 knots. The velocity of the underwater glider was selected to be 1.2 knots, considering the average ocean current and vertical water temperature and salinity distribution. The buoyancy control was calculated to vary by ±1% (total 1200 cc), according to the relationship between the buoyancy and the speed described in the previous section.
Generally, a buoyancy engine is a hydraulic mechanical device with a ball screw; it works by controlling the hydraulic pressure. We developed a hydraulic buoyancy engine for our device. The diameter of the piston of the buoyancy engine was 18 cm and the hydraulic circuit is shown in Figure 7. The operating principle of the buoyancy engine is to operate the electric motor to send the hydraulic oil from the oil tank to the piston. This force causes the piston to advance forward. In the opposite direction, the principle of operation is via a solenoid valve, which moves the piston backward as the working fluid of the piston enters the oil tank due to the vacuum pressure. Figure 8 shows the buoyancy engine produced in this study.

Hydraulic circuit of the buoyancy engine.

Overview of the buoyancy engine.
We simulated our device to confirm the motion produced by the buoyancy engine. The front end of the piston was filled with oil and we set the pressure between 0 and 25 bar. We also made the test equipment capable of measuring the current consumption and constructed a power supply of 36 V, as shown in Figure 9. This enabled us to measure the moving speed and power consumption.

Buoyancy engine test site.
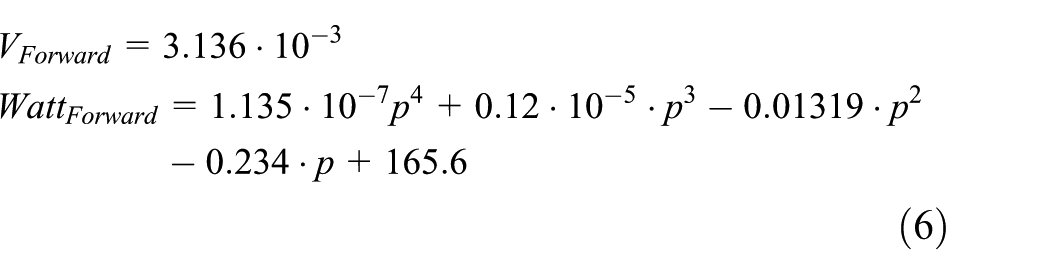
We applied between 0 and 25 bar of pressure at intervals of 5 bar and measured the piston advance time and power consumption. We repeated the experiments 10 times and took the mean values. As shown in Figure 10, the advancing speed remained almost constant, regardless of the pressure. The power consumption was the same as for the graph in Figure 11, which shows the results obtained using the interpolation method defined in equation (6)

Test result of buoyancy engine piston advance time.

Test result of power consumption of the buoyancy engine during forward movement.
To move the buoyancy engine backward, we applied a voltage to the solenoid valve. The distance moved was determined by the difference between the external pressure and the internal vacuum pressure. Hence, the velocity increased with the pressure. The graph in Figure 12 shows the results when the buoyancy engine was moving backward through the water at depth. The results of the interpolation are defined by equation (7)


Buoyancy engine test result of full stock time.
Underwater glider simulation based on the physical characteristics of the Korean sea
Typically, normal fluid is assumed when simulating a submersible and no vertical water temperature or salinity profile is included in the model. Underwater gliders are very important for simulation because of the vertical change in density due to the water temperature and salinity. We performed a simulation of the actual water temperature and salinity profile during the Korean Summer (September), when we have the largest temperature difference between depths of 0 and 30 m. Our combined propulsion simulation was used to study the operation of the glider with a propeller, for use when sea conditions were difficult.
Underwater glider simulation
In our simulation, we used the hydrodynamic coefficient from Jung’s study on the vertical planar motion mechanism (VPMM) test. 15 More hydrodynamic coefficients were calculated using the coefficient estimation method developed by Prestero. 16 The simulation was written in MATLAB/Simulink. The simulated system is shown in Figure 13.
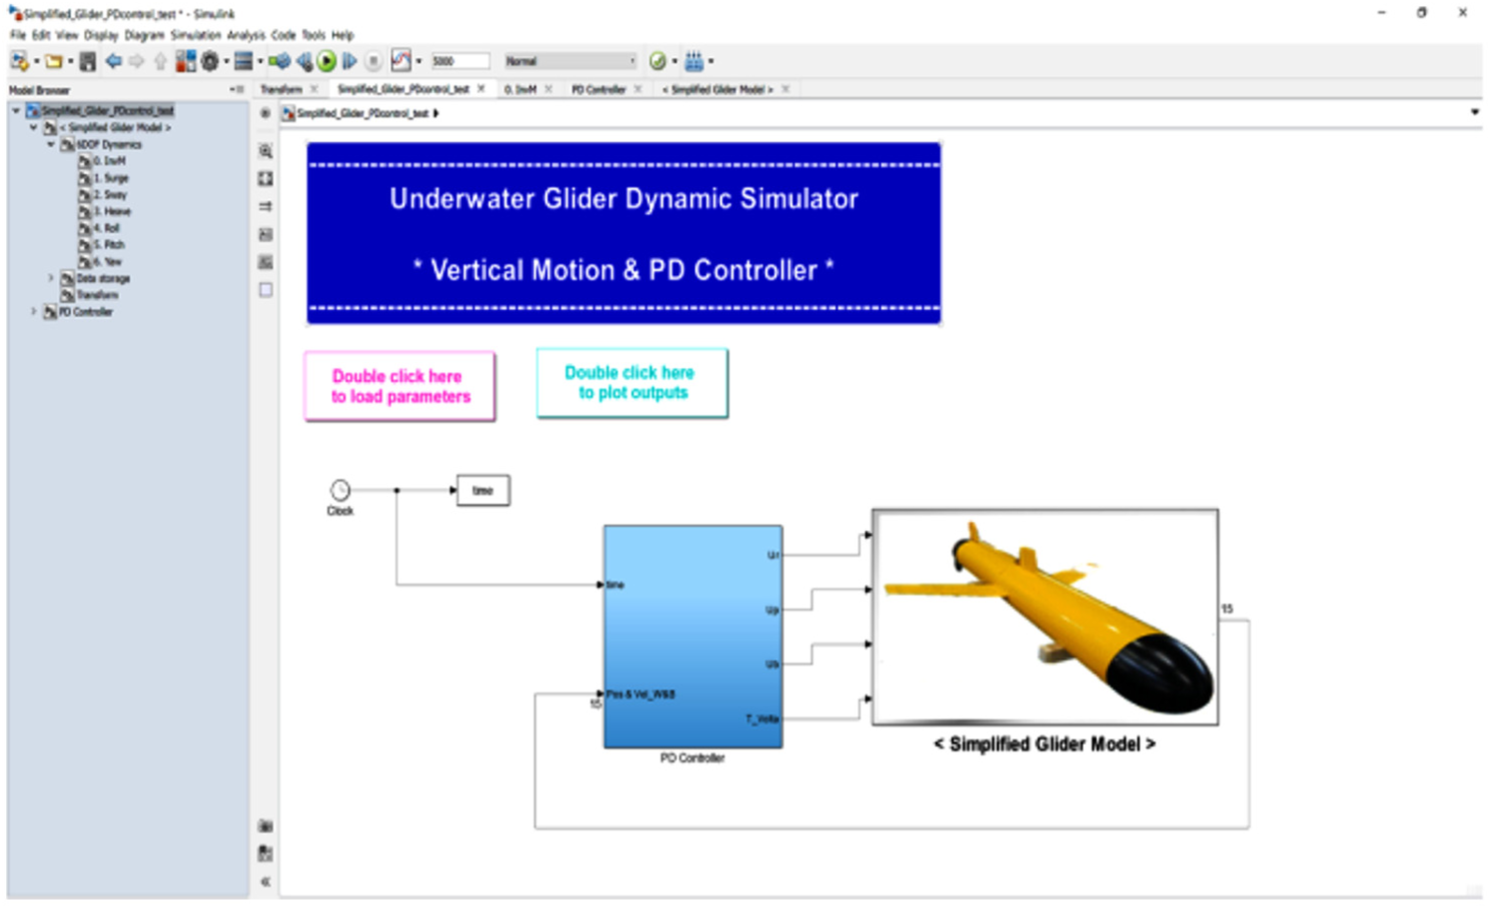
Underwater glider simulator.
Figures 14–16 show the results of the simulations, for which we operated at a depth of 10–200 m and varied the total volume of the device by 1% (±600 cc). Figure 14 shows that the horizontal speed was 1.195 knots, when both rising and falling. This confirms that the design process, taking into consideration the relationship between the buoyancy and the horizontal velocity, is correct. Simulation results show that the change of water density along the water depth does not affect the depth direction movement of the underwater glider. Therefore, the movement of the underwater glider in the depth direction depends on the size of the buoyancy engine. The results shown in the left graph of Figure 15 indicate that the underwater glider traveled 470.5 m in 490.5 s in the x direction during one cycle (one descent and one ascension).
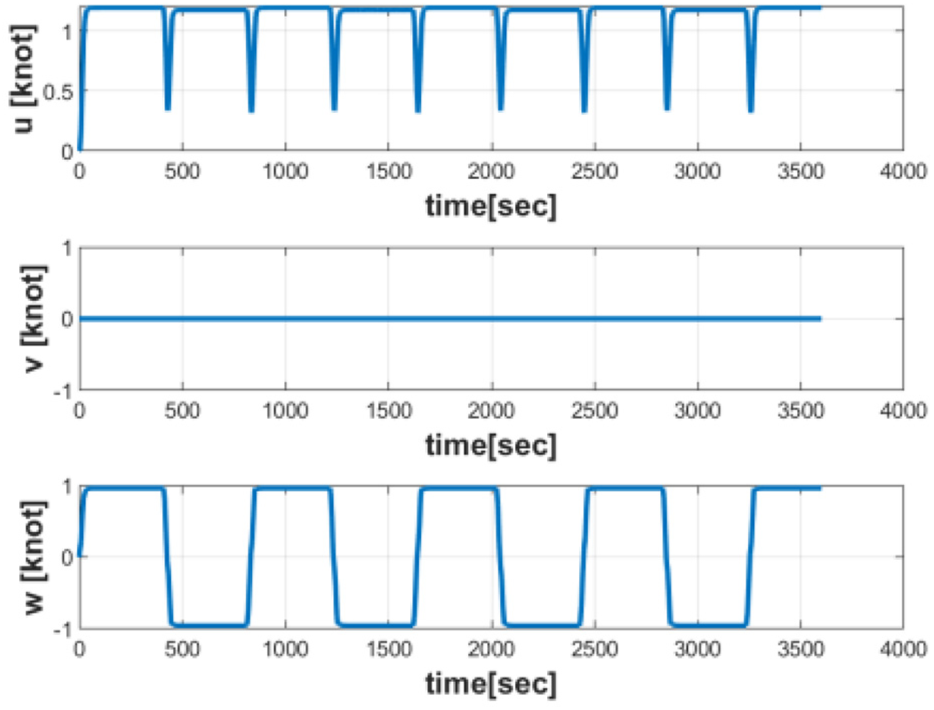
Simulation result of underwater glider speed.

Simulation result of three-axis distance (left) and rotational angle (right).

Simulation result of power consumption of joule.
Figure 16 shows the energy consumption of the underwater glider. The energy consumption is the same as the staircase result. This is because the buoyant energy is consumed by moving from 10 to 200 m in the z direction. One cycle consumes 3935 J of energy. Up to 20 kg of battery can be loaded into the device. Alongside the buoyancy engine, hull pipe, internal mechanism, and control board, this results in the underwater glider weighing 60 kg in total. The glider has a capacity of 17 MJ (3.7 V, 3200 mWh, 400 cells) and one cycle consumes 3935 J of energy. This can be calculated to correspond to about 23.2 days of operation.
Figure 17 is a graph showing the energy consumption, available time, and horizontal speed while varying the buoyancy of the underwater glider by 0.5%, 1%, 2%, 3%, and 4%. When the buoyancy change was 0.5%, we calculated the operational time of the device to be 77.8 days. The operating time decreased rapidly as the speed increased. When the buoyancy changed by 2%, the operation time was calculated to be 7.5 days.

Energy (joule), available time (day), and velocity (u) graph according to volume control amount.
Combined propulsion simulation
We analyzed the relationship between the amount of buoyancy control and the energy consumption when designing the underwater glider. Increasing the magnitude of the buoyancy change may be one way to pass through seaweed, but considering reduced battery mounting space as the buoyancy engine size increases, increased energy consumption, and the vertical density distribution, it is not appropriate to vary the buoyancy by more than 1%. Therefore, in this study, we propose a design method for an underwater glider that can effectively overcome algae using a combination of thruster and buoyancy engine control.
We simulated a combined propulsion system that operated when the ocean current is 1.0 knots, which is faster than the mean velocity of the East Sea, and the current flows in the direction opposite to the motion of the underwater glider. We used Tecnadyne’s Model 300 thruster, and the values of the power and thrust of the propeller were taken from Kim et al.’s 17 study in equation (6) is a formula for the thrust based on the control input voltage (−5 to 5 V) and is a formula for the consumption current according to the input voltage. The formula for the current consumption is expressed based on the interpolation method

Figures 18 and 19 show the simulation results when the buoyancy variation is 1% and the control input voltage of the thruster is 1 V, and a 1 knots ocean current occurs in the negative x direction. When the combined propulsion provided by the thrusters and the buoyancy engine is used, the optimal pitch angle converged to ±36°.
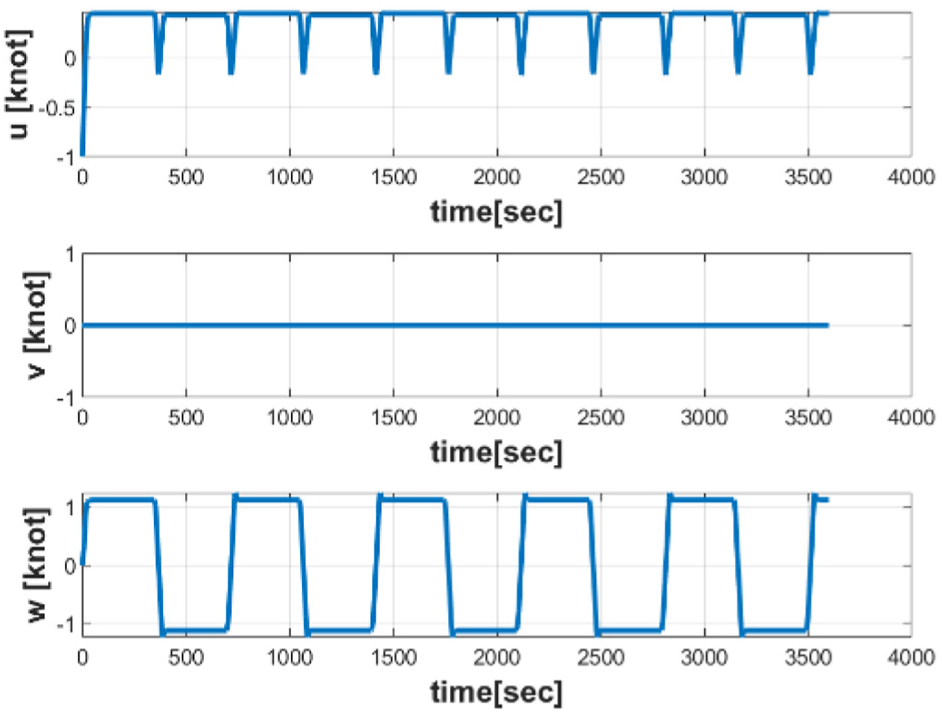
Combined propulsion simulation result of underwater glider speed.
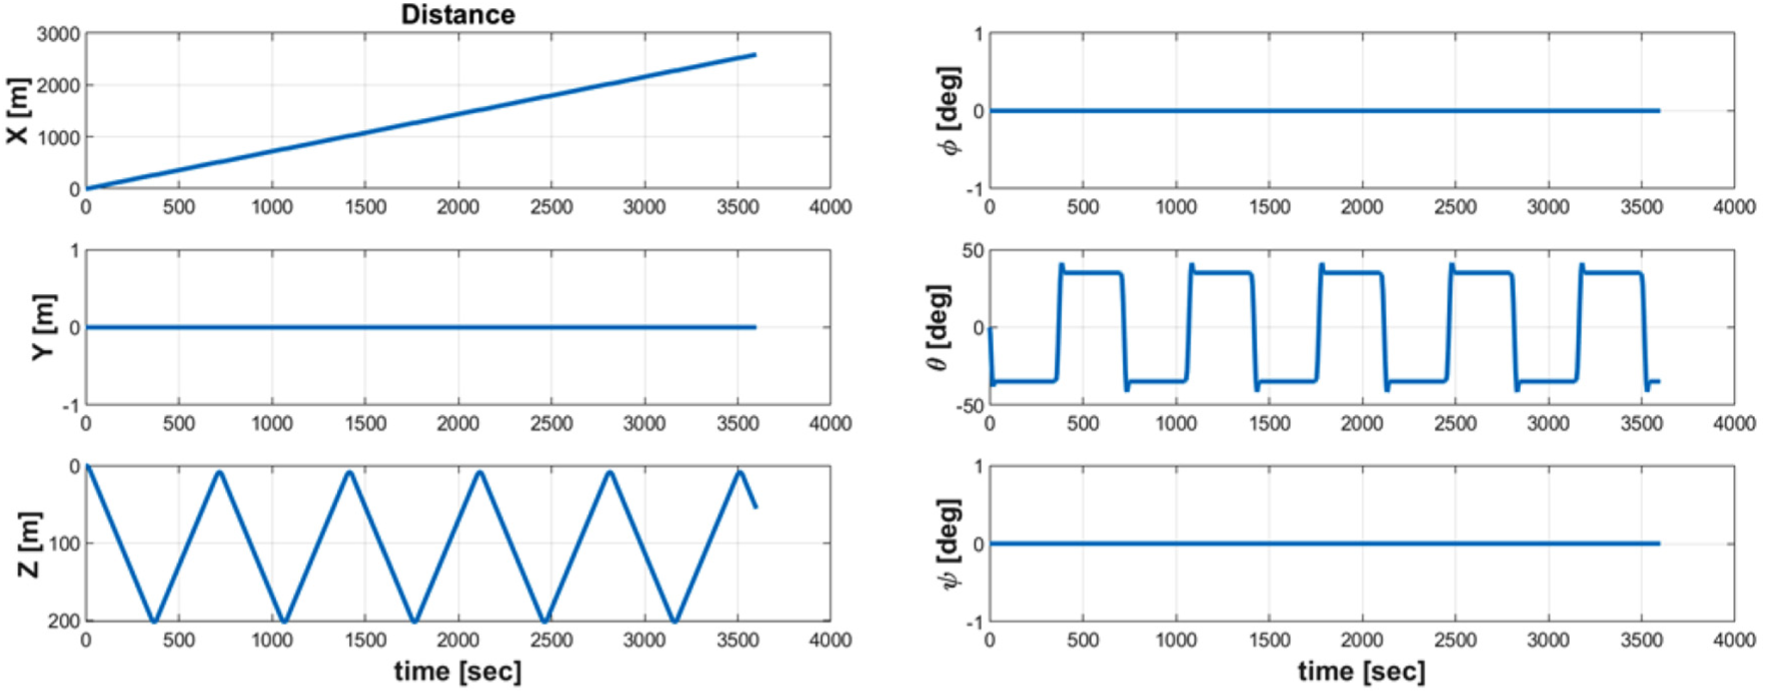
Simulation result of three-axis position (left) and rotational angle (right).
Figure 20 shows the energy consumed by the abovementioned combined thruster operation. We used a 300 W thruster for the simulation, consuming 39.36 W at 1 V control input. The thruster consumes 141.1 kJ/h, and the combined energy consumption of the buoyancy engine and thruster was calculated to be 175.8 kJ. The device can be operated for about 4 days from the internal battery capacity. If the buoyancy is varied by 1%, the device can operate for 23.2 days, although the thruster combined operation reduces this time by 19.2 days. Therefore, it is not appropriate to carry out the thruster combined operation continuously; it is only appropriate to drive the thruster when the ocean current cannot be overcome.

Combined propulsion simulation result of power consumption of joule.
Conclusion
In this article, we have described an optimal design for an underwater glider intended for use in the East Sea. Our design is based on the Slocum Glider and the ANT Glider. We used mathematical modeling and numerical analysis to develop our underwater glider, deriving the relationship between the volume change and the horizontal velocity. The pitch angle that maximizes the horizontal velocity was confirmed to be ±35°.
We selected the minimum volume control (±300 g) required for our glider based on the variation in the density as a function of the depth of the East Sea. The maximum buoyancy control (±600 g) was selected based on the East Sea current and the power consumption of the buoyancy engine. We also proposed a combined propulsion system for underwater gliders, using thrusters to overcome the ocean current. The results of our combined propulsion simulations show that the continuous use of thrusters is not suitable for long-term operation of underwater gliders. Therefore, we confirmed that the propulsion system provides an efficient operation method that can be used in case of emergency. In future work, we intend to conduct a field test to validate our complex navigation method.
Footnotes
Handling Editor: James Baldwin
Declaration of conflicting interests
The author(s) declared no potential conflicts of interest with respect to the research, authorship, and/or publication of this article.
Funding
The author(s) disclosed receipt of the following financial support for the research, authorship, and/or publication of this article: This research was part of the project titled “Development of maritime defence and security technology [PE99741]” funded by Korea Institute of Ocean Science & Technology in 2019.