
Abstract
Einstein’s viscosity formula is only applicable for dilute suspensions in which hydrodynamic interactions or inertial effects are sufficiently negligible. Therefore, the contribution of hydrodynamic interactions or the effects of inertia on the rheology of suspensions should be investigated. In order to evaluate the inertial effects of microscopic particles on the macroscopic rheology of a suspension, pressure-driven flow simulations with various confinements and Reynolds numbers were performed by a two-way coupling scheme. The results showed that the relative viscosity of the suspension decreases with increase in the particle size even when the concentration of the suspension remains the same. The results also indicated that the confinement should be less than 0.02 when applying Einstein’s viscosity formula. Moreover, the relative viscosity of the suspension under a high Reynolds number condition increases because of outward particle migration, and the non-Newtonian property of the suspension changes from thixotropy to dilatancy. Suspension is a potential fluid because its macroscopic rheological properties are altered owing to suspended particles’ behavior, that is, its microstructure. It can be stated that inertia is one of the promising factors to control suspension rheology.
Keywords
Introduction
Suspensions of particles in liquids are ubiquitous in nature and industry, and a fundamental understanding of suspension flow is key in areas such as the bioengineering, oil, food, pharmaceutical, and cosmetic industries. 1 When the rheology of a particle suspension is considered, the most important factors are the concentration, shape, interactions, and spatial arrangement of the particles, as well as the nature of the bulk flow field. 2 According to Einstein’s viscosity formula,3,4 the apparent effective viscosity of a suspension is related to the concentration ϕ of the suspended particles

where ηeff is the effective viscosity, η0 is the viscosity of a particle-free fluid, [η] is the intrinsic viscosity, and βϕ2 is the contribution from hydrodynamic interactions, 4 which are neglected in Einstein’s original formula. It is well known that [η] = 2 for two-dimensional (2D) systems 5 and [η] = 2.5 for three-dimensional (3D) systems. 3 Therefore, the effective viscosity ηeff of a suspension is proportional to the concentration ϕ of the suspended particles if the hydrodynamic interactions are negligible. However, the viscosity of a suspension should be considered in nature as a function of system parameters such as suspended particle properties, suspending medium properties, thermal energy, shear variables, and time, 6 as well as the concentration of the particles. For example, the suspended particle properties indicate the shape, size, density, material, and confinement of the particles, as well as their concentration. For soft particles, the viscoelasticity and viscosity contrast are also important. The effects of these particle properties on the rheology of a suspension should be investigated in detail.
The higher order term βϕ2 becomes more important when the concentration of the suspension reaches ∼25%.2,7–9 However, the value of the coefficient β for 3D has not been completely validated, 2 with different values covering a range from 1.5 to 5 based on experimental work10–13 or from 7.35 to 14.1 based on considerations of particle–particle interactions.14–16 For the value of β in a simplified 2D model, Doyeux et al. 4 used the penalty method to consider the presence of particles in a linear shear flow and showed that the coefficient β is close to 3.6. However, these values of β in both 2D and 3D seem somewhat large if the higher order terms in Einstein’s formula simply play a role in compensating for higher concentrations resulting from hydrodynamic interactions. The polynomial effective viscosity relationships with these values of β are significantly different from those in Einstein’s original linear formula, even in the range of low concentrations, where the interactions between particles are almost negligible. 17
In numerical simulations, a two-way coupling approach—in which fluid-to-particle interactions and particle-to-fluid interactions are both considered—is essential in order to assess the effects of the suspended particles’ motions on the rheology of the suspension. In particular, the effects of rotational motion, rather than just the translational motion of the particles, are neglected in some analytical and numerical studies; this neglect results in a simple one-way coupling approach. We, therefore, considered the effects of microscopic particles on the macroscopic relative viscosity of a suspension using a two-way coupling computational method. 18 With this method, we found that the particles rotate to obtain a kinetic balance with the surrounding hydrodynamic forces. This rotation decreases the fluid resistance, and we obtained 0.773 as the value of β in 2D under the constraint [η] = 2.0. 18 The non-Newtonian property of a suspension, as well as the macroscopic viscosity, may be overestimated when the rotational motion of the particles is neglected. 18 We successfully applied our computational scheme to pressure-driven flow simulations; however, we did not take into account the effects of the confinement C (cf. the definition in section “Methods”) on the rheology of the suspension. Doyeux et al. 4 previously mentioned that the values of both [η] and β depend on C, and that [η] = 2.0 when C = 0.01. In this study, we considered the inertial effects of the suspended particles such as the confinement C or Reynolds number Re, which may affect the intrinsic viscosity [η] in Einstein’s viscosity formula.
Methods
Computational models
In order to investigate the inertial effects on the relative viscosity of a suspension, we considered suspended particles of various sizes under the constraint of the same concentration ϕ in pressure-driven flow simulations. Figure 1 shows the computational model of a 2D channel used in this study. Particles are homogeneously scattered in the channel as an initial condition in order to satisfy an assumption in Einstein’s formula. The confinement C, defined as the ratio of the particle radius to the width of the channel; 4 the gaps gx and gy between particles; and the concentration ϕ when the number of particles is (n + 1) × n are as follows


Schematic view of rigid particles suspended in a pressure-driven flow through a 2D channel.
For this study, the following parameters were chosen: channel width 2l = 1500 µm, particle radius r = 20–365 µm, confinement C = 0.0133–0.2433, concentration ϕ ≈ 25.13%, and Reynolds number Re = 0.4–24. The channel length L depends on each model so as to keep the gaps gx and gy between the particles equivalent. The parameters of the pressure-driven flow simulations are summarized in Table 1. The grid resolution Δx, Δy was set to 1 µm in each direction; this provides good accuracy to consider suspension rheology. 18 The curved boundaries of the particles were described on a Cartesian grid by virtual flux method,19,20 and a periodic boundary condition 18 was applied along the flow direction. One advantage of the virtual flux method is its superior spatial resolution (second-order accuracy) without adding an external force to describe an arbitrary body shape. 18 Moreover, no iterative calculations are necessary in this method. Good scalability for a parallelized computation is also expected due to the method’s simplicity of implementation. 18
Parameters of pressure-driven flow simulations.

r is the particle radius, C is the confinement, L is the channel length, 2l is the channel width, gx is the gaps between particles in the x-direction, gy is the gaps between particles in the y-direction, and φ is the concentration.
Governing equation for fluid part of simulations
The regularized lattice Boltzmann equation21,22 was used as the governing equation for the fluid part of our simulations. In this method, the moments were used up to the second order to obtain adequate accuracy based on the kinetic theory of gases

The parameters a0, bi, and cij are obtained from the moments of the distribution function fα
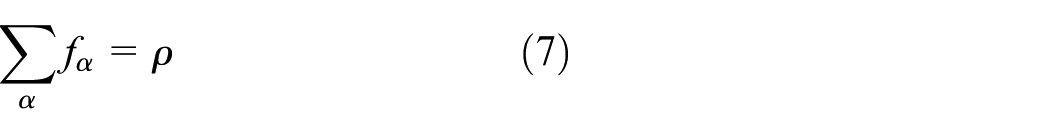


where

The first term on the right-hand side is equal to the Maxwell equilibrium distribution function

The time evolution equation for the regularized lattice Boltzmann equation is then

Governing equation for particle movement
Because the particles are assumed to be rigid and non-colloidal, their movements are simply expressed by Newton’s second law of motion (equation (13)) and by the equation of angular motion (equation (14)) 18


where
Relative viscosity and power-law index
The non-Newtonian properties of the suspension were assessed in terms of its relative viscosity and power-law index values. The relative viscosity of a suspension was evaluated by the relative wall shear stress 18 in order to find its spatial variation

where τ and τ0 are the wall shear stresses resulting from the suspension and the corresponding particle-free fluid, respectively. The velocity profile of a power-law fluid for 2D is as follows
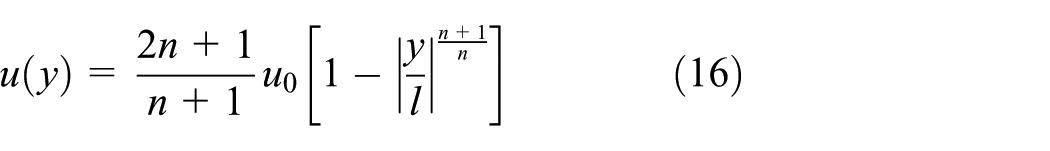
where n is the power-law index. In the case of n = 1, the fluid is Newtonian; otherwise, it is classified as a non-Newtonian fluid, which exhibits shear-thickening (dilatancy) for n > 1 and shear-thinning (thixotropy) for n < 1.
Parallel computing
Parallel computation in the OpenMP API ran on a workstation with the following configuration: processor, Xeon E5-2698 v4; clock frequency, 2.2 GHz; number of cores, 40; and memory size, 192 GB.
Results and discussion
We used parallelized computation with OpenMP, which reduced computing time by nine times when using 76 threads. 18 The computing time required for steady-state convergence strongly depended on the Reynolds number. Convergence took about 10 days for low Reynolds number conditions and 40 days for high Reynolds number conditions.
For the sake of grid independence test, the computational results were first assessed in terms of relative viscosity with grid resolution Δx, Δy from 1 to 4 µm. In this test, the smallest suspended particles, that is, the largest curvature, were chosen to verify our computation. Figure 2 shows the relative viscosity of the suspension versus grid resolution. The data represented the spatial mean ± 1 standard deviation (SD). The solid line indicates that from Einstein’s viscosity formula. In this range, our computational results were well consistent with that from Einstein’s viscosity formula. The error is less than 1% when the grid resolution is 4 µm or finer. It can be stated that the grid resolution of 1 µm in each direction provides good accuracy to consider suspension rheology in this study. Note that the SD of the relative viscosity, which is discussed later in detail, cannot be estimated from Einstein’s viscosity formula.

Relative viscosity of the suspension versus grid resolution. The data represented the spatial mean ± 1 standard deviation (SD). The solid line indicates that from Einstein’s viscosity formula.
The normalized axial velocity distribution (top left), the velocity profile (bottom left), an enlargement of the non-dimensional vorticity distributions near the lower wall (top right), and the relative viscosity diagram (bottom right) are shown in Figure 3 for a representative case with the Reynolds number Re = 1 and particle radius r = 30 µm, which corresponds to the confinement C = 0.0200. The flow that includes particles was almost steady. Note that no collisions or contacts between the particles were observed during the simulations. The velocity profile (bottom left) was obtained from the particles’ velocity vectors and their y-axis positions, which is similar to a particle tracking velocimetry procedure. The difference from the Poiseuille profile (solid line) in terms of the maximum velocity magnitude was 1.51%. We approximated this profile by that of a power-law fluid, and we found the corresponding power-law index to be n = 0.907—a value indicating that this suspension behaves like a shear-thinning (thixotropic) fluid for n < 1. This result is consistent with those reported in previous research,2,7–9 in which the importance of non-Newtonian behavior, particularly shear-thinning behavior, was considered for the particle concentration ϕ ≥ 25%.
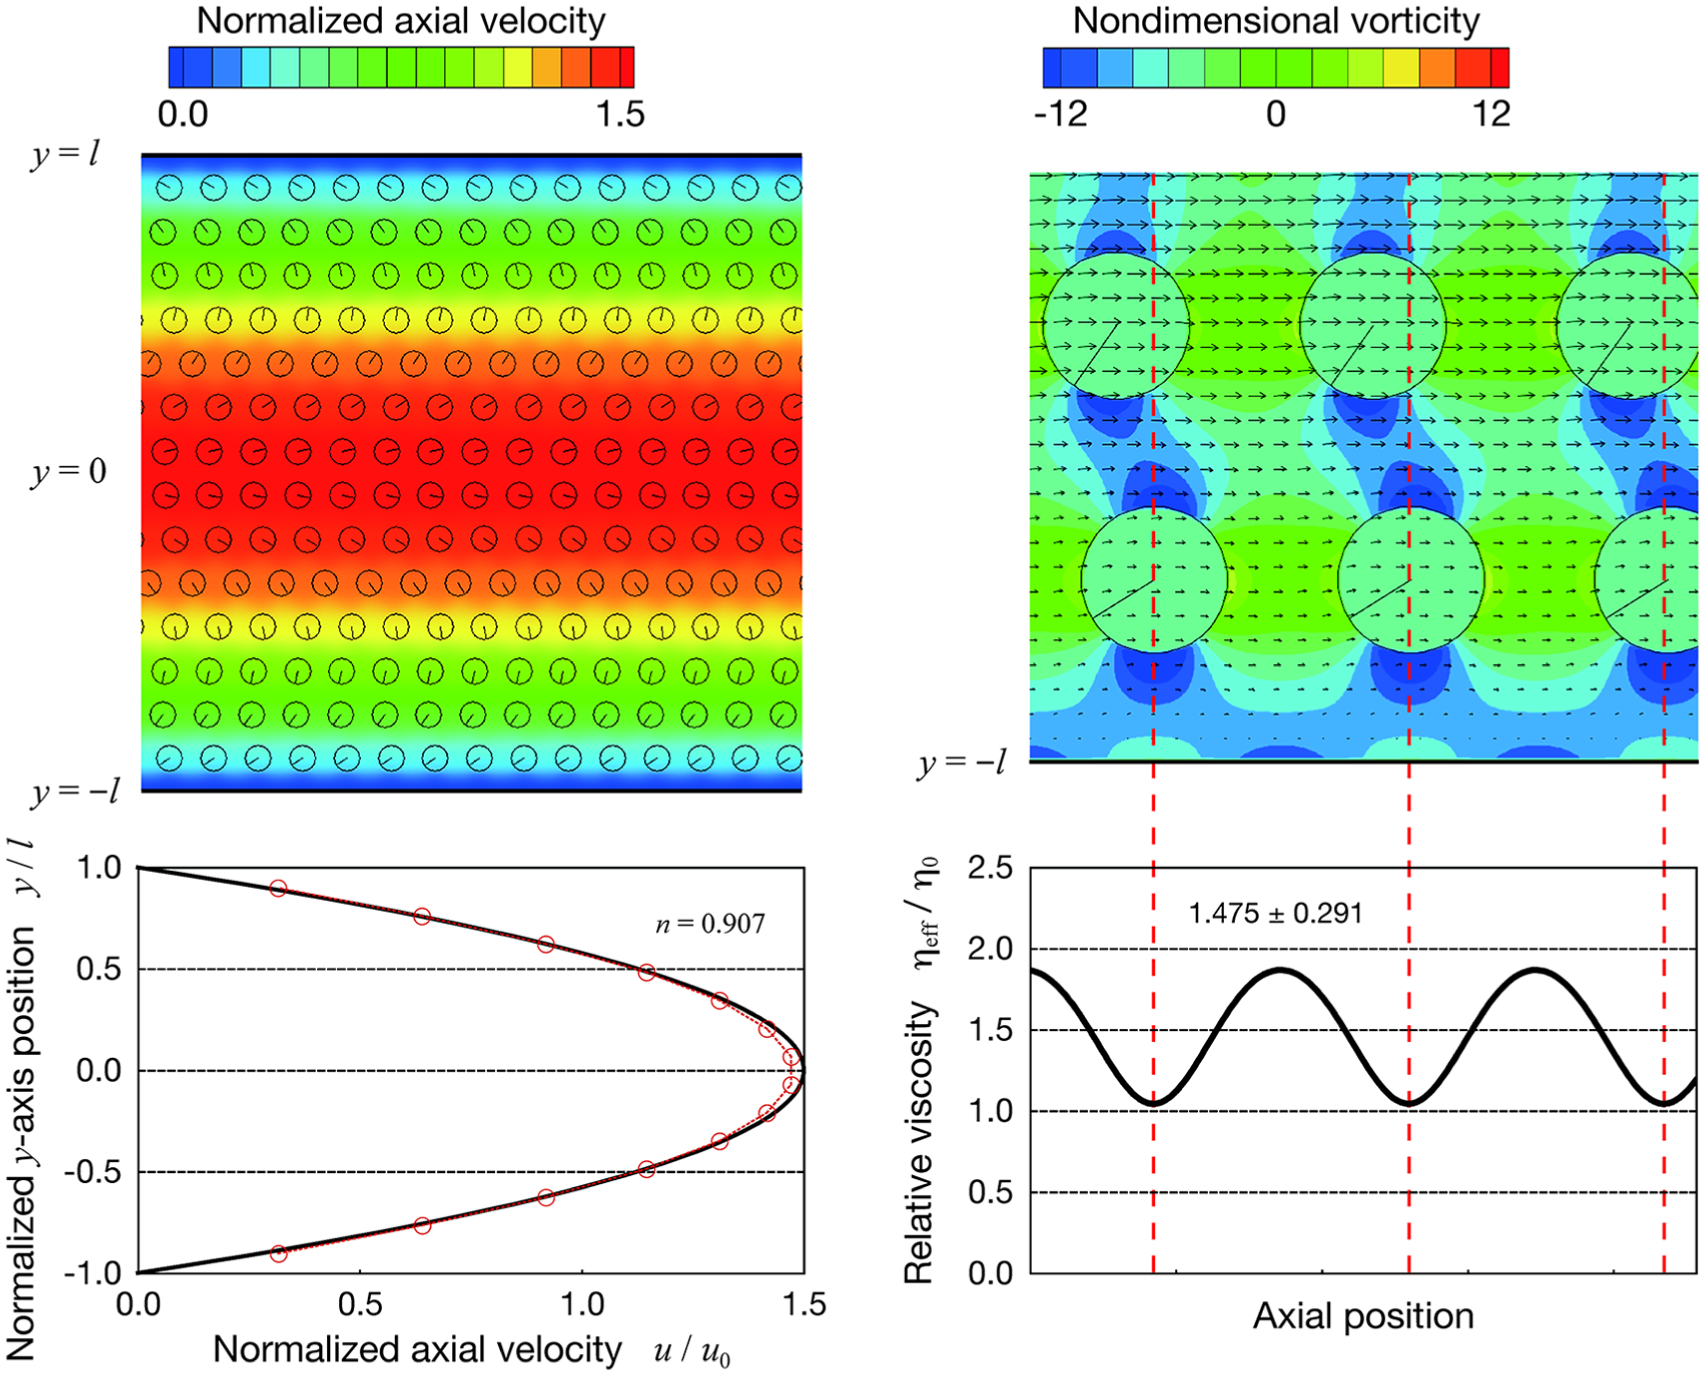
Normalized axial velocity distributions (top left), velocity profile (bottom left), enlargement of non-dimensional vorticity distributions near the lower wall (top right), and relative viscosity diagram (bottom right) for particle radius r = 30 µm (C = 0.0200), concentration φ = 25.13%, and Reynolds number Re = 1. The value n and the solid line in the velocity profile indicate the power-law index and the Newtonian theoretical solution without particles, respectively. Dashed red lines across the figures on the right denote axial positions of minimum relative viscosity.
The arrows in the figure showing the non-dimensional vorticity distributions (top right) indicate the velocity vectors. The dashed red lines across the figures on the right denote the axial positions of the minimum relative viscosity. The relative viscosity is expressed by the spatial mean ± 1 SD. As mentioned in our previous study, 18 the lowest wall shear stress region lies just below the near-wall particles. Owing to the rotational motion of the near-wall particles, which decrease the shear rate near the walls, the wall shear stress decreases when the particles approach the wall. This undulating wall shear stress distribution in time and space resulting from the existence of suspended particles, even when the macroscopic flow is steady, is important, for example, when the mechanical stresses are considered in microcirculation. Blood flows, including red blood cells in microcirculation, are almost steady; however, the wall shear stresses could be unsteady or even pulsatile if our computational results are taken into consideration. The quantity of biochemical substances produced by endothelial cells depends on the temporal and spatial gradients, as well as the maximal wall shear stress value. The production quantity of prostacyclin (PGI2), which is known to be a vasodilator, 23 is strongly dependent on the flow conditions. 24 Steady and pulsatile flows result in physiologically different amounts of PGI2 production even when the time-averaged wall shear stress in the cardiac cycle is the same. It should be noted that microspheres themselves strongly influence near-wall microfluidics, as mentioned by Damiano et al. 25
The relative viscosity determined from the relative wall shear stress was 1.475 ± 0.291, which is compatible with that from Einstein’s viscosity formula (1.503); however, the difference between the values increased with increase in the confinement. In fact, we previously reported that the relative viscosity for the confinement C = 0.0133 was 1.511 ± 0.281, 18 which is closer to that from Einstein’s viscosity formula. This is because Einstein’s viscosity formula is based on the assumption that the confinement takes a limit of zero, in which case the suspended particles are infinitesimally small compared with the channel width.4,26,27
The influence of the confinement C of suspended particles on the relative viscosity of a suspension under the constraints of concentration ϕ = 25.13% and Reynolds number Re = 1 is shown in Figure 4. The solid line denotes the relative viscosity estimated from Einstein’s viscosity formula (1.503). The data plotted are the spatial mean ± 1 SD. In general, the relative viscosity and its spatial variation decrease as the confinement of the suspended particles increases. Within ±1 SD, our computational results are consistent with those from Einstein’s formula in the range C < 0.06 on the condition that the suspended particles are independently and homogeneously distributed. Nevertheless, the mean values agree more closely with those of Einstein’s formula when C is less than 0.02. According to experimental data from Ramaswamy et al., 28 the relative viscosity kept constant against the confinement for C < 0.02. Then, a decrease in the viscosity was suddenly observed when the confinement C exceeded 0.033. These data are consistent with those from our computational studies.

Influence of confinement C of suspended particles on relative viscosity of a suspension for concentration φ = 25.13% and Reynolds number Re = 1. Solid line denotes relative viscosity estimated from Einstein’s viscosity formula (1.503).
By contrast, for the highest confinement condition (C = 0.2433) in this study, in which all particles were channel-centered, the relative viscosity decreased to 1.085 ± 0.062, which is consistent with previously reported results.1,29,30 This decrease for higher confinement suspensions can be attributed to the wide gaps in the y-direction (see Table 1) between the near-wall particles and the channel wall. The particles were distributed independently and homogeneously as an initial condition, and no Segré–Silberberg particle migration occurred because of the low Reynolds number. As a result, the gaps between the near-wall particles and the channel wall were not changed significantly during the simulations, resulting in a flat concentration profile. Stickel and Powell 6 mentioned the importance of the suspension microstructure, which is defined by the positions of the suspended particles relative to each other and can be described by a pair-distribution function 31 in order to consider the non-Newtonian rheology of suspensions. Doyeux et al. 4 considered that the effective viscosity depends only on the particle distance from the wall and the confinement, and the viscosity of the system increases when the particle approaches the wall. Sangani et al. 27 showed that the presence of the walls increases the particle stresslet and, therefore, increases the total viscous dissipation. The local concentration profile of the suspension, as well as the velocity profile for various bulk concentrations, was also investigated.32,33 By taking these findings into consideration, the gap gy between the near-wall particles and the channel wall in our simulations could be one of the most important factors in determining the relative viscosity of a suspension.
Recently, Ramaswamy et al. 28 showed confinement effects of a colloidal suspension on the relative viscosity by experimental studies. They especially focused on the regime of confined flows because suspensions often display a rich range of structures below confinement C of 0.05. Their experimental device can simultaneously shear the suspension, measure its rheology, and image its structure. For the higher confinement condition, they considered the influences of the concentration of a suspension on the decrease in the relative viscosity. They found that the lower concentration suspension shows significantly less decrease in relative viscosity under confinement. This is because the key change in the microstructure accompanying the decrease in the viscosity is attributed to the ordering of particles into layers parallel to the walls as the suspension is confined. The lower concentration suspensions exhibited less decrease because their microstructure never formed full layers. In our computation, the relative viscosity under the condition of confinement C = 0.128 and concentration ϕ = 25.13% was 1.258, which corresponds to a decrease ratio in relative viscosity of 0.163 by that from Einstein’s formula. The decrease ratios in viscosity for the corresponding confinement were found to be 0.35 for ϕ = 38% and 0.8 for ϕ = 52%, respectively. 28 Although the concentrations of their suspensions were higher than that of ours, these tendencies are compatible.
The relationship between the power-law index n and the confinement of the suspension C is shown in Figure 5. These results were obtained under a condition of the concentration ϕ = 25.13% and Reynolds number Re = 1. Note that because at least three suspended particles in the width (y-axis) direction are necessary for the power-law fitting, the maximal confinement C is limited to 0.0893 in this study. As seen in Figure 5, a greater non-Newtonian (thixotropy) property can be observed with an increase in the confinement C. Mueller et al. 2 considered the importance of the non-Newtonian thixotropic property with increase in the concentration for ϕ > 25% and mentioned that the dependence of shear-thinning on the concentration ϕ is attributed to the micromechanics of interactions between particles. Our results suggest that the dependence of shear-thinning on the confinement C, as well as on the concentration ϕ, is important when the non-Newtonian behavior of a suspension is considered. As mentioned by Sangani et al., 27 flows of suspensions of neutrally buoyant particles through channels of width comparable to the dimensions of the particles are of considerable interest because of their occurrence in several experimental, biological, and technological systems—including blood flow in capillaries, porous media, and microfluidic devices. The non-Newtonian properties of highly confined suspensions should be investigated more multilaterally in future works.
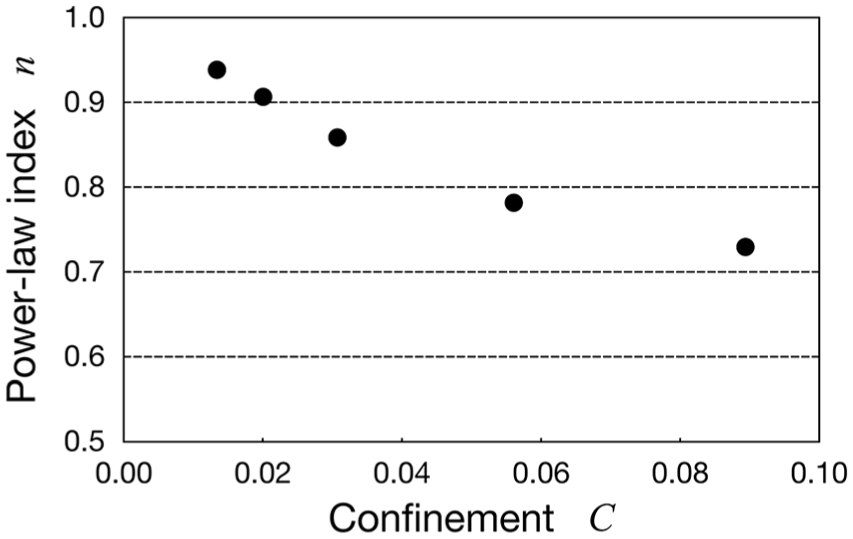
Relationship between power-law index n and confinement C for concentration φ = 25.13% and Reynolds number Re = 1.
Figure 6 shows the relative viscosity of the suspension as a function of the Reynolds number Re for the concentration ϕ = 25.13% and the confinement C = 0.0893. The data plotted are the spatial mean ± 1 SD. The solid line denotes the relative viscosity as obtained through Einstein’s viscosity formula. For lower Reynolds numbers, the relative viscosity values obtained from the computation are lower than those from Einstein’s viscosity formula because of the higher confinement C as discussed previously; however, the values suddenly increase in a non-successive manner with an increase in the Reynolds number Re. At the corresponding Reynolds number Re, the non-Newtonian behavior also changes from thixotropy (shear-thinning, n < 1) to dilatancy (shear-thickening, n > 1), judging from the power-law index n, as shown in Figure 7.
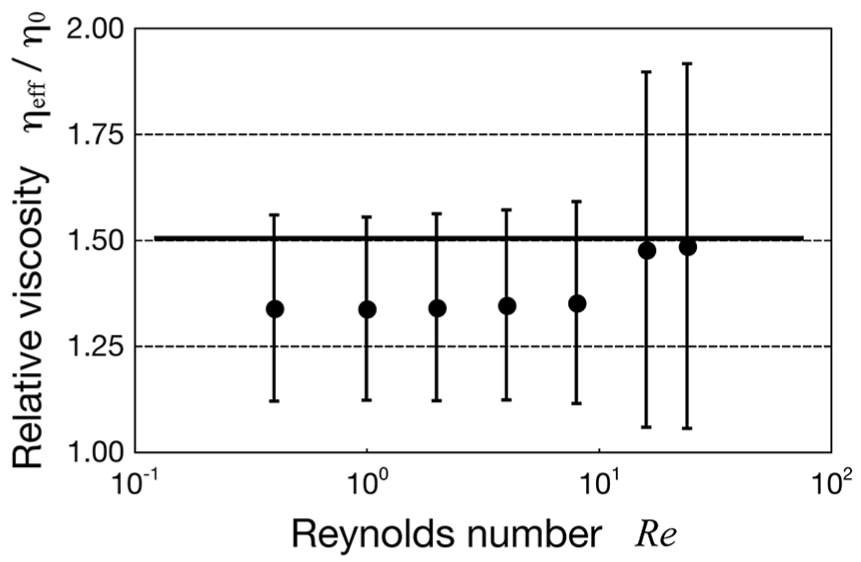
Relationship between relative viscosity and Reynolds number (0.4 < Re < 24) for concentration φ = 25.13% and confinement C = 0.0893. Solid line indicates relative viscosity from Einstein’s viscosity formula (1.503).

Relationship between power-law index n and Reynolds number (0.4 < Re < 24) for concentration φ = 25.13% and confinement C = 0.0893.
In previous experimental studies, shear-thickening rheology was observed when the inertial effects were dominant.34,35 Stickel and Powell 6 mentioned that inertial effects become important at the particle Reynolds number Rep > 10−3. The particle-scale Reynolds number Rep is defined as Rep = Re(2r/2l)2 = 4ReC2, 36 where Re is the channel-scale Reynolds number. It should be noted that the definition of the confinement C is either C = r/2l4 or C = 2r/2l;27,37 therefore, the corresponding particle Reynolds number yields are Rep = 4ReC2 or Rep = ReC2, respectively. The particle Reynolds number Rep for our computation when the non-Newtonian property changes to dilatancy corresponds to 0.511, which is so large that inertial forces are dominant. 6 The critical particle Reynolds number, at which the non-Newtonian property changes from thixotropy to dilatancy, may lie between ∼0.3 and 0.5 for a suspension with rigid spherical particles.
In consideration of the transition of non-Newtonian behavior, the normalized axial velocity and suspended particle flows for the concentration ϕ = 25.13%, confinement C = 0.0893, and Reynolds number Re = 16 (Rep = 0.511) are shown in Figure 8. The dashed lines across the figures denote the initial y-axis positions of the near-wall particles. Because of the independent and homogeneous particle conditions, the suspended particles flowed uniformly in a well-regulated and periodic manner at the beginning (left, t = 0.225 s). Then, the near-wall particles gradually drifted toward the channel walls (right, t = 6.750 s). This movement is known as shear-induced particle migration or Segré–Silberberg particle migration,29,38 which never occurs at a lower Reynolds number. The time history of the y-axis position of the suspended particles and the lift coefficient diagram of the suspended particles as a function of the y-axis position are shown in Figure 9. The dashed red lines across the figures denote the y-axis equilibrium positions resulting from the particle migration. The near-wall particles gradually drifted toward the Segré–Silberberg equilibrium positions, which correspond to the y-axis positions for the lift coefficient Cl = 0. The final equilibrium y-axis positions y/l were ±0.66 with the concentration ϕ = 25.13%, confinement C = 0.0893, and Reynolds number Re = 16 (Rep = 0.511).
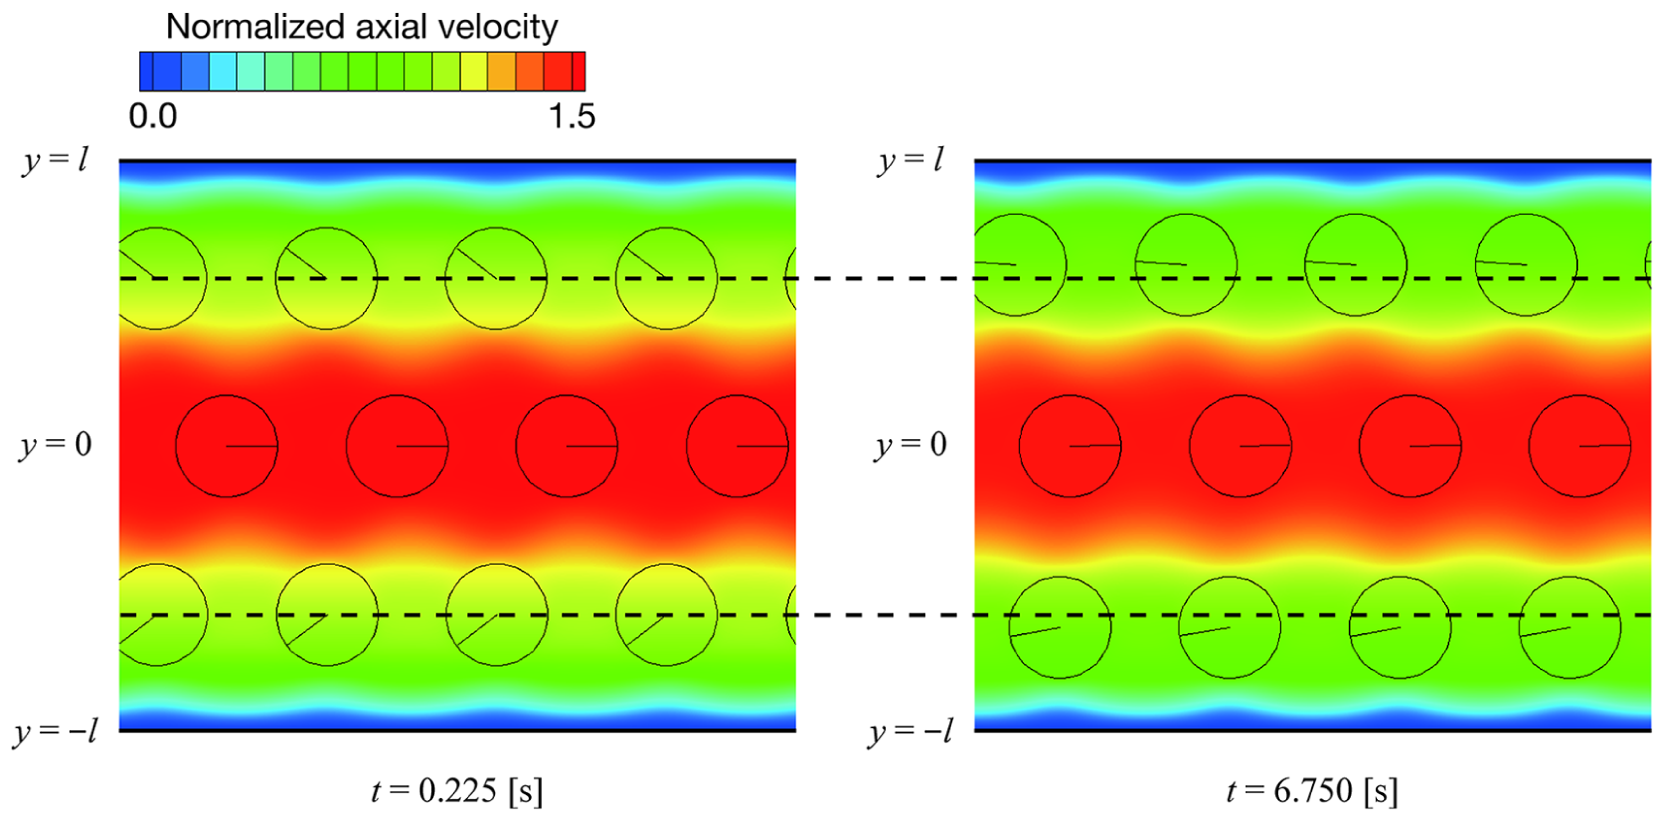
Normalized axial velocity distributions for particle radius r = 134 µm (C = 0.0893), concentration φ = 25.13%, and Reynolds number Re = 16 (Rep = 0.511). Dashed lines across figures denote initial y-axis positions of near-wall particles.

Time history of the y-axis position of suspended particles for particle radius r = 134 µm (C = 0.0893), concentration φ = 25.13%, and Reynolds number Re = 16 (Rep = 0.511), and lift coefficient diagram of suspended particle as a function of y-axis position. Dashed red lines across figures denote y-axis equilibrium positions resulting from particle migration.
In a study of the Poiseuille flow of a dilute suspension of neutrally buoyant spheres, Segré and Silberberg 39 observed that a single rigid sphere in a pipe flow generally migrated to an equilibrium position with its center located at r/R = 0.6, with R being the pipe radius. The equilibrium position of our computation is closer to the channel wall than that of Segré and Silberberg. 39 This discrepancy can be attributed to the differences in the Reynolds number Re or the confinement C. Matas et al. 40 found that the equilibrium position shifts toward the wall when the Reynolds number Re is increased; by contrast, it shifts toward the center when the confinement C is increased. In observing non-neutrally buoyant spherical particles in a vertical flow, Jeffrey and Pearson 41 suggested that particles leading the flow migrate toward the wall, whereas particles lagging the flow migrate toward the axis. Concerning the concentration of a suspension, Han et al. 42 observed that concentration effects do not modify the location of the Segré–Silberberg equilibrium position; rather, these effects only induce a strong dispersion in the particle distribution. For non-spherical soft particles, vesicles always migrate toward the flow centerline, 43 unlike surfactant-free drops, whose migration direction depends on the viscosity ratio.44,45 In any case, the near-wall particles in our study moved outward because of the Segré–Silberberg particle migration, and this migration may change the non-Newtonian behavior and relative viscosity of a suspension. Because the viscosity of the system increases when the suspended particles approach the channel wall, 4 a sudden relative viscosity increase occurs at Re = 16 (Rep = 0.511) as a result of outward particle migration, as shown in Figure 6. The transition of the non-Newtonian property from thixotropy to dilatancy could be accomplished because of an increased Reynolds number Re, which causes the near-wall particles to migrate closer to the wall. 40 As Stickel and Powell 6 mentioned previously, it is useful to consider the suspension microstructure, which is defined by the positions of the suspended particles relative to each other, in order to gain further insight into the non-Newtonian rheology of suspensions.
Suspension is a potential fluid because its macroscopic rheological properties are altered owing to suspended particles’ behavior, that is, its microstructure. Therefore, smart control of suspension rheology can be achieved if its microstructure could be handled at will. In this study, we focused on the inertial effects of particles on its microstructure. As a result, the particle size effects caused a viscosity reduction. However, the effective viscosity under a high Reynolds number condition increased to the contrary. It can be stated that inertia is one of the promising factors to control suspension rheology.
Conclusion
We used a two-way coupling computational method to consider the inertial effects of suspended particles on the macroscopic rheology of a suspension. With our method, we determined that the relative viscosity of the suspension decreases with increase in the particle size, even when the concentration of the suspension is the same. Note that the confinement C of a homogeneous suspension should be less than 0.02 for the application of Einstein’s viscosity formula. The relative viscosity of the suspension under a high Reynolds number increases because of the outward particle migration, and the non-Newtonian property of the suspension changes from thixotropy to dilatancy. It can be stated that inertia is one of the promising factors to control suspension rheology.
Footnotes
Appendix 1
Handling Editor: James Baldwin
Declaration of conflicting interests
The author(s) declared no potential conflicts of interest with respect to the research, authorship, and/or publication of this article.
Funding
The author(s) received no financial support for the research, authorship, and/or publication of this article.