
Abstract
Water flooding is widely used to enhance oil recovery in the oilfield. Advanced water injection technology has proven to be an effective method of development for these low permeability reservoirs. Nevertheless, the fluid flow in a low permeability reservoir is governed by non-Darcy flow and the threshold pressure gradient effect. Several efforts have been made experimentally and numerically to design and optimize the field operation parameters. However, it is still challenging to simulate and predict the impact of various injection parameters on well performance in a computationally efficient manner. A simple and efficient semi-analytical model is developed for advanced water injection which considers non-Darcy flow and threshold pressure effects. The stimulated reservoir volume can be evaluated by calculating the pressure gradient distribution. The impact of water injection rate, total injection volume, and injection time on stimulated reservoir volume is investigated. Finally, a field-scale numerical simulation and experiment are conducted to validate the proposed model. This model provides reservoir engineers a simple and accurate tool for predicting, evaluating, and optimizing the advanced water injection operation practices.
Keywords
Introduction
Nowadays, more and more enhanced oil recovery (EOR) technologies are applied in the oilfield to improve well production, such as chemical flooding, steam flooding, and polymer flooding. Water flooding is still a primary way to increase oil production because of its low costs. 1 In order to solve the low sweep efficiency of water flooding, low salinity water injection is an efficient and economical measure to enhance oil recovery. Compared with conventional water flooding, the wettability and interfacial tension can be changed by low salinity water to increase the relative permeability of oil. 2 Al-Shalabi and Sepehrnoori et al. provided a new insight into the improved oil recovery mechanisms of low salinity water injection.3,4 The interaction between oil and micelle formation is the main factor to bring additional oil recovery based on experiments of core flooding and spontaneous imbibition. Based on the pressure drop and oil production data, Shojaei et al. 5 studied the capillary pressure and relative permeability curves of oil displacement by low salinity water. These parameters are a function of water saturation and salinity, and the function changed linearly with salt concentration. Polymer flooding is also an effective solution to improve the sweep efficiency, especially in heavy oil reservoirs. Because the wettability can be changed by a polymer from oil-wet to water-wet, the displacement efficiency of polymer flooding is stronger than water flooding. 6 Low permeability reservoirs have small pore throats and relatively high threshold pressure gradients.7–9 Because of the higher seepage resistance and non-Darcy flow, the sweep efficiency of water flooding is low.10,11 The advanced water injection method is an effective technology to improve the sweep efficiency and oil recovery. The water is injected into the formation before the producers begin to operate, and a new equilibrium state of higher formation pressure is formed. The injection water will flow into the high permeability zone first and then flow into the low permeability formation, thus reducing the pressure difference between high and low permeability zones and improving the sweep area.12,13 Li et al. 14 measured the production of 142 oil wells under different water injection schemes in the Changqing low permeability formations. The statistical results show that the oil production decline rate with advanced water injection is significantly lower than the rate with conventional waterflooding. Several authors proposed different advanced water injection schemes in different oilfields, using commercial simulator and field data.15–17
Reservoir numerical simulation is widely used to perform history matching and compute production data for optimizing the water flooding operation parameters. 18 Chetri et al. 19 integrated the production history, water injection rate, and pressure monitoring to study the interwell connectivity and water flooding response. Sayyafzadeh et al. 20 provided a simple and fast method to predict the performance of water flooding. They used Transfer Functions, which is a combination of black boxes, to predict the production of oil well and injected water. The model proposed in this article is derived from flow equation and the threshold pressure gradient is taken into account, which reflects the fluid flow characteristic in low-permeability reservoirs. On the contrary, this model can also consider the effect of well types. Hence, the model is more accurate. Liu et al.21–23 used an Extended Kalman Filter to establish the weighting factors between injection wells and production wells. Thus, injection rate and total available water amount could be optimized.
In order to optimize water injection parameters, Xie et al. 24 analyzed the in-situ stress state around the injection wells and established a fracture model to calculate the influence of natural fractures on water injection pressure. Asadollahi and Naevdal 25 presented an adjoint gradient method of real-time optimizing water flooding parameters in an oilfield. The water flooding volumetric sweep coefficient is also an important parameter for evaluating the performance of field water flooding. Based on the water flooding characteristic curve, basic principle of mass balances, and function of water saturation, Hu 26 proposed a new method to calculate displacement and volumetric sweep efficiency. In the high water-cut stage, the linear relationship between the relative permeability ratio and water saturation is not applicable, and the water flooding curve would turn upward. 27 Song and Liu et al. integrated the core data, water drive equation, and water saturation equation to construct a new high water-cut water flooding curve.28,29
The water injection pressure, water injection rate, injecting time, and bottom-hole flowing pressure are the key parameters. In this article, a new method of optimizing advanced water injection parameters is established. According to the non-Darcy flow model in low permeability reservoirs, stimulated reservoir volumes (SRV) and formation pressure could be calculated to optimize water injection rate, the total amount, and reasonable injecting time. The computed results show a good agreement with those obtained from commercial simulators and field practice. This method could efficiently optimize the water injection parameters for maximizing the oil recovery.
Flow mechanism and mathematical model of advanced water injection
The mechanism of advanced water injection for improving sweep efficiency
The formula for calculating oil production is
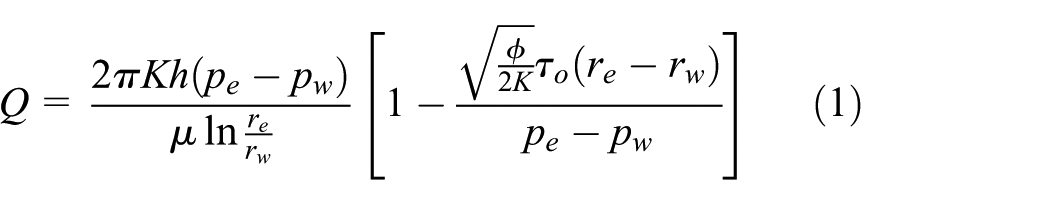
where
As shown in equation (1), when the bottom hole pressure is constant, a higher oil production can be obtained by increasing the production pressure difference. When water has been injected into the formation prior to the production of oil well, the average formation pressure will be increased. In addition, because the throats of pores in low permeability oilfields are very small, the influence of flow resistance on fluid flow of oil should not be ignored, which can be expressed in the form of a threshold pressure gradient. If the pressure gradient is greater than the threshold pressure gradient, a larger SRV will be covered to improve the oil production.
Threshold pressure gradient is the effect of such factors as reservoir permeability, pore throat ratio, the viscosity of the fluid, and saturation of non-wetting phase. Figure 1 shows the relationship between the threshold pressure gradient and formation permeability. The threshold pressure gradient is inversely proportional to the permeability. The lower the permeability result is, the larger the threshold pressure gradient is. Therefore, a larger pressure gradient is required to produce the oil in such low permeability reservoirs.

The relationship between threshold pressure gradient and permeability. 31
The mathematical model of fluid unsteady flow through low permeability reservoirs
The determination of adequate water injection can be achieved by using the following steps. First, reservoir numerical simulation can be used to investigate the influence of different injection parameters on the oil production. Second, the relationship between water injection rate and oil production rate can be studied based on the reservoir engineering. Although reservoir simulation is widely used and accurate, time-consuming simulation and need for lots of data are the main problems that restrict the use of numerical simulation method. The other methods are composed of analytical models, empirical models, and semi-empirical models. These types of methods need lots of field data, and the accuracy is usually not acceptable. Hence, we present the development of a new method to optimize water injection rate based on nonlinear multi-phase porous flow theory. This method is faster and requires only a few data.
The semi-analytical model is developed to consider non-Darcy flow effect. Several assumptions are stated as follows:
Rock and fluid are considered slightly compressible, and reservoir temperature is constant;
The threshold pressure gradient is considered;
Regardless of the influence of gravity and capillary force;
The outer boundary is considered to be closed;
Reservoirs are homogeneous. Porosity and permeability are constant and isotropic;
Prior to water injection or production, formation pressure is uniformly distributed in the reservoir.
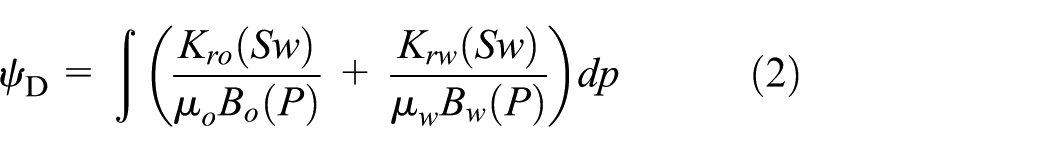
Based on the water-oil phase flow theory, the equation of pseudo-pressure could be defined as
When the threshold pressure gradient exists, the dimensionless mathematics model of the water-oil phase transient well test is as follows:
Flow equation 32

Initial condition

Inner boundary condition

Outer boundary conditions (closed)

where dimensionless pseudo-pressure
Taking Laplace transform and implementing Lord Kelvin point source solution, the simplified expression of equation (3) is
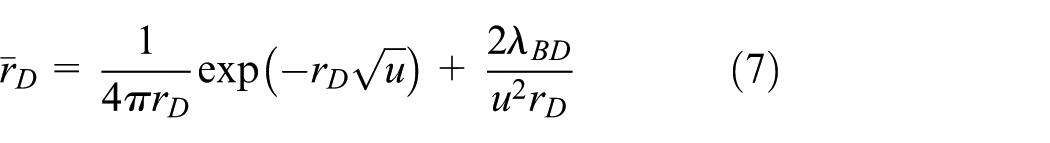
where

Mirror reflection transformation.
If
Therefore, the general solution of a closed domain is
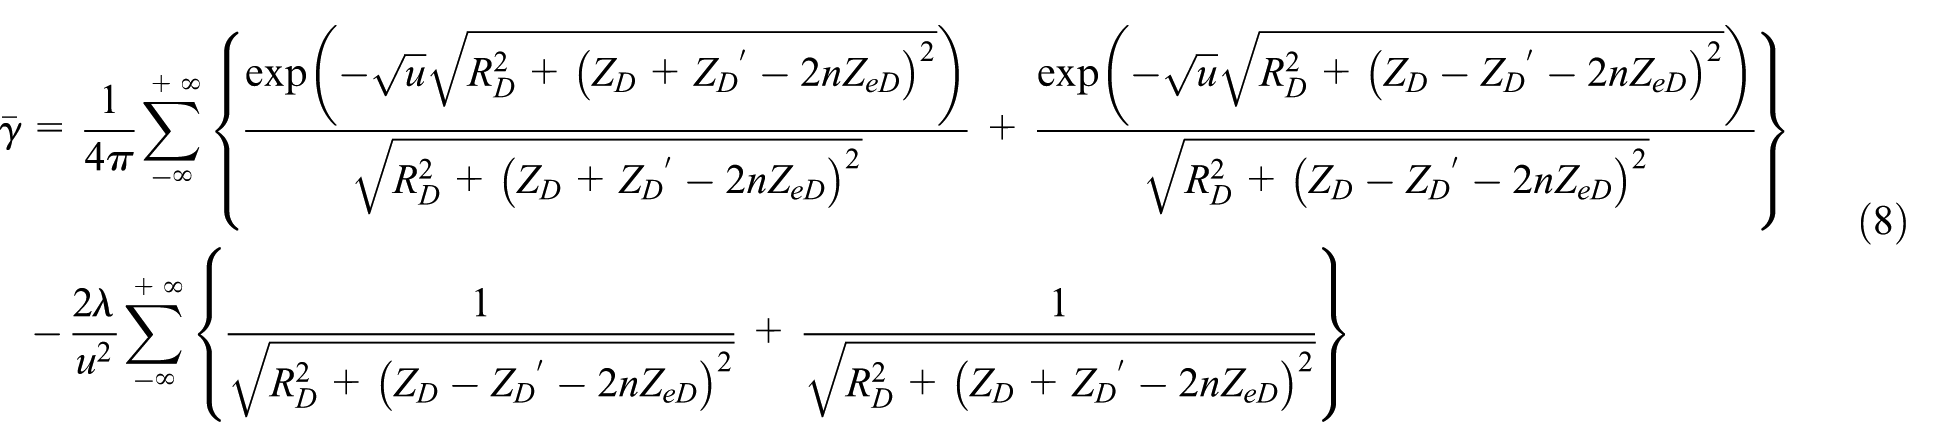
In equation (8)


where
Equation (8) could be simplified by using series function integration properties, Poisson superposition formula, and Laplace transform, as follows

Specially, taking equation (11) integral in the direction of well, the Laplace solution of a vertical well is given by


Similarly, the Laplace solution of a fractured well is given by

The expression

where
and where N is generally as 6 or 8.
According to the mathematic model of fluid unsteady flow through low permeability reservoirs, the fluid flow stage mainly include the following three stage. The first stage happens in the wellbore. Fluid flow in the filtrate-invaded zone in the second stage, and there exists a threshold pressure gradient. Finally, fluid flow in strata and there also exists a threshold pressure gradient. The schematic of unstable seepage model is shown in Figure 3.

The basic schematic of unstable seepage model.
Sensitivity study
FuYang reservoir is a lithologic reservoir of Daqing oilfield. The river channel development scale is small and sand layer thickness is thin on the longitude. The porosity in FuYang reservoir mainly ranges from 10% to 16%, and average porosity is 12.5%. Air permeability generally ranges from 1 to 9 mD, and average permeability is 3.0 mD, which means the FuYang reservoir belongs to the low permeability reservoirs. FuYang oil layer has a certain production capacity by evaluation of test, but the oil production strength is small and the production decline degree is large. In order to effectively develop FuYang reservoir, advanced water injection method has been tested in Gao45-16 block to validate technical feasibility for FuYang reservoir.
The physical parameters of the reservoir are adopted into equations (12) and (13) to obtain the formation pressure distribution of advanced water injection under the condition of existing well pattern. Injection wells are divided into vertical wells and fractured wells; oil wells are fractured wells. The calculation data can be drawn to a plane graph. As shown in Figures 4 and 5, the formation pressure would be increased by water injection. When the injection well is a fracturing well, water will flow from the hydraulic fracture to the further zones of well. This helps to increase the water flooding sweep area and displacement pressure in low permeability area.

Formation pressure distribution (advanced injection well is fractured wells).

Formation pressure distribution (advanced injection well is vertical wells).
According to the superposition theory, each production and injection of a well would affect the formation of pressure distribution in the process of multiple well productions. When multiple wells are producing at the same time, formation pressure drops at any point equal to the integrated producing pressure drop of all wells. The resulting calculations when the daily production rate is 15 m3/d and the water injection rate is 20 m3/d are shown in Figures 6 and 7. When the oil well begins to produce, an effective pressure transmission system has been established between production oil well and injection well. The wider spread of the displacement pressure will enhance the ultimate recovery.

Formation pressure after the production (injection well and oil well are fractured wells).

Formation pressure after the production (oil well is fractured wells).
Effect of injection volume on SRV
When the value of threshold pressure gradient is 0.05 MPa/m in the oilfield, the formation pressure gradient distribution under the existing injection-production well pattern can be obtained to identify the unutilized flow areas. Unutilized flow area is defined as the area where pressure gradient is less than threshold pressure gradient. This means that oil would not continue to flow in these places.
Eight kinds of plans are designed to simulate unutilized flow areas under the different advanced water injection amounts: 60, 600, 1100, 1600, 2100, 2700, 3200, and 3700 m3. The formation pressure gradient and unutilized flow areas are, respectively, calculated and shown in Figure 8. The relationship between the unutilized flow areas and advanced water injection amount shows that the greater the advanced water injection amount is, the smaller unutilized flow areas are (Figure 9). The amount of water injection is not the sooner the better. When the amount of the advanced water injection amount is more than 1600 m3, the decreasing amplitude of undeveloped area changes slowly. Hence, the advanced water injection amount of Gao45-16 block is 1600 m3 and advanced injection volume is 2%PV. The formation pressure would be enhanced by 130% after the water injection.
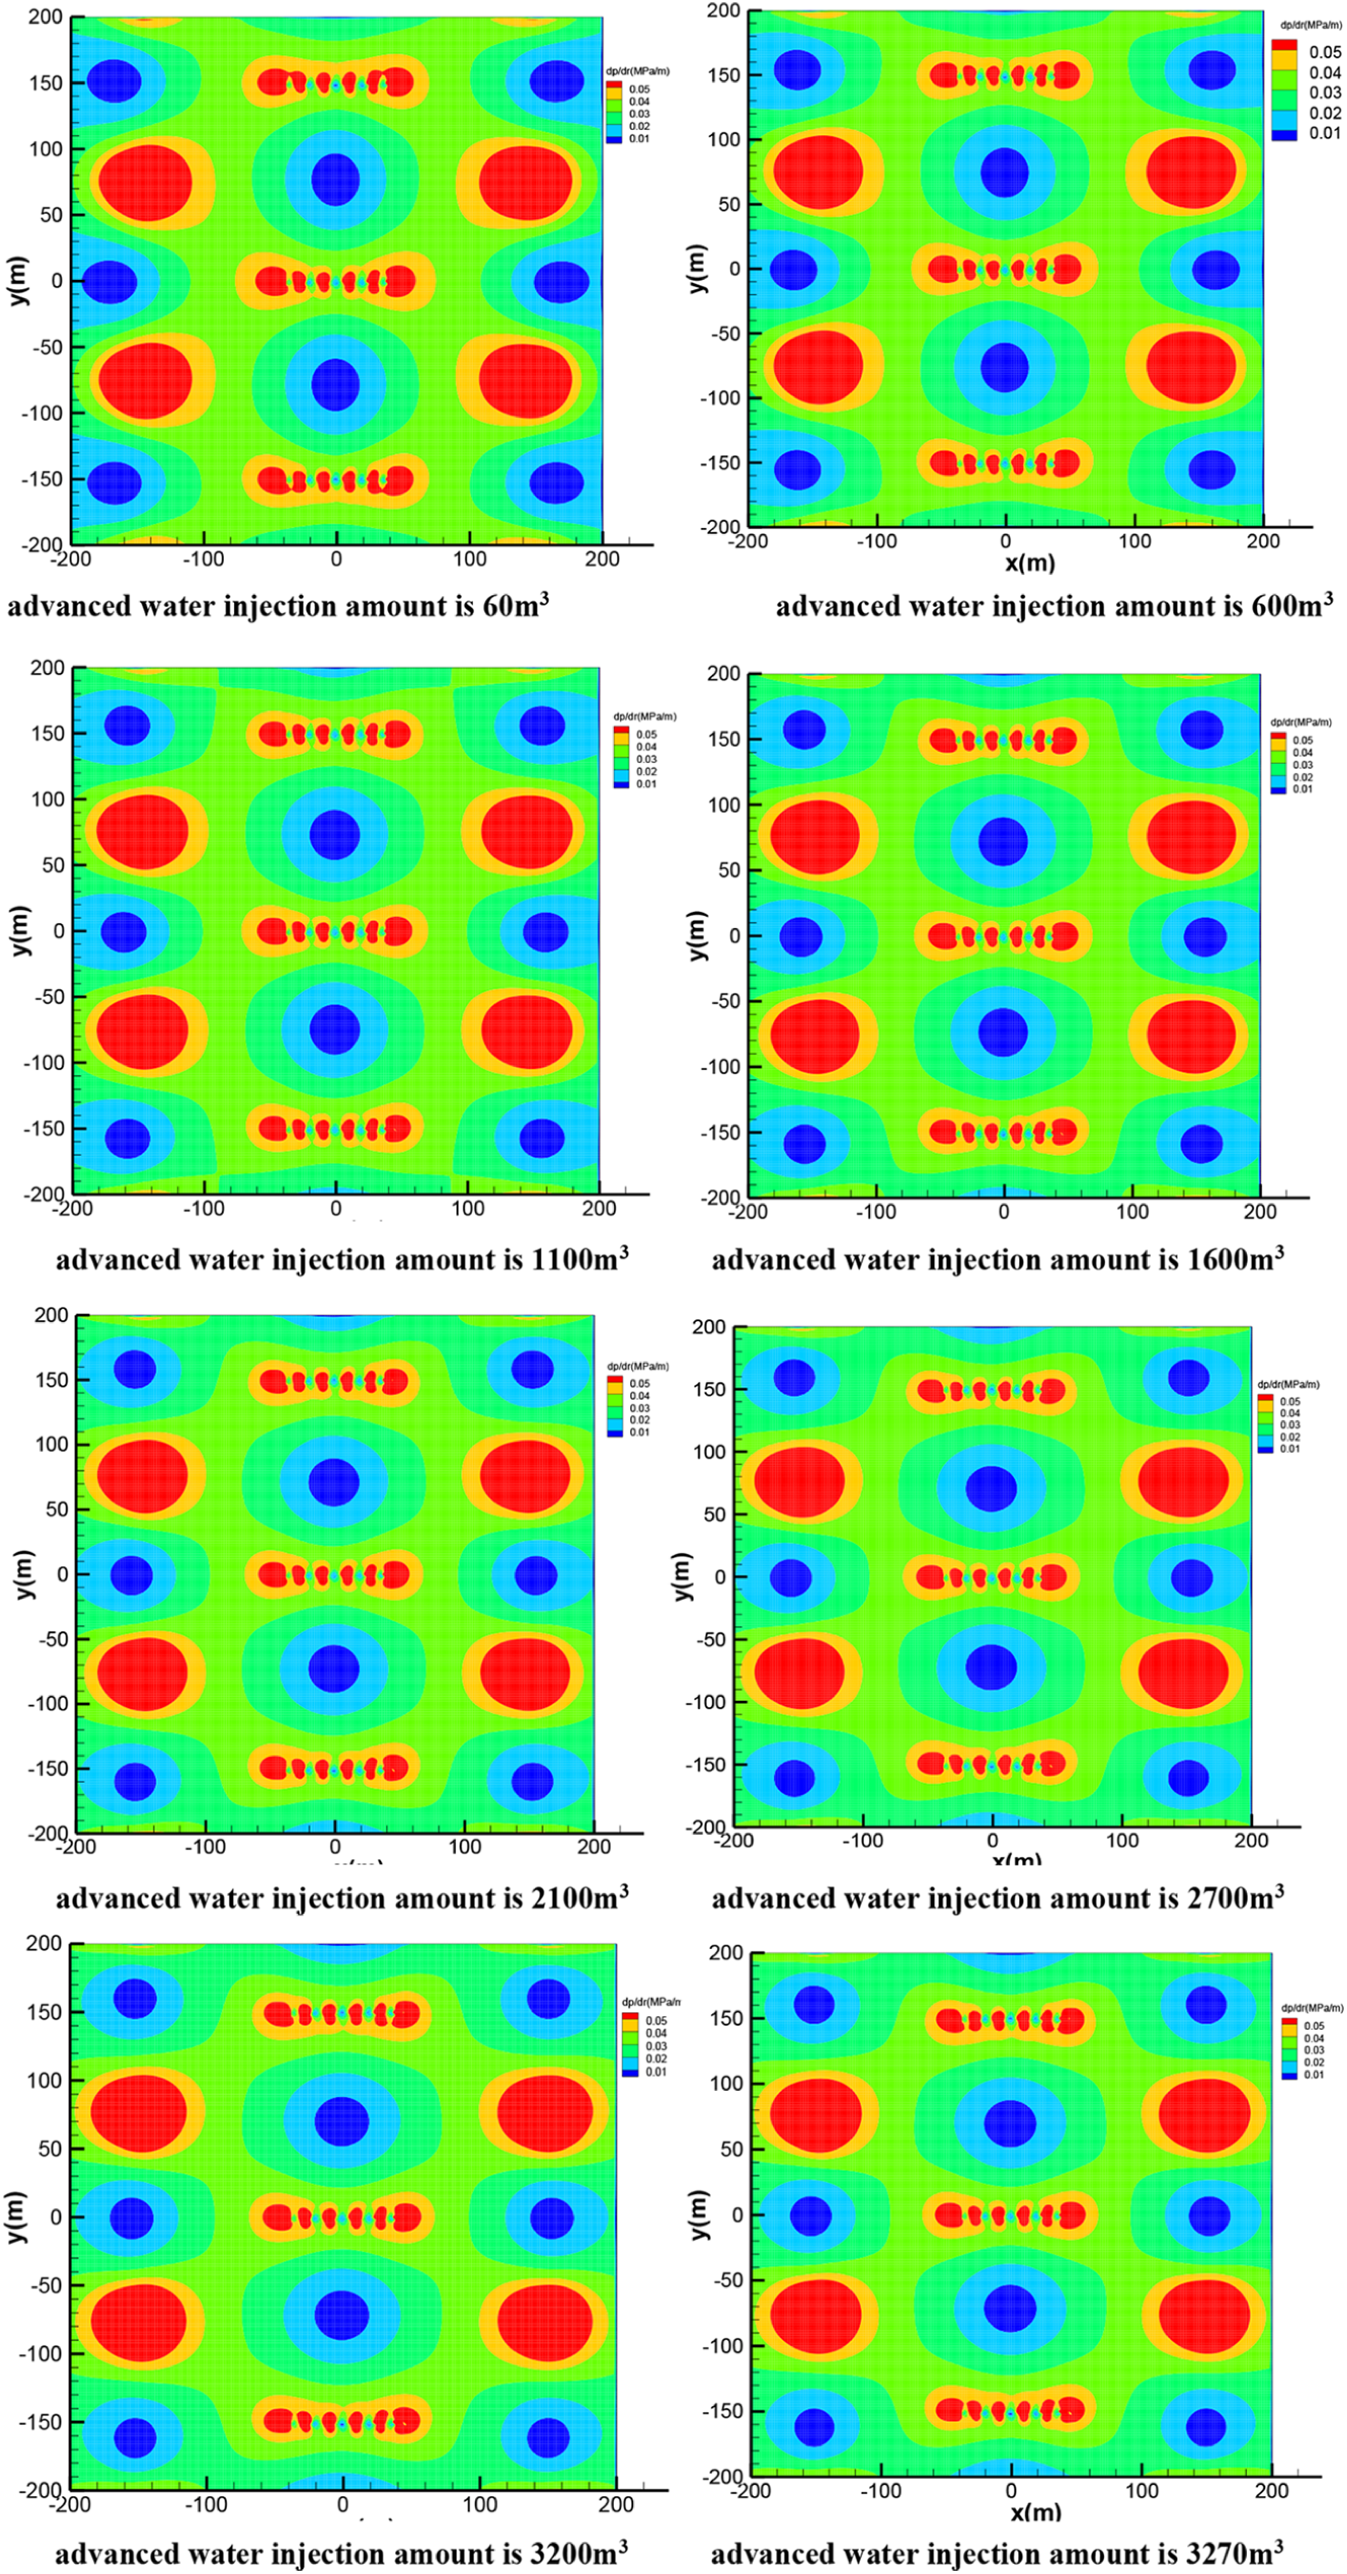
Formation pressure gradient distribution under different advanced water injection amount.
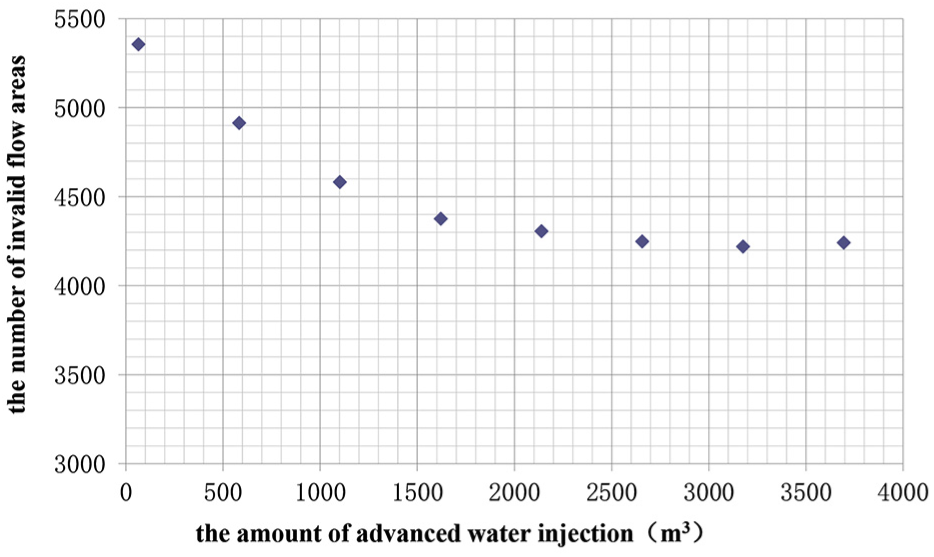
Relationship between different advanced water injection amount and invalid area.
Effect of injection rate on SRV
In the condition of the optimization, advanced water injection amount is 1600 m3, and daily advanced water injection rates, respectively, are 5, 10, 15, 20, 25, and 30 m3/d, which are designed to calculate the relationship between unutilized flow areas and daily advanced water injection rate (Figure 10). As illustrated in Figure 11, when the advanced water injection rate is more than 25 m3/d, the decreasing amplitude of unutilized flow areas changes slowly. The reasonable daily advanced water injection rate is 25 m3/d, advanced injecting time is 60–80 days, and the pressure recovery rate is 10% per month.

Formation pressure gradient distribution under different daily advanced water injection rate.

Relationship between different daily advanced water injection rate and invalid area.
Validation of the method
Validation by reservoir numerical simulation method
In order to validate the accuracy of this method from another perspective, we established the geological model of Gao45-16 block, as shown in Figures 12, and Figure 13 shows the oil water relative permeability curve. On the basis of the geological model, the effect of different advanced water injection amounts and rates on oil production is calculated by numerical simulation.
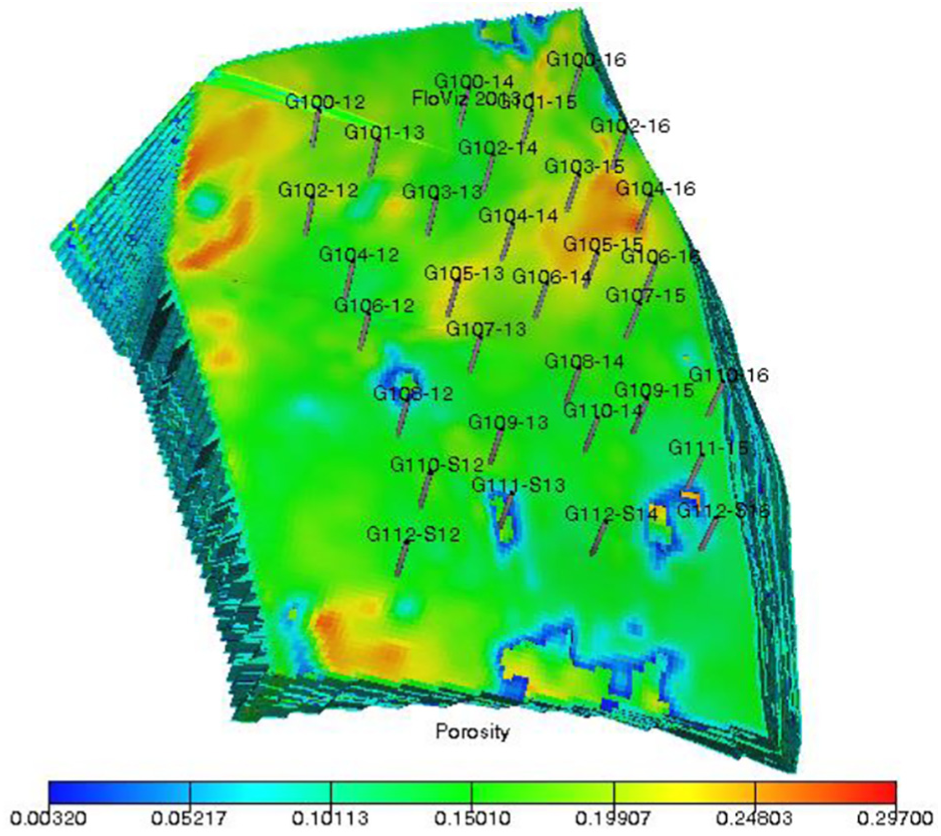
Porosity model of Gao45-16 block.

Oil water relative permeability curve.
The advanced water injection amount is, respectively, designed as 1200, 1500, 1800, 2100, and 2400 m3, and the production time is 10 years. From the numerical simulation results (Figure 14), the optimal advanced water injection amount is 1500 m3 while the cumulative oil production is the most. Compared with the results of the new method, which is 1600 m3, the error is 6.25%. It is validated that the prediction of the new method has reliable results.

Cumulative oil production in different cumulative water injection amounts.
When the advanced water injection amount is 1500 m3, advanced water injection rate is, respectively, designed as 10, 15, 20, 25, and 30 m3/d. The simulation results of oil production are shown in Figure 15. Cumulative oil production increases as the water injection rate rises. When the advanced water injection rate is more than 20 m3/d, the decreasing amplitude of oil production changes slowly. Considering the efficiency and oil recovery, the optimal advanced water injection rate is 25 m3/d, which is equal to the result from the derived model. Numerical simulation results have proved that the new method in this article is reliable.
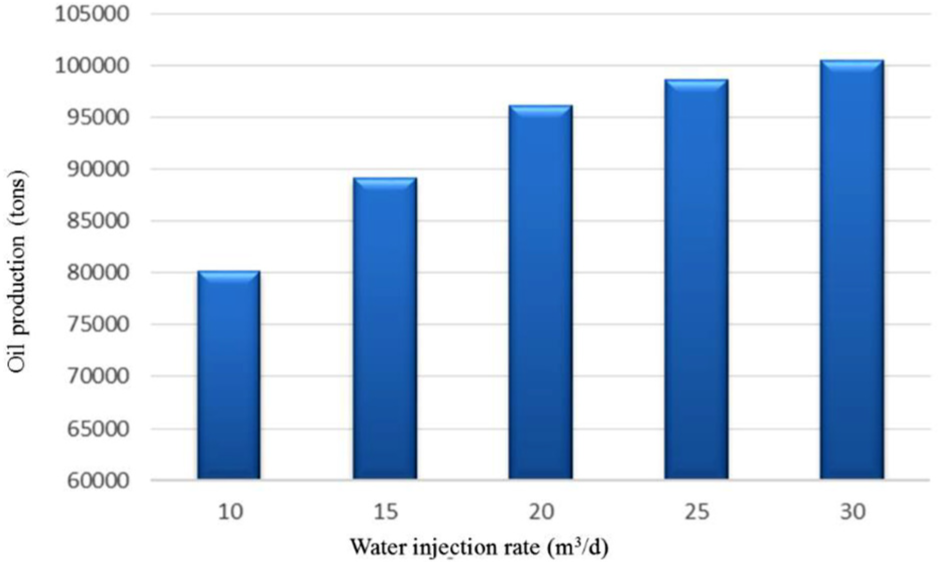
Cumulative oil production in different water injection rate.
Validation by measured production data
In order to find the optimal parameters of advanced water injection, recoverable reserves and ultimate recovery of Gao45-16 block are calculated by water drive curve. Oil viscosity is from 3 to 30 mPa s, and Type A water drive characteristic formula is used.
The expression of water drive characteristic curve is

The relationship between cumulative oil production and the water cut is

The statistical data of water production, oil production, and moisture content in Gao45-16 block are used to calculate recoverable reserves and the ultimate recovery. The calculation results are shown in the Table 1.
The effect evaluation of advanced water injection.

On the basis of statistical data of the relationship among recoverable reserves, oil production index, recovery, and pre-existing advanced water injection amount, the optimal field experience data of unit advanced water injection amount is 124 m3/m (Figures 16–18). The average thickness of reservoir in Gao45-16 block is 13.5 m, so the optimal advanced water injection amount is 1674 m3. Compared with the results of the new method, which are 1600 m3, the error is 4.42%. This has validated that the prediction of the new method is effective for oilfield development in the Fuyu reservoir.

The relationship between recoverable reserves and advanced water injection amount.

The relationship between oil production index and advanced water injection amount.

The relationship between recovery and advanced water injection amount.
Based on the study of production data of oil and water, the results of the new method are a good match with evaluation of development effects. Meanwhile, comparing the results of reservoir numerical simulation, optimization parameters of these two methods are consistent. A lot of geological data and production data are needed for reservoir numerical simulation; the process of calculation is complicated and time-consuming, and the calculation method in this article is more convenient and fast.
Conclusion
Formation pressure could be increased by advanced water injection. An effective pressure displacement system is set up to reduce the rate of formation pressure decline and improve swept oil volume and oil displacement efficiency to eventually enhance the ultimate recovery.
Threshold pressure gradient is an important cause of low oil displacement efficiency in low permeability reservoirs. Considering the effect of threshold pressure gradient, oil-water two phase flow model is established, based on the percolation theory in low permeability reservoirs. The formation pressure distribution could be calculated by a combination of point-source function, Laplace transform and Poisson superimpose formula.
A new and rapid method for optimized advanced water injection parameters is established. The well connectivity between injection wells and productions, unutilized flow areas could be recognized by simulating the formation pressure gradient distribution under different schemes of water injection in advance.
According to the characteristics of the reservoir development and calculation of water injection parameters, the water should be injected 60–80 days in advance in the Gao45-16 field. The total amount of water injection in Gao45-16 field is 1500 m3, and the reasonable water injection per day is 25 m3/d.
Footnotes
Appendix 1
Handling Editor: Hongfang Lu
Declaration of conflicting interests
The author(s) declared no potential conflicts of interest with respect to the research, authorship, and/or publication of this article.
Funding
The author(s) disclosed receipt of the following financial support for the research, authorship, and/or publication of this article: This study was supported by the National Natural Science Foundation of China (Grant No. 51304032, Grant No. 51674044) and Opening fund of State Key Laboratory of Oil and Gas Reservoir Geology and Exploitation (No. PLC201609).