
Abstract
In order to discover the variation of the traffic flow caused by lane change, the article analyzes the minimum safety distance and the lane change time between the lane change vehicle and the vehicles of the target lane based on the theory of vehicle lane change model and Bureau of Public Roads model. The influence time of lane change is determined by choosing two adjacent lanes as the research object according to the minimum safety distance of three kinds of combination. A model to describe the affected speed on lane 2 was established when the vehicle changed lane from 3 to 2 based on the measured data. The research results show that the speed of the target lane affected by the lane change is closely related to the volume of the adjacent two lanes and the acceleration of lane change vehicle. Then, while the more small acceleration of the lane change vehicle was, it would be more big variation traffic speed of the target lane. Finally, when the acceleration of the lane change is between 0.1 and 2.0 m/s2, the influence is more serious than others.
Introduction
Lane change is the common driving behavior of traffic flow, which involves the traffic characteristics of the driver’s feeling, perception, judgment, and operation. When the traffic density is low, it is beneficial for driver to obtain the desired speed and improve the efficiency of traffic. When traffic density is heavy, the opportunity to change lane is small. If the driver is forced to change lane, it will affect the speed of current and target lane, which is easy to result in traffic conflict and form potential traffic safety hazard. 1
Usually, we focus on the models of lane change and aim at different conditions such as lane change behavior decisions, safe distance, and lane change time by the method of simulation and experimental data analysis.2–4 And the model to describe the impact of the lane change on traffic flow is rare. Similar research mainly focuses on the interference effects. For example, Jing et al. 5 analyzed the relationship between the number of vehicles and traffic density. LY Wei 6 analyzed the behavior of vehicles affected by the change lane of bus with the method of cellular automata model. S Oh 7 investigated a variety state of traffic flow and found that it will affect the efficiency of the traffic flow and reduce traffic capacity of the downstream. Based on the measured data, HZ Xu 8 established the influence speed model of traffic flow owing to lane change. W Yu 9 analyzed the relationship between lane change and traffic congestion by using the traffic wave model. ML Wang 10 established a lane change model based on fuzzy control theory and quantitatively analyzed the influence of different lane change times on the traffic flow through the simulation comparison. Some research shows that different accelerations, safe distances, and traffic condition of two adjacent lanes will lead to different effects on the target lane during the different condition of lane change. 11 , 12
Less studies can be found toward the analysis of lane change time, especially lack of the micro-changes characteristics of each lane under the influence of multifactor coupling while the existing studies mainly focus on the macro-change characteristics of traffic flow.
The article established a calculation model of lane change time through the theoretical analysis of the characteristics of safe distance. In addition, combining with the instance, we established a model to describe the dynamic variety traffic speed of a single lane influenced by lane change. It has been verified by simulation and reality that the model has some practical significance to research the characteristics of traffic safety and variation of the delay on motorized road in the future.
The model of the dynamic variety traffic speed affected by lane change
In order to study the variety performance of the vehicles affected by lane change, this article tries to use the theoretical method to find some related orderliness through analyzing the behavior of lane change. Because we mainly focus on the influence of target lane caused by lane change, this article neglects the distance of the vehicle back and forward, which plans to change lane. Some rules were made that the order number of the lane which is more close to the center of the road would be named 1, the next one should be 2, and so on. Figure 1 shows the initial position of the vehicles on lanes 2 and 3. In order to analyze the trajectory of vehicle, we establish a coordinate system and define left edge as X-axis and upward as Y-axis. As shown in Figure 1, O is the lane change vehicle on lane 1, C is the vehicle before it, D is the vehicle behind it, A is the front vehicle of the target lane, and B is the rear one of the target lane. WO is the width of vehicle changing lane, WA is the front vehicle’s width on target lane, W1 is the width between the far left of O and the far right of A, W2 is the width between the far left of O and the far left of A, W3 is the width of target lane, LA is the length of A, LO is the length of O, and O1 is the left anterior angle of O.
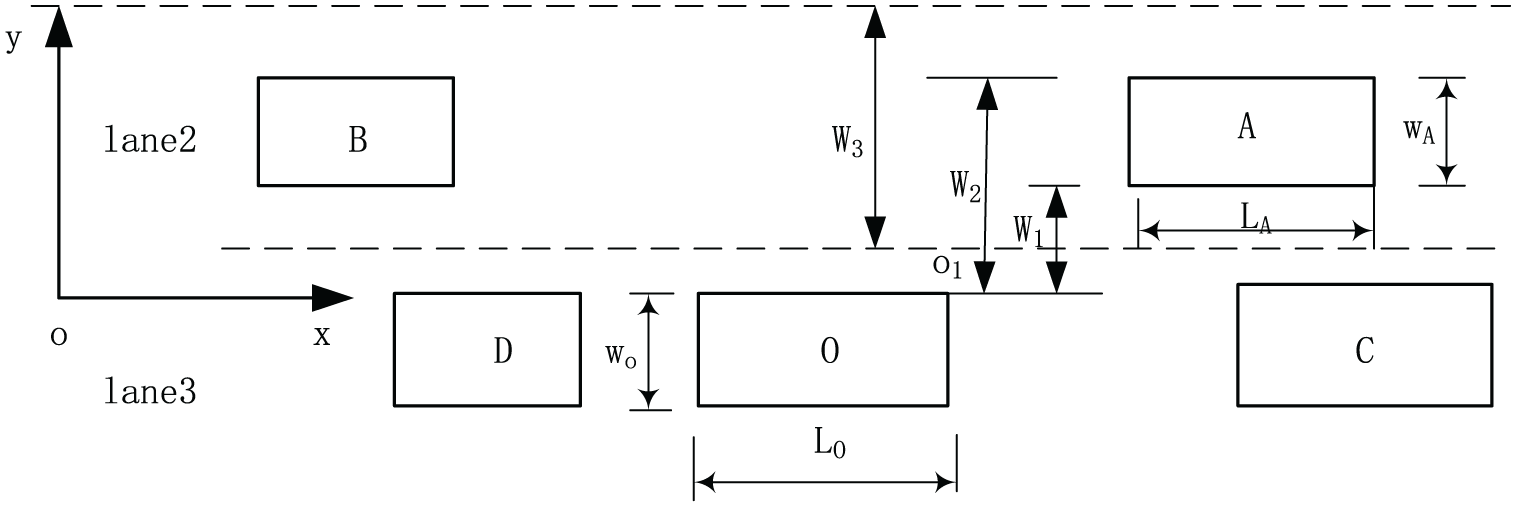
The initial position of the vehicles.
Analysis of the safety distance characteristics between O and A
Trajectory of the vehicles O and A was shown in Figure 2. In order to elaborate the relationship between A and B, the vehicle has finished the process of lane change. Based on the coordinate system, this article assumes that the horizontal and vertical coordinates of the lane change vehicle are

The trajectory of the vehicles O and A.
The horizontal and vertical coordinates of A are
where
and

If

Assuming the horizontal distance between the left front point of O1 and the right rear point of A3 as

where
Therefore, if the collision of the lane change vehicle should be avoided, it must meet with two requirements, which is

and
Analysis of the safety distance characteristics between O and B
Similarly, in order to avoid friction or collision, the vehicle O must keep the minimum safe distance with B after changing lane; the position of each vehicle is shown in Figure 3.

The trajectory of the vehicles O and B.
Assuming the horizontal distance between the left rear point of O2 and the right front point of B2 as

where
Analysis of influence time caused by the lane change vehicle
Related studies have shown that 14 each driver has desirable speed during certain traffic density, which is related to vehicle’s mechanical performance, driver’s characteristics, speed limit rule, and so on. The vehicle will intend to change lane while the influence of slow one ahead leads to lower speed than expected within a certain range. Usually, the vehicle changes lane from lower speed lane to higher speed one, so this article mainly aims to this type and carries on some research.
From the analysis of formula (8), we can know that if we want to compute the safe distance between the lane change vehicle and target vehicle, we need to measure the speed and acceleration of them. But the actual measurement is difficult. In order to find the general rule of lane change, the article assumes that lane change vehicle is driving at a constant acceleration and other vehicles keep constant motion while changing lane.
The time for changing lane between O and A
The changing time is defined that there is a safe distance between O and A after changing. Figure 2 shows the trajectory of the vehicles O and A. We define

where

and A’s driving distance is
So the longitudinal distance between O and A after changing is

If we avoid O not to collide with A, it must satisfy the condition

Figure out in equation (12), then

Because the usual value of
Generally,

The time for changing lane between O and B
The changing time is defined that there is a safe distance between O and B after changing. Figure 3 shows the trajectory of the vehicles O and B. We defined
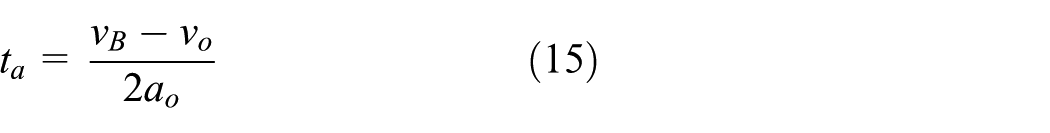
During this time

and B’s driving distance is
So the longitudinal distance between O and B after changing is

If we avoid O not to collide with B, it must satisfy the condition

Figure out in equation (18), then


Generally,

The time influenced by the lane change
From the analysis above, we know that in order to avoid collision between O and A, the time for changing is required to satisfy the formula as follows:
When the vehicle changes from lane 3 to lane 2, if B leaves far enough from O, we can neglect the influence between them and just need to meet the longest changing time of A. If A is far enough from O, we also can neglect the influence between them, and only need to meet the shortest change time of B. If the distance between A and B, and the lane change vehicle O, is moderate, then the influence of them should be considered.
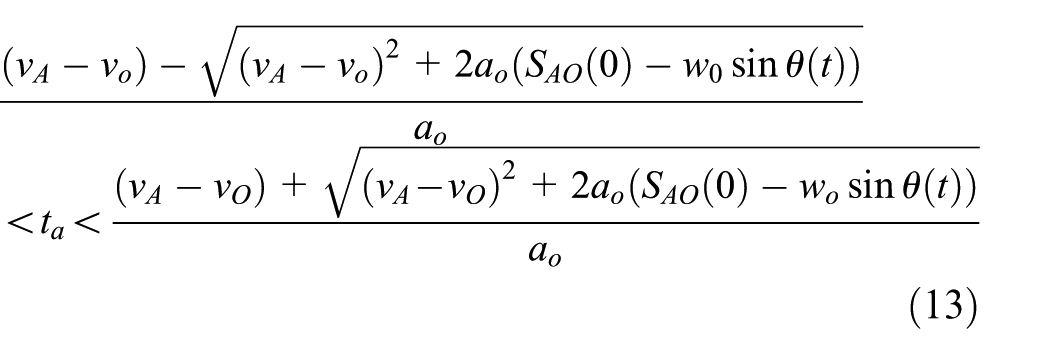
Based on the analysis of the actual data, we find that the vast majority of vehicles consider the front vehicle on the target lane as the object priority. So, this article first studies the situation, which meets the requirement of the vehicle A, where

If we want to meet the requirement of B at the same time, it needs
The limits of
2.
The limit of
(a)
That is, O satisfies the shortest changing time
(b)
At this situation, the vehicle O can meet the safe change requirement with A, but it will impact B. The influential time is

where
(c)
If the vehicle O meets the safe changing requirement with B, it will fail to meet with A. It means O will collide with A; thus, we do not consider this state.
3.
The limit of
(a)
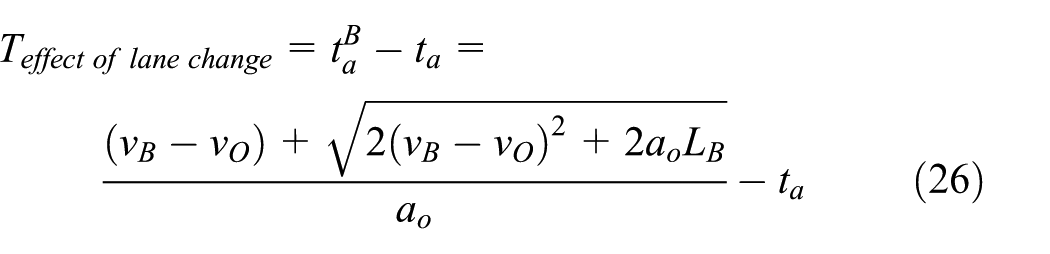
It can meet the requirement of A and B for changing lane at the same time. Vehicle O needs to satisfy the shortest changing time
(b)
If vehicle O wants to change the lane to the point of A successfully while there is clearance between them, the vehicle B must slow down, follow, or stop to wait. Thus, the vehicle changing lane will have an effect on B. The influential time is
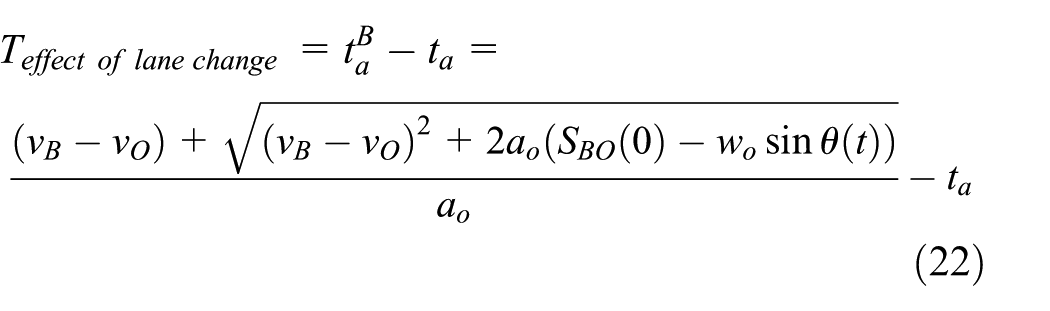
where
(c)
If the vehicle O wants to change the lane to the point of B successfully while there is clearance between them, the vehicle O should fail to meet the safe changing requirement with B. It means O will collide with B; thus, we do not consider this state.
To sum up, the effect of the lane change vehicle O on the vehicles A and B can be expressed as

In the formula,

Relevant research 15 indicates that the minimum safe distance between the lane change vehicle and the vehicle A on the target lane is

Analyzing formula (24), we can know that the value of

Analyzing formula (25), we can know that the value of
where
Application of the model
Introduction
Choose Zhongshan South Road which is an arterial road with two-way six lanes in Nanjing city of China as the research object for data collection and analysis. To facilitate the unified research, this article defines the number rule of the lane. The lane closest to the center line of the main road is 1, then the number is 2 and 3, respectively, as shown in Figure 4. There are four ways to change the lane: lane 1 to lane 2, lane 2 to lane 3, lane 3 to lane 2, and lane 2 to lane 1. From the investigation, we find the type that the vehicle change lane from lane 3 to lane 2 is more frequent, as shown in Figure 5.

Schematic diagram of the number of Zhongshan Road.
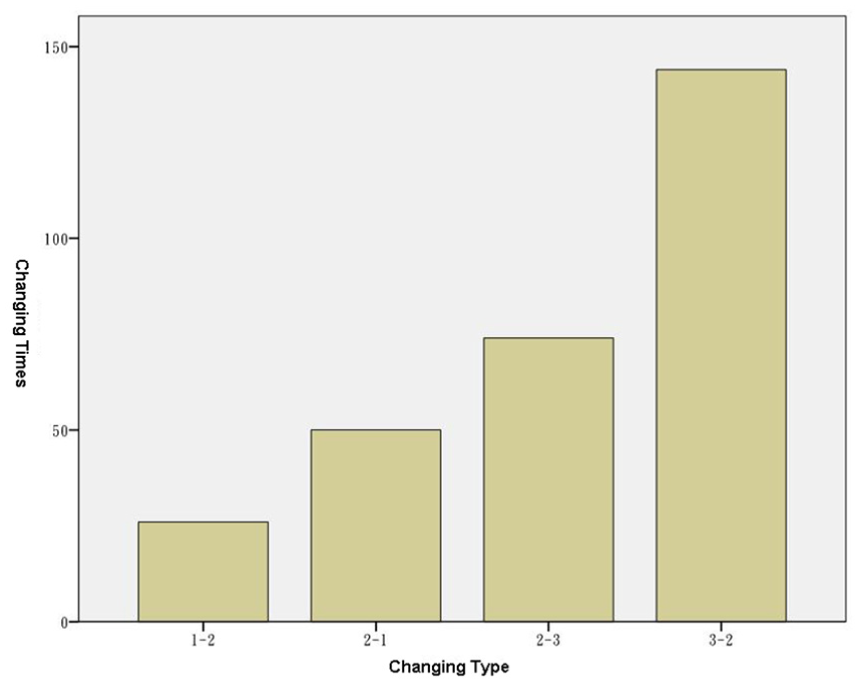
The changing times of each way.
Table 1 shows comparison of lane change time and analysis of four types. It can be seen that the mean value of time while vehicle change from lane 1 to lane 2 is minimum and it is maximum while from lane 3 to lane 2. The maximum time is 3.23 s from lane 1 to lane 2, but 11.00 s from lane 3 to lane 2. It suggests when from lane 1 to lane 2 changing lane is freedom so spend relatively short time. However, from lane 3 to lane 2, because of lane change condition does not include all, vehicles will implement forced changing so that it needs a long time. Thus, this article mainly studies the model that the vehicle changing lane impacts lane 2 traffic flow.
Comparison and analysis of time eigenvalues for four types of lane change.

The model to describe the variety speed in the city of China
This article takes 1 min as observation time interval and takes each lane as the research object, and set up velocity–volume model through data analysis and arrangement:
Related studies have shown that,
16
vehicle’s speed after affected is closely related to the social vehicles’ initial velocity, impact time and the distance between the location of the parking vehicles began to slow and entrance. And it can be described as
Because this article assumes that the vehicle changes from low speed way to high speed way, and that there is no reduction behavior after finishing changing, the S value is 0. When the vehicle changes from lane 3 to lane 2, the model that lane change vehicle impact vehicles on target lane 2 can be described as

Sensitivity analysis of the model
Select Zhongshan South Road in Nanjing city in China as an example. We take further sensitivity analysis on the influence of vehicles’ various speed by using established influence model. Then, we analyze the mechanism of influence further while the vehicle changes lane.
Suppose traffic volume of lane 2 is from 100 to 400 pcu/h and lane 3 is 500 pcu/h, the vehicle tries to change from lane 3 to lane 2. Figure 6 compared velocity on lane 2 before and after. It can be seen that lane change caused vehicles slow down; meanwhile, if the volume of lane 2 increases, then amplitude of speed change will be reduced. It is accordance with the actual situation and proves that model is accurate.
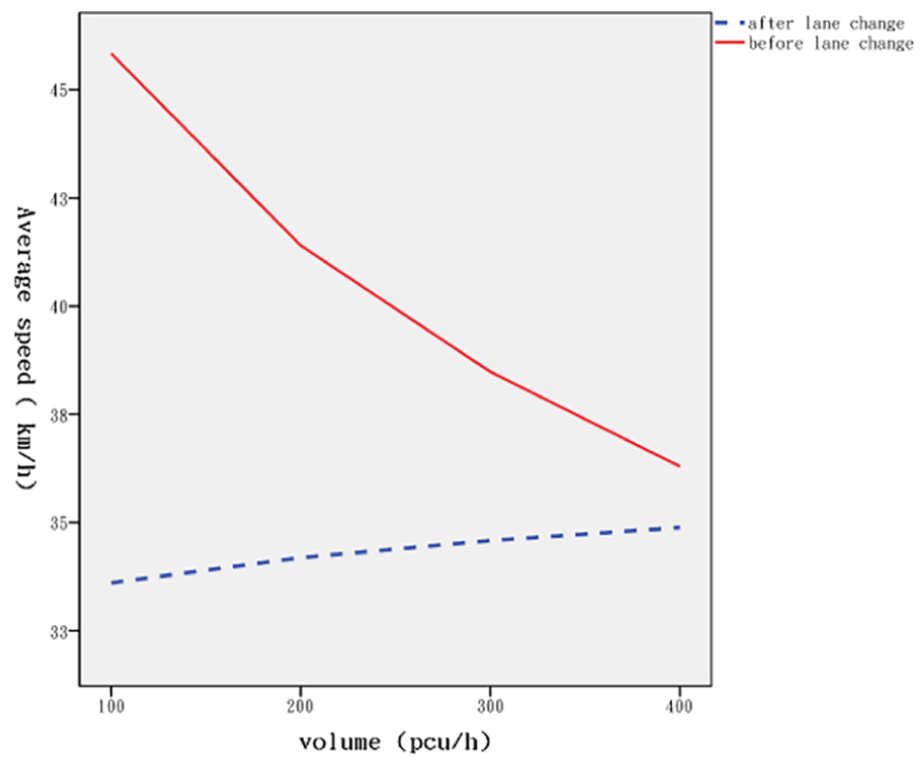
Comparison of velocity in lane 2 before and after the change.
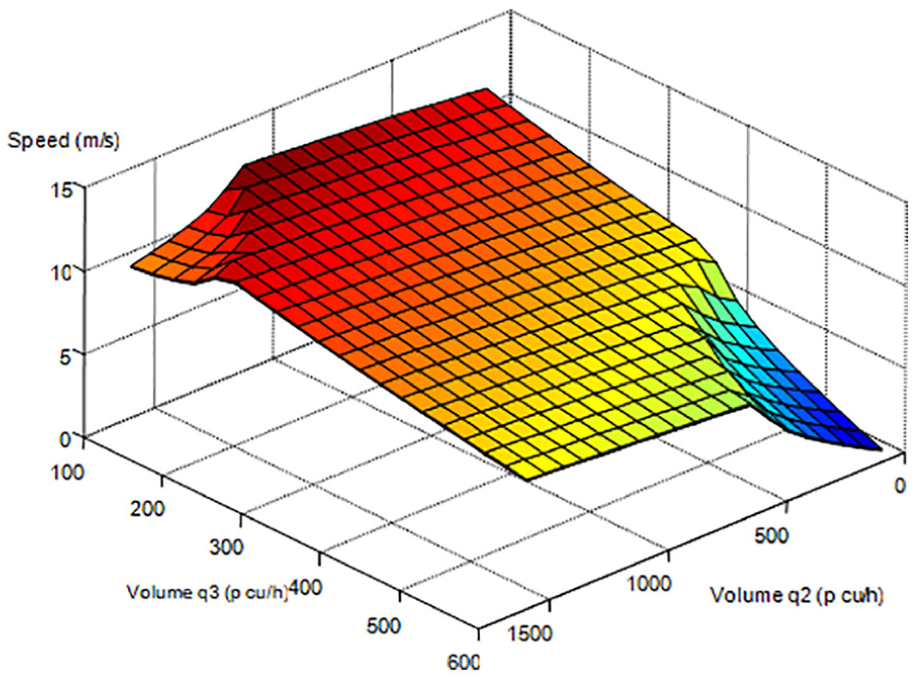
Figures 7–12 show the speed of vehicles on lane 2 affected by change from lane 3 to lane 2. The acceleration in the diagram is 0.01 to 4.0 m/s2. So, some conclusions can be drawn as follows:
When traffic volume of changing lane is 500 and 600 pcu/h and target lane is 0 and 500 pcu/h, or when the former’s traffic volume is 100 and 200 pcu/h and the latter’s is 1000 and 1500 pcu/h, the lane change with different acceleration had a greater influence on the velocity of vehicles on target lane.
The smaller the acceleration, the greater the change of speed. On the contrary, the larger the acceleration, the smaller the change of speed.
Change in velocity (0.1 m/s2).

Change in velocity (0.5 m/s2).

Change in velocity (1.0 m/s2).

Change in velocity (2.0 m/s2).

Change in velocity (3.0 m/s2).

Change in velocity (4.0 m/s2).
Conclusion
The speed of the target lane affected by the lane change is closely related to the volume of the adjacent two lanes, and the acceleration of lane change vehicle and the influential time can be calculated as follows:
Footnotes
Handling Editor: Seung-Bok Choi
Declaration of conflicting interests
The author(s) declared no potential conflicts of interest with respect to the research, authorship, and/or publication of this article.
Funding
The author(s) disclosed receipt of the following financial support for the research, authorship, and/or publication of this article: This research is supported by the National Natural Science Foundation of China (51408322) and the State Key Program of National Natural Science Foundation of China (51638004).