
Abstract
Lane change has attracted more and more attention in recent years for its negative impact on traffic safety and efficiency. However, few researches addressed the multi-vehicle cooperation during lane change process. In this article, feasibility criteria of lane change are designed, which considers the acceptable acceleration/deceleration of neighboring vehicles; meanwhile, a cooperative lane change strategy based on model predictive control is proposed in order to attenuate the adverse impacts of lane change on traffic flow. The proposed strategy implements the centralized decision making and active cooperation among the subject vehicle performing lane change in the subject lane and the preceding vehicle and the following vehicle in the target lane during lane change. Using model predictive control, safety, comfort, and traffic efficiency are integrated as the objectives, and lane change process is optimized. Numerical simulation results of the cooperative lane change strategy suggest that the deceleration of following vehicle can be weakened and further the shock wave propagated in traffic flow can be alleviated to some degree compared with traditional lane change.
Keywords
Introduction
Lane change, as one of the basic driver behaviors, can never be avoided in real traffic environment. For example, a mandatory lane change should be executed if there is a lane drop or an accident ahead in the current lane. It has been investigated and confirmed that lane change has negative effects on traffic safety and efficiency. 1 In the United States, accidents caused by lane change maneuver represent between 4% and 10% of the totality of the accidents. 2 Specially, 78% of lane change accidents take place in a dense traffic flow with low speed and small inter-vehicle space, such as in urban area. 3 Even multiple-vehicle collision can be induced by improper lane change. Recognition failure by driver is a primary reason for 75% of lane change accidents. 4 On the other hand, lane change is a primary trigger of oscillations in traffic flow, which causes 10% of latencies on roads. 1 Subtle localized oscillations caused by lane change can be generated and transformed into substantial disturbances which may decelerate upstream vehicles or even cause a traffic jam which can be classified as “phantom traffic jam.” 5 Furthermore, driver’s recognition and operation limit and independent decision making may aggravate the negative impacts of lane change.
Because of lane change’s adverse impacts on traffic safety and efficiency and its linkage to macroscopic traffic flow characteristic, there have been many researches on modeling lane change to analyze the mechanism of lane change and its impacts on traffic flow. Generally, lane change model can be divided into lane change decision (LCD) model and lane change impact (LCI) model. 6 Typically, the first LCD model is Gipps’ 7 model in which a driver decides whether or not to change lane by considering the risk of collision, the locations of neighboring vehicles, the presence of special purpose lanes, the possibility of gaining a speed advantage, and so on. Many efforts were also made to extend or to improve Gipps’ model. For example, lane change probability was introduced to make Gipps’ model more realistic. 8 In the study by Wang et al., 9 driver’s propensity was considered to design LCD model based on analytic hierarchy process method. However, in a large proportion of LCD model, the reactions of neighboring vehicles are ignored in lane change scenario. In fact, lane change is a complicated process during which there are interactions between the subject vehicle (SV) performing lane change and its neighboring vehicles. Kesting et al. 10 proposed MOBIL (“minimizing overall braking induced by lane changes”) model with the consideration of the benefit of a potential lane change by measuring the acceleration variations of the following vehicle (FV) and the SV. The interactions between the SV and the FV in the target lane have been modeled by Hidas. 11 In this LCD model, it is introduced that the FV in the target lane can slow down reluctantly or willingly to provide space for the SV to insert with the assumption that driver will accept a certain maximum speed decrease. However, in the above studies, lane change process of the SV is considered as an instant lateral movement into the adjacent lane for simplicity. LCI model is set up to represent lane change’s impact on surrounding vehicles. In the study by Nagatani and Yonekura, 12 based on the initial velocity, the initial density, the incoming velocity, the incoming headway, the sensitivity, and the relative velocity, the criterion and region map were derived for the number of multiple-vehicle collision caused by lane change. A simple kinematic wave model was proposed by Jin 13 to study bottleneck effects caused by lane change. Li et al. 14 proposed a two-lane cellular automata traffic model to investigate the impact of aggressive lane-changing behavior of fast vehicles and different lane-changing probability. In most of these studies on LCI model, lane change behavior is also assumed as an instantaneous action. However, in real traffic environment, lane change is a continuing process which affects FVs significantly and should be considered when studying lane change’s impacts on traffic flow.
Besides, improper lane changes are often executed due to driver’s recognition failure or aggressive characteristics, which may force the FV in the target lane to decelerate sharply or even lead to accidents, and the movement of lane change is also much more complex than that of car following. Therefore, advanced driver assistance systems (ADAS) and automated control for lane change are studied and implemented to improve lane change process and decrease improper lane changes by assisting or replacing driver. ADAS for lane change can evaluate the risk of lane change and alert driver to avoid dangerous lane change. 15 Many vehicle manufacturers have developed ADAS for lane change which are referred to as lane change decision aid systems (LCDAS). 16 For example, in 2005, Volvo took the lead in equipping blind spot detection (BSD) system on its premium car. 17 In the study by Hatipoglu et al., 18 the smooth lane change control was implemented by generating a virtual yaw reference and utilizing a robust switching controller to track that reference. A lane change steering maneuver was proposed based on model predictive control (MPC) method to avoid collision with the preceding vehicle (PV) in the initial lane. The potential advantage of collision avoidance by lane change was also estimated by comparing with longitudinal braking. 19 It implies that the automated lane change control can be implemented to make vehicle move accurately as the desired control inputs. However, in some researches on lane change control, the existence or movement variation of neighboring vehicles may not be considered. Actually, most of the existing ADAS for lane change and lane change control system just act on the SV, and neighboring vehicles involved in lane change scenario are influenced passively and make decisions independently. Besides, there are few systems developed with the target to reduce the lane change’s negative impacts on traffic flow upstream. Therefore, the improvement of lane change process is limited, and the FV in the target lane may not decelerate to provide space for the SV, which may cause terrible consequence for a mandatory lane change. In addition, in these systems, the information of neighboring vehicles is obtained depending on traditional onboard sensors (radar, camera, etc.), which have limitations on information acquisition, such as relatively low accuracy, less information types, and limited operating conditions. 20
Nowadays, vehicle-to-vehicle (V2V) communication technology has been developed quickly by which more real-time, accurate, and abundant information can be obtained. Because multiple vehicles’ total information can be shared via V2V communication, multi-vehicle cooperative control has a new attractive research hotspot in recent years to further improve traffic safety and efficiency. 21 The cooperative vehicle platoon control based on V2V communication has been extensively studied and implemented, and cooperative adaptive cruise control (CACC) is a representative research.22,23 However, there are still limited literatures introducing V2V communication into lane change scenario. In Naranjo et al., 24 a fuzzy lane change control for overtaking maneuver was implemented based on the information supplied by high-precision global positioning system and V2V communication. You et al. 25 developed a trajectory planning generator and tracking controller for lane change to avoid collision with vehicles in target lane based on V2V communication to obtain information of neighboring vehicles. In most of the current relevant researches, V2V communication is applied just as a means to obtain information, and vehicles still make decisions independently and the interactions between vehicles are passive.
Actually, with V2V communication, active multi-vehicle cooperation can be implemented in lane change scenario. In this article, SV, PV, and FV are considered as active agents which can cooperate to accomplish lane change. A cooperative lane change (CLC) strategy is proposed by employing centralized decision making and active cooperation. The objectives of this article are as follows: (1) to increase lane change feasibility compared to traditional lane change (TLC) scenario within the same lane change duration; (2) to optimize the movement of each vehicle and ensure security and driver comfort during CLC, especially to decrease FV’s deceleration; (3) to reduce the influence of lane change on upstream vehicles and improve traffic flow to some degree.
The remainder of this article is organized as follows: section “Description of the studied scenario and system architecture” introduces the studied scenario and the specified system architecture for CLC strategy as well as the procedure of the system; section “Methodology” details the lane change feasibility criteria and the design of the CLC strategy; section “Numerical simulation” presents the numerical simulation for validating the advantages of the proposed strategy; and section “Discussion and conclusion” gives some discussions and conclusions drawn from this work.
Description of the studied scenario and system architecture
Studied scenario
The studied scenario is shown in Figure 1. All vehicles are homogeneous and indexed for convenience. The SV in the subject lane intends to cut into the target lane between the PV and the FV. SV, PV, and FV are the active vehicles which cooperate with each other according to the proposed strategy during the whole process of lane change and revert to human-driven vehicles after lane change. There are n human-driven vehicles behind FV. For simplicity, it is assumed that the car-following behavior of each human-driven vehicle is uniform and not influenced by its FV. Therefore, just one passive vehicle, that is, Veh n + 4, is set in front of PV to represent the state of traffic flow downstream. An assumption is also made that Veh n + 4 will run with a constant velocity. If it is feasible for SV to change lane according to the lane change feasibility criteria which will be detailed in the following part of this article, the current moment is denoted as the initial time

The studied lane change scenario.
Each vehicle is running in the middle of its lane. The longitudinal position of each vehicle is represented by the longitudinal position of rear bumper. The lateral position of SV is represented by the lateral position of its centroid. At
System architecture
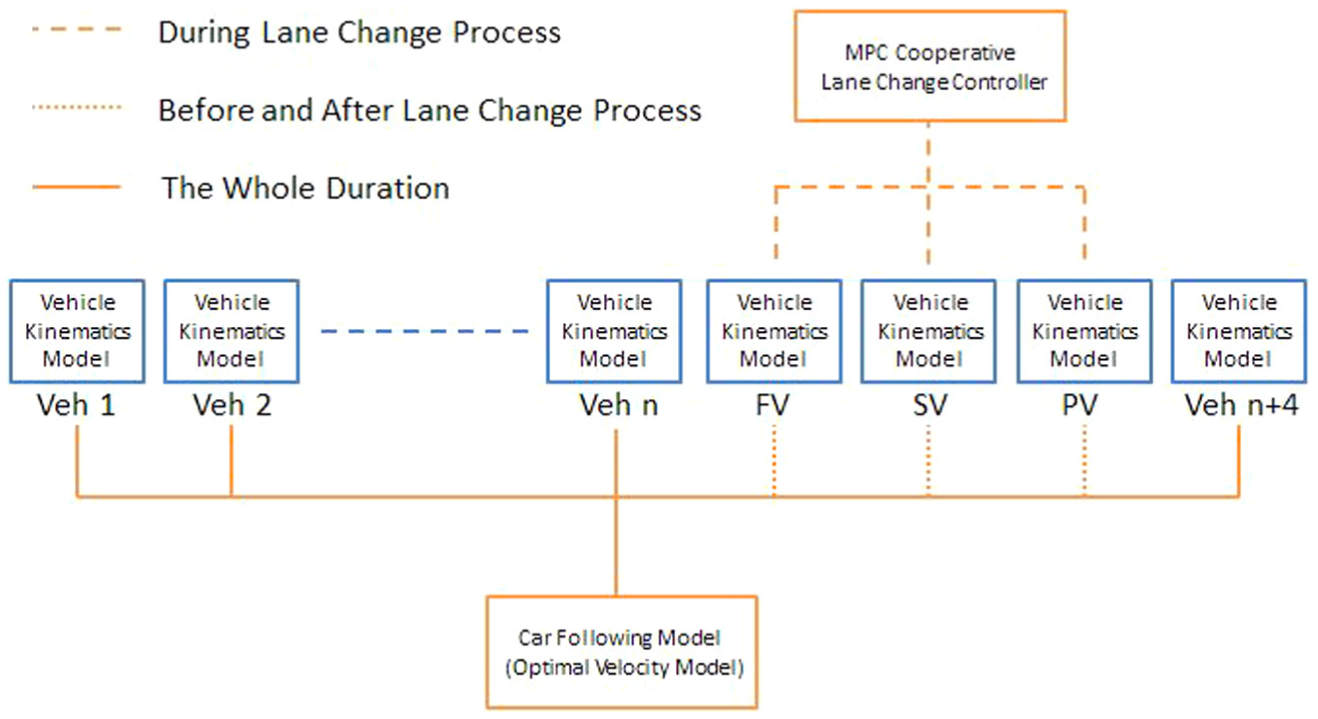
To implement the proposed CLC strategy in the upper-level decision unit, SV, PV, and FV should be equipped with the perception unit, V2V communication unit, and lower-level control unit. The system architecture for the proposed strategy and the procedure to implement cooperation are illustrated in Figure 2.

System architecture and procedure to implement cooperation.
The perception unit of each vehicle contains various sensors to obtain abundant information of host vehicle and its PV/FV: the space gap and relative velocity between host vehicle and its PV/FV can be measured accurately with front/rear radar; the position, velocity, and heading angle of the host vehicle can be obtained by differential global positioning system (DGPS) whose positioning accuracy is 2 cm; the comprehensive information of vehicle status can be achieved from controller area network (CAN) bus; kinds of onboard inertial sensors can measure various motion parameters including longitudinal acceleration, lateral acceleration, and yaw rate; and the wheel steering angle and position of accelerator/brake pedal can be measured by angle and position sensors. Accurate and total information mentioned above can be collected in real time. In communication unit, information of vehicle and desired control inputs can be sent and received through dedicated short-range communication (DSRC) device. The frequency of communication is high enough, so the delay of V2V communication is ignored for simplicity in this article. The focus of this article is to design the multi-vehicle cooperation strategy for lane change scenario in upper decision level where the desired control inputs (i.e. desired longitudinal acceleration) of the three vehicles can be determined. Therefore, it is assumed that the lower-level control unit in each vehicle can implement accurate longitudinal and lateral vehicle control according to desired control inputs, and the implementation of lower-level control will not be referred to in detail in this article.
During CLC, SV is regarded as the decision-making center. As shown in Figure 2, the procedure of the cooperation can be divided into following steps:
Step 1. SV receives the useful information of PV and FV via V2V communication along with the information of itself. The information is listed in Table 1.
Information list for the proposed strategy.

SV: subject vehicle; PV: preceding vehicle; FV: following vehicle.
In Table 1,
Step 2. Judge the feasibility of CLC based on the information obtained in Step 1. If CLC is feasible, go on to the next step. Otherwise, directly execute Step 8 to stop cooperation and inform drivers that CLC is infeasible.
Step 3. The three vehicles begin to cooperate since this step. SV collects same information as Step 1.
Step 4. Determine the desired control inputs of the three vehicles, that is, desired longitudinal acceleration, through the proposed strategy at current control period. This step is the key of the whole procedure. The cooperation strategy is also the main content of this article.
Step 5. The desired control inputs of PV and FV are broadcasted via V2V communication. PV and FV obtain the corresponding desired inputs from the communication unit.
Step 6. Lower-lever control unit of each vehicle begins to control vehicle automatically according to the corresponding desired control input at current control period.
Step 7. Judge whether the cooperation time is up. If not, the procedure continues circularly from Step 3 to Step 7, otherwise the procedure begins to execute Step 8.
Step 8. The cooperation among the three vehicles is over. The system stops controlling vehicles and informs drivers to operate vehicles again.
Methodology
Lane change process and vehicle kinematics model
In this article, the process of CLC is divided into two segments. We define the first segment as lane change (LC) segment and the second segment as longitudinal adjustment (LA) segment which begins at the end of LC segment. During LC segment, SV is in the process of lane change during which the longitudinal and lateral movement exists simultaneously. At the same time, PV and FV as active vehicles adjust their longitudinal motions on the basis of the proposed strategy. In the proposed strategy, it is defined that during LC segment of SV, the longitudinal acceleration varies as the desired control input and the lateral acceleration varies as a sine function as follows 26
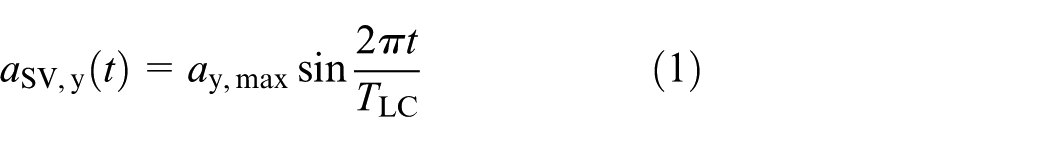
where

The LC segment of SV is shown in Figure 3. In the LC segment, the lateral displacement of SV equals the lane width. The standard lane of which the width is 3.75 m is applied in this article. The time

LC segment of SV.
After the LC segment, the system will adjust the longitudinal velocity of the three vehicles to get preparation for giving back the control authority to drivers, and this process is the LA segment. The duration of LA segment is represented as
In this article, a concise model considering inertial delay for vehicle longitudinal dynamics is employed for the proposed strategy in the upper-level decision unit. To derive the proper model, some reasonable assumptions are applied as follows:27–29
Ignore the influence of pitch and yaw motion.
The tire longitudinal slip is tiny enough to neglect, and the powertrain dynamics can be integrated in a first-order inertial transfer function.
The vehicle body is treated as a rigid and symmetric solid.
The driving and braking torques can be controlled as input parameters.
Based on the above assumptions, a simplified vehicle model is deduced, but still nonlinear, as follows

where i represents SV, PV, or FV;
To linearize the simplified nonlinear model, input–output (I/O) linearization method is used to develop the feedback structure.30–32 The inertia delay in vehicle dynamics system is also considered to make the applied vehicle model close to reality. It is assumed the inertia delay of each vehicle is same. Consequently, the feedback linearization law with inertia delay is

where

From equations (3)–(5), a linear vehicle kinematics model is obtained as follows

The vehicle kinematics model can be written in the form of state space

where
Lane change feasibility criteria
It is necessary for SV to estimate the lane change feasibility, the method of which is presented in this section.
First, safety and driver comfort are considered in lane change feasibility criteria. The safe distance constraint is given as follows

where
In our previous research,
33
we analyzed amounts of data which are obtained when 33 drivers with different ages, sexes, and driving characteristics approach their PVs. When driver feels the danger of rear-end collision, the braking pedal will be operated. Through data statistics, the mean time headway at that moment is about 1 s. Therefore, the value of
FV may decelerate for SV’s cut in if the deceleration can be tolerated by the driver in FV; otherwise, FV may not decelerate to provide space for SV’s lane change. The maximum acceptable deceleration

where

To determine the feasibility of lane change, SV, PV, and FV are assumed to move with desired constant maximum longitudinal acceleration. Thus, the acceleration, velocity, and displacement of each vehicle can be derived from equation (6) as follows

Typically, the desired acceleration of FV is

To ensure the security of CLC, it is claimed that CLC is feasible if the safe distance constraints of SV and FV are satisfied at two specific moments, that is,
The acceleration
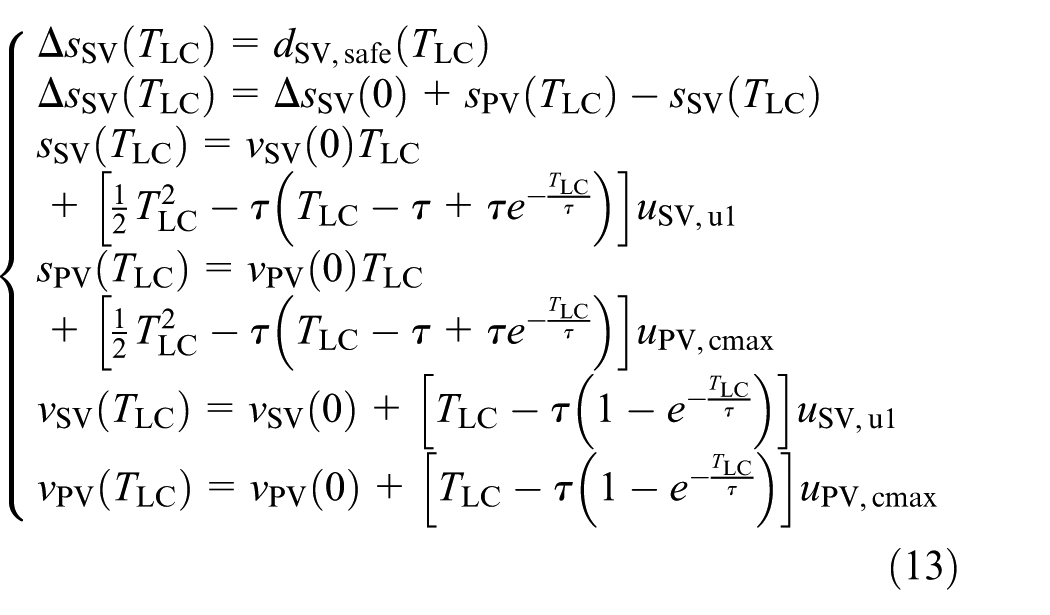
The acceleration
The upper limit of SV’s acceleration constraint,
The lower limit of the range,
The acceleration
The acceleration
The upper limit of SV’s acceleration constraint,
Note that the method to calculate
If
MPC-based CLC strategy
State space model for CLC strategy
For centralized decision making among SV, PV, and FV is employed the proposed strategy; the state vector can be denoted as

where
Objective function and constraints
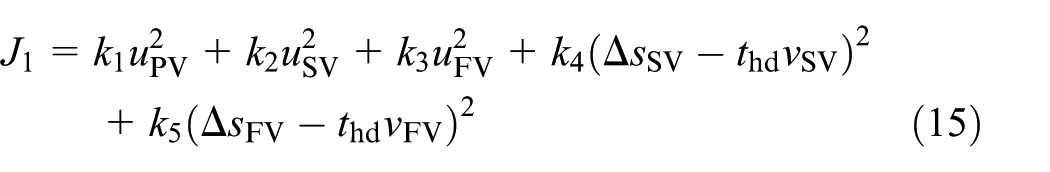
Two objective functions are designed to optimize processes of LC segment and LA segment. The objective function of LC segment is defined as follows
where

Several objectives are taken into account to design the objective function of LC segment:
During LC segment, PV can move with proper acceleration for cooperation, the absolute value of SV’s acceleration also needs to be optimized because of the motion complexity of lane change maneuver, and the deceleration of FV needs to be minimized to avoid a sharp braking, and, which corresponds to the first three items.
It is hoped that SV and FV can follow its PV with desired distance headway. Therefore, the distance headway error of each vehicle, which is defined as the difference between desired distance headway and actual distance headway, also needs to be reduced.
Some constraints for LC segment should be regulated in consideration of comfort and safety. The acceleration constraints of the three vehicles are given as follows

where the acceleration constraints of PV and SV are the same as those in CLC feasibility criteria seen in equations (9) and (10) to ensure driver comfort of PV and SV;
To implement safe lane change, the distance headway of each vehicle should be above the corresponding critical safe distance headway since SV enters the target lane, that is

For LA segment, another objective function is designed as follows

where
When we design the objective function for LA segment, several factors are considered as follows:
To implement smooth transition from LC segment to LA segment, the variable
The control input of each vehicle is hoped to approach driver’s desired acceleration and reduce the acceleration change when the cooperation ends, which corresponds to the second item in equation (19).
During LA segment, the acceleration constraint of each vehicle is given as follows

And the three vehicles should satisfy safe distance constraints shown in equation (18).
MPC formulation
First, the state space model in equation (14) should be discretized into a discrete time model for MPC design. It is assumed that T represents the sampling time for system discretization. Define

where
According to the objective function and the constraints for LC segment and LA segment defined above, the model predictive optimization problem for LC segment can be expressed as

subject to
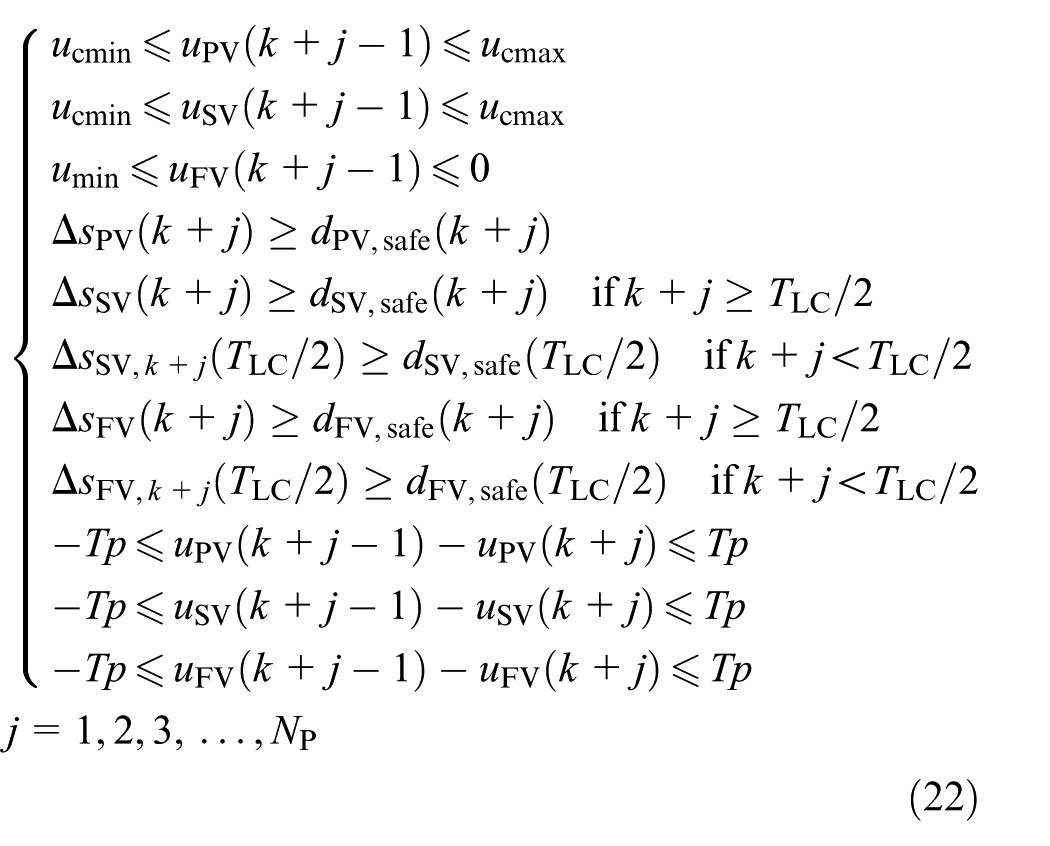
where
Similarly, the model predictive optimization problem for LA segment can be expressed as

subject to

where the form of

Here, we use the MATLAB function fmincon to solve the constrained nonlinear optimization problems shown in equations (22)–(24) in receding horizon. By solving the model predictive optimization problem above in corresponding segment, the desired control inputs of the three vehicles in each control period are obtained and the active cooperation can be implemented according to the desired control inputs.
Numerical simulation
Numerical simulation of the proposed CLC strategy has been conducted by employing the scenario illustrated in Figure 1. The purpose of the simulation is to evaluate the following aspects: (1) the increase of feasible lane change opportunities, (2) the improvement in the driving behavior of FV during lane change by comparing with the defined TLC, and (3) the attenuation of the adverse impact of lane change on upstream vehicles by comparing with the defined TLC.
Simulation scheme
Car-following model
In this article, the optimal velocity model (OVM) is chosen as the car-following model, because it can not only simply represent human driving behavior but also describe many characteristics of real traffic flow. 37 The OVM is as follows

where n is the index of the vehicle,

where
Simulation platform
We use MATLAB as the simulation platform, in which the vehicle kinematics model (in section “Lane change process and vehicle kinematics model”), the MPC CLC controller (in section “MPC-based CLC strategy”), and the car-following model (in section “Car-following model”) are implemented. The simulation platform is shown in Figure 4, in which the vehicles are controlled either by the MPC CLC controller or by the car-following model in different time segments.
Simulation platform.
Defined traditional lane change
To validate advantages of the proposed strategy, we define TLC as a comparison. The feasibility criteria of TLC are similar to those of CLC, and the only difference is that PV will move with a constant velocity. If TLC is feasible, an acceleration range can also be achieved. It is assumed that SV moves with a constant maximum longitudinal acceleration satisfying acceleration and safety constraint during TLC, that is, the upper limit of the achieved acceleration range, and moves according to OVM after TLC. For there is no cooperation among SV, PV, and FV, PV and FV are assumed to move according to OVM all the time. Considering driver’s reaction time and decision-making time, it is assumed that SV begins to generate influence on FV at the critical moment
Simulation setup
In the simulation scenario, there is only one vehicle running in front of PV which will keep a constant velocity during the simulation, and there are totally N = 50 vehicles after FV reflecting the behavior of upstream traffic flow. So the total number of vehicles is N + 4 = 54. Because at the initial time traffic flow in the target lane is in equilibrium, the initial states of simulation scenario can be determined with following scenario parameters listed in Table 2.
List of scenario parameters.

SV: subject vehicle; PV: preceding vehicle; FV: following vehicle.

To validate the increase of feasible lane change opportunities and advantages of the proposed strategy, we generate 9009 initial states by combining different
In the simulation, TLC is fixed as 5 s which corresponds to the average value according to the statistics;
39
the length of each vehicle
List of controller parameters.

In Table 3, some parameters are chosen according to relevant literature, while the others are chosen intuitively because there is not a universal standard to judge the optimality of the chosen parameters. Especially, for the weight coefficients ki (i = 1–8), we choose proper weight coefficients to make different items have the same order of magnitude, thus balancing the different items in the performance index and making the performance index meaningful.
Among all initial states, the feasibility of TLC and CLC is determined first and then all feasible TLCs and CLCs are simulated.
Simulation results
In all initial states of the simulation scenario, the feasibility of CLC and TLC is estimated, and the result is shown in Table 4.
Quantity of feasible CLC and TLC.

CLC: cooperative lane change; TLC: traditional lane change.
Because the initial states of simulation scenario represent the traffic flow in urban area where traffic dense is high, lane change cannot be performed in most of initial states. However, there are still 2109 feasible CLCs, and the lane change opportunities increase by 42.8% compared with TLC. Typically, if TLC is feasible, CLC must also be feasible for PV’s acceleration. It implies that with the same lane change duration, the proposed CLC can be implemented in more scenarios, which is significant to mandatory lane change for lane drop or accident ahead.
An initial state in which CLC and TLC are both feasible is chosen to represent the advantages of CLC by comparing with TLC. The values of scenario parameters are shown in Table 5.
Values of scenario parameters.

To evaluate the influence of CLC on SV, PV, and FV compared with TLC, distance headway and velocity curves are presented in Figures 5 and 6.

Distance headway curves of SV, PV, and FV: (a) CLC and (b) TLC.

Velocity curves of SV, PV, and FV: (a) CLC and (b) TLC.
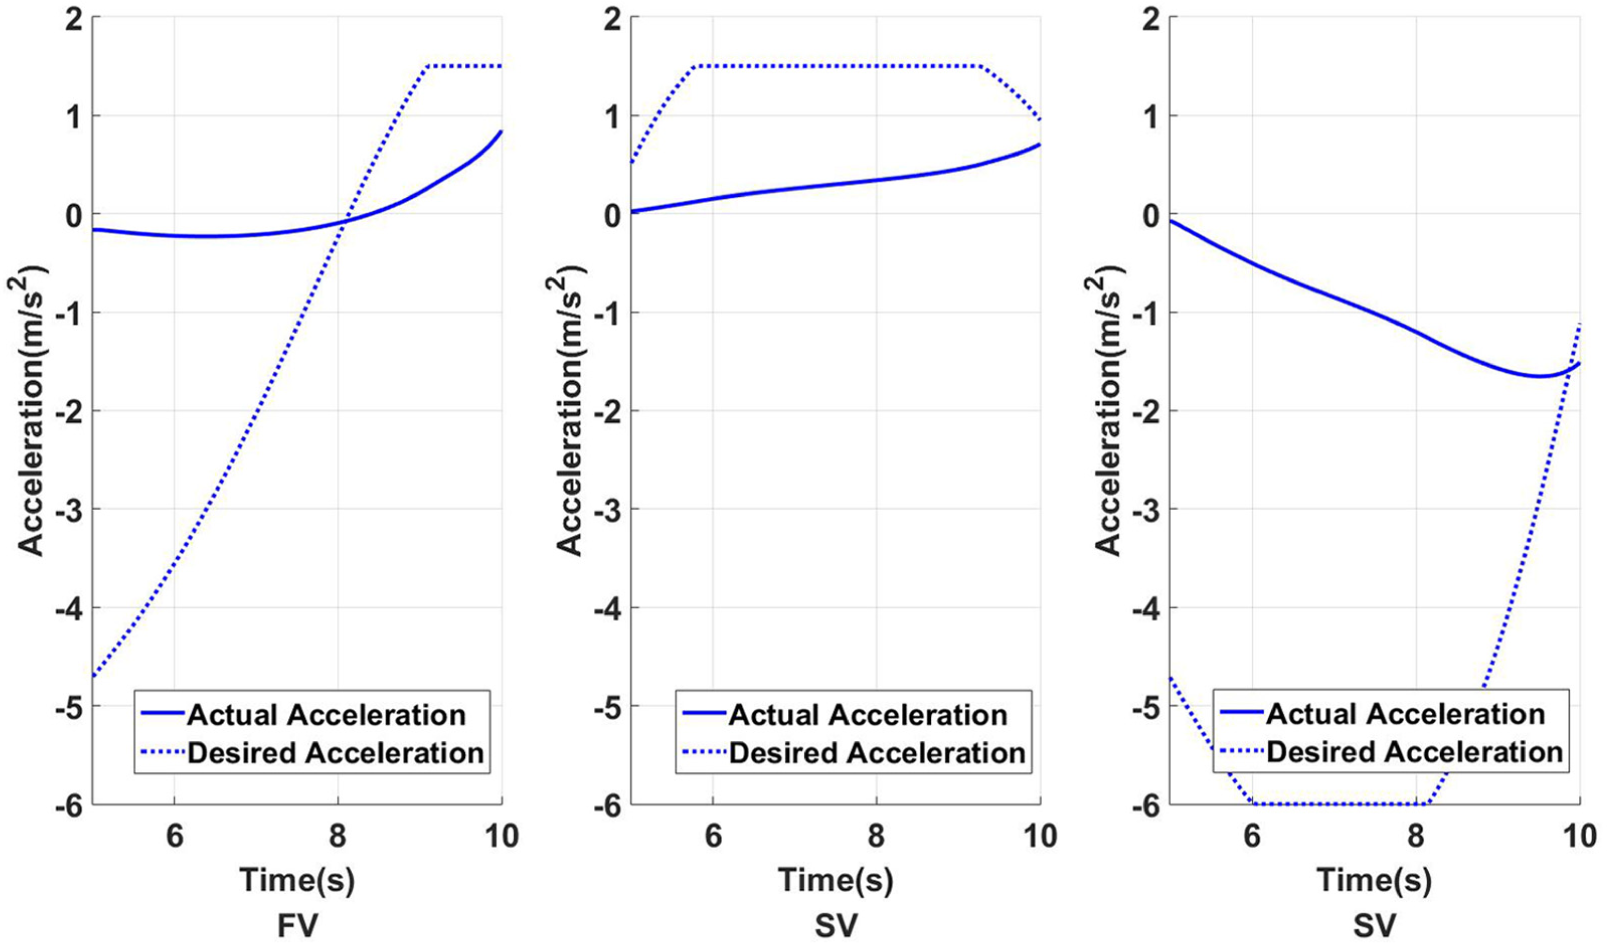
In Figure 5, one can observe that in CLC scenario, FV’s distance headway increases smoothly approaching the desired distance headway. Whereas in TLC scenario, FV’s distance headway decreases at the time t = TLC/2 when SV enters into FV’s lane and FV regards SV as its PV and then increases drastically, thus causing large overshoot with respect to the desired distance headway. The sudden change of headway in TLC consequently causes FV’s sharply braking, as corresponds to the deceleration in Figure 6. In Figure 6, it can also be seen that the velocity variation of FV during the LC segment of CLC is not as drastic as that during TLC, and the deceleration of FV is reduced obviously implying that driving comfort is improved. The velocity variations of SV and PV are also acceptable and driving comfort of SV and PV can be ensured which can be seen from acceleration curves of three vehicles during LC segment of CLC shown in Figure 7.

Acceleration curves of SV, PV, and FV during LC segment of CLC.
The actual acceleration curves and the drivers’ desired acceleration curves during the LA segment are presented in Figure 8.
Acceleration curves of SV, PV, and FV during LA segment of CLC.
In Figure 8, it can be seen that the proposed strategy can make acceleration of each vehicle approach driver’s desired acceleration derived from OVM. And the sudden acceleration changes of FV, SV, and PV at the end of LA segment are only 0.66, 0.25, and 0.40 m/s2, which implies that the control authority transfer from the proposed system to driver is smooth to some degree and brings little discomfort to driver. During the LA segment, the acceleration variation of each vehicle is also soft which can ensure driver comfort.
To evaluate the influence of CLC on vehicles upstream, the space–time diagram from Veh 1 to Veh 52 is presented in Figure 9.

Space–time diagram for (a) CLC and (b) TLC.
In Figure 9, one can observe that the traffic jam caused by CLC is not as serious as that caused by TLC, the shock wave in CLC is alleviated to some degree compared with TLC and fewer vehicles upstream are forced to stop by CLC. This implies that the adverse impact of lane change on upstream vehicles is attenuated. In addition, some selected vehicles plotted in red curves in Figure 9 are also depicted in Figure 10 for better comparison.

Velocity curves of selected following vehicles (CLC: solid curves, TLC: dotted curves).
As shown in Figure 10, the amplitude of velocity variation of Veh 50 and Veh 40 in CLC is lower than that in TLC. As for Veh 20 and Veh 30, the velocity decreases to zero both in CLC and TLC, but velocity of each vehicle begins to decrease later and increase earlier in CLC than that in TLC (the moment when Veh 1 and Veh 10’s velocity increase from zero is out of simulation time). In CLC, the time during which vehicles upstream keep stopping is 12.5 s shorter than that in TLC in average. It demonstrates that although traffic jam is generated upstream, the waiting time of each vehicle decreases obviously.
In addition, behind SV there are 18 vehicles running without stop for the sake of CLC, while the number is only 6 in the TLC simulation. Among the first 18 non-stop vehicles, the average velocity reduction is 13.68 km/h and the average maximum deceleration is −1.12 m/s2 in CLC comparing with 38.07 km/h and −4.55 m/s2 in TLC (see Table 6). The average braking intensity is reduced by 75.4%, and the average velocity variation is reduced by 54.51%.
Maximum velocity variation and maximum deceleration of non-stop vehicles.
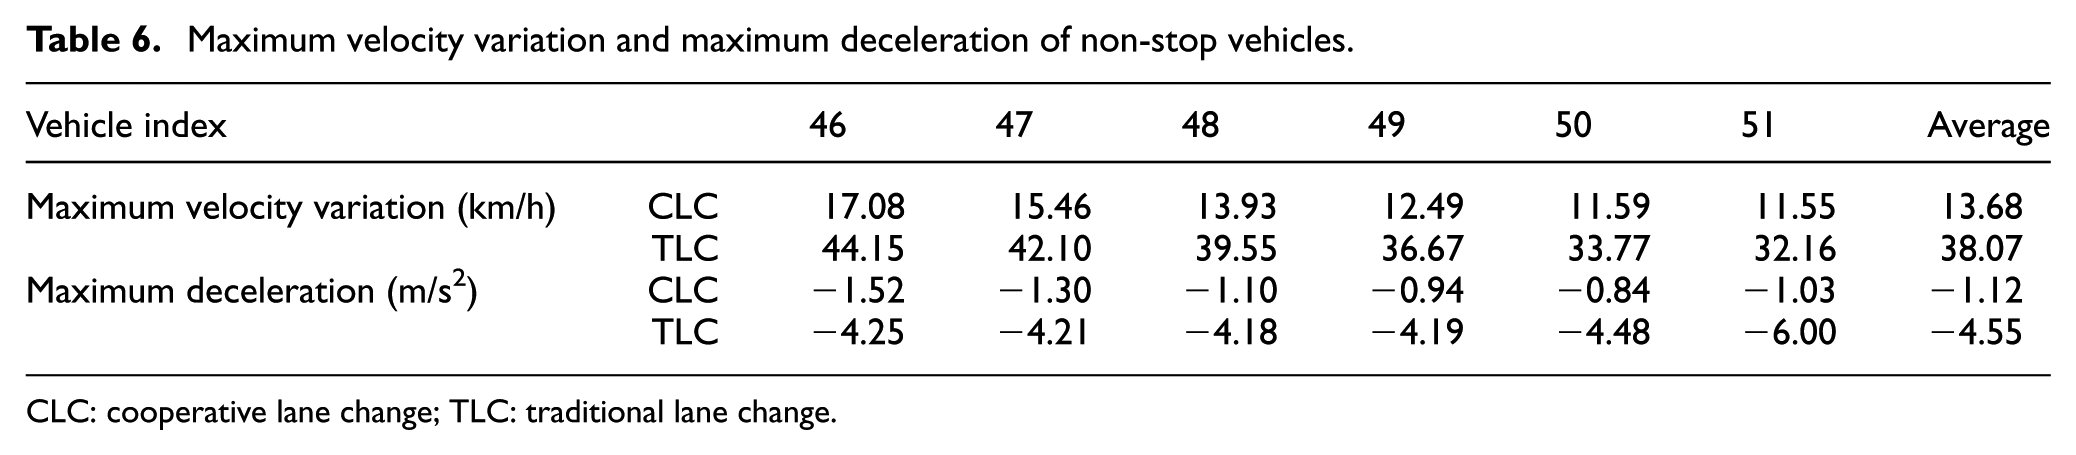
CLC: cooperative lane change; TLC: traditional lane change.
To validate that the proposed CLC strategy can bring advantages above in various initial states of lane change scenario, we classify the 1477 initial states into 11 groups based on the initial distance headway in the target lane. The initial distance headway of the 11 groups varies from 20 to 30 m with a step size of 1 m and the distribution of initial states is shown in Figure 11.

Distribution of initial states in each group.
It can be seen from Figure 11 that the quantity of initial states for feasible lane change increases as the initial distance headway increases. This distribution is consistent with actual situation.
In each group, FV’s average maximum velocity reduction, average quantity of non-stop vehicles, average maximum velocity reduction of non-stop vehicles, and average waiting time of stopped vehicles caused by TLC and CLC are presented in Figure 12. It can be seen that in each group, all average indicators caused by CLC is superior compared with those caused by TLC. Table 7 also shows several average indicators of 1477 initial states which can reflect the impacts caused by lane change.

Several significant average indicators in each group.
Averages of typical indicators in 1477 initial states.

FV: following vehicle; CLC: cooperative lane change; TLC: traditional lane change.
From Figure 12 and Table 7, by comparing several typical indicators, it can be confirmed that the negative impacts can be really reduced by the proposed CLC strategy. In detail, the FV’s maximum velocity reduction and maximum deceleration are reduced by 46.70% and 79.50%, respectively, and the quantity of non-stop vehicles and their maximum velocity reduction and maximum deceleration are also reduced. As for the stopped vehicles due to SV’s cut in, their average waiting time is reduced by 28.76%. Note that the initial states of the simulation scenario represent the traffic flow in urban area, and TLC always causes sudden drastic braking of FV. However, with the proposed CLC strategy, the drastic braking of FV is avoided and the velocity variation of FV is also reduced, which is the key reason for the improvement of traffic flow upstream.
Discussion and conclusion
All benefits of the proposed CLC strategy presented in simulation results are basically attributed to the centralized decision making among PV, SV, and FV. Through the proposed strategy, the passive interactions between vehicles in TLC scenario are transformed into active cooperation.
In detail, comparing with TLC, the cooperation among PV, SV, and FV starts as soon as SV begins to execute lane change. By designing objective functions and constraints with the main goal to reduce FV’s deceleration, PV accelerates and FV decelerates smoothly at the beginning of CLC process which provides more space for SV’s cut in, thus FV’s deceleration is mitigated (see Figure 6). Specially, it is the significant innovation in this article that PV can accelerate properly according to the proposed strategy to utilize the space between PV and its PV. It also implies that driver in PV may accept that the acceleration for the velocity variation and acceleration of PV are small and the security can be ensured by safe distance constraint. PV’s acceleration can be regarded as a trade-off that comfort and safety is sacrificed to a small degree to reduce negative lane change’s impacts on FV and upstream traffic flow. With the proper cooperation control among the three vehicles, the sacrifice is acceptable and worthy.
The CLC strategy can also be regarded as a new form of lane change for connected vehicles. It is appropriate to apply MPC method in the strategy, for with the method the optimal solution under multiple objectives and constraints can be achieved based on the prediction of system state. In the proposed strategy, objective functions and constraints are designed in consideration of safety, comfort, reducing lane change’s negative impacts, and decreasing discomfort caused by the transfer from the strategy to driver, and the multi-objective optimization of the three vehicles’ movements is implemented based on MPC. By comparing with TLC in numerical simulation, it has been demonstrated that the proposed strategy can obviously reduce average braking intensity and average velocity variation of non-stop upstream vehicles by 38.92% and 28.29%, respectively. It can also shorten waiting time of upstream vehicles forced to stop due to lane change by 5.55 s (i.e. 28.76%) in average. Thus, traffic flow can be significantly improved by CLC.
The focus of this article is to propose a new lane change strategy based on the concept of cooperation and to validate whether the strategy can reduce lane change’s negative impacts on traffic flow, so the other issues such as the lower-level control and the implement of the strategy on a real vehicle are out of the scope of this article. In the future studies, real lane change data will be collected and advantages of the strategy will be validated by comparing with the practical lane change process. Furthermore, the studied scenario will be complicated by introducing heterogeneous vehicles with different car-following models. Also, considering lane change maneuver with the assumption that the three vehicles are all connected vehicles is not very practical, but it makes the problem easier to solve. In the future, we will also study the effect of the penetration on the system and consider the problem without so strong an assumption.
Footnotes
Acknowledgements
The authors especially thank Xiaohui Qin, Cheng Xu, Biao Xu, and Xiang Gao for their help and assistance.
Academic Editor: Geert Wets
Declaration of conflicting interests
The author(s) declared no potential conflicts of interest with respect to the research, authorship, and/or publication of this article.
Funding
The author(s) disclosed receipt of the following financial support for the research, authorship, and/or publication of this article: The research was supported by the Chinese National Programs for High Technology Research and Development (no. 2014AA110302).