
Abstract
To study the power loss and radial force characteristics of pump as hydraulic turbine (PAT) under gas–liquid two-phase condition, a single-stage centrifugal pump in reverse mode as turbine was adopted. Based on the Navier–Stokes equation and standard k-epsilon turbulence model, CFD (computational fluid dynamics) technology was used to simulate the flow field in hydraulic turbine. The results show that the gas content has a serious effect on the hydraulic turbine performance. Under the gas–liquid two-phase condition, the fluid velocity distribution in turbine is uneven, and the power loss is not uniform enough when the gas content is less than 0.1. The radial force vector distribution all closed to ellipse shape for different gas content and flow rates, but near the volume tongue an obvious wave appeared. The more the flow rate is, the larger the radial force is. The radial force does not change as regular as that of pure liquid condition, serious fluctuation appeared. For different gas contents, the dominant frequency always equals the rotating frequency of impeller, and subordinate dominant frequency does not appear. Under low gas content and high flow rate, both the fluctuation amplitude and dominant frequency are the maximal.
Introduction
As a key energy saving technique, an energy recovery device for high pressure fluids, the reverse rotating centrifugal pump as hydraulic turbine (PAT) is widely applied in the industries.1–5 When the pump as turbine recycles chemical fluids, a certain amount of gas mixing is inevitably contained in the high pressure fluids. It is important that how much the content of indissoluble gas contained in the liquid is, which impinges huge impacts on the recovery efficiency and operation stability. For instance, the gas content in high pressure fluid can reach a high level of 20% in the process of desulfuration and decarburization technique. 6 If the gas content is completely neglected, the predicted results of hydraulic performance are out of reality. Therefore, the factual situation in hydraulic turbine should be considered as gas–liquid two-phase flow to get more reliable and acceptable performance prediction. Up to now, overwhelming majority of the documents on PAT are obtained under pure liquid medium,7–12 while the documents on pump as turbine for gas–liquid flow are relatively fewer and under development, which only found some investigations of inner field, steady hydraulic force, pressure fluctuations,13,14 and so on, which are far from the study of gas–liquid hydraulic performance in PAT. While energy conversion characteristics and radial force are two important indicators for turbine research, which have a great impact on turbine efficiency and operation stability. In order to comprehensively investigate the hydraulic performance of gas–liquid flow in PAT, the CFD (computational fluid dynamics) techniques are employed to systematically analyze the inner field, power loss process, and transient radial force based on previous research productions on hydraulic turbine operating with pure liquids, which can provide helpful theoretic supports and engineering guidance for further study on gas–liquid two-phase flow in centrifugal pump as turbine machinery.
Research model
A single-stage centrifugal pump as turbine with 84.5 specific speed is selected as research model, and the design flow rate is 170 m3/h, the head is 32.5 m, the rotating speed is 1450 RPM. The main geometrical parameters are listed in Table 1. When the pump is used as turbine, the outlet of pump is the turbine’s inlet, and the inlet of pump is the turbine’s outlet. The three-dimensional geometry of PAT is built by Pro/Engineering. The three-dimensional modeling and meshing diagram of pump as turbine are shown in Figure 1. The grids are generated by ICEM CFD software. A grid independent test of turbine model’s performance was performed. It is found that when the mesh numbers are more than 1.1 million, the variation of efficiency is within 0.3% as is shown in Figure 2. The final total mesh numbers are determined as 1,140,000. The whole computational domain of PAT is constituted of volute, impeller, and draft tube. The outlet is extended to a certain extent for the fully developed flow in PAT.
Main geometric parameters of pump as turbine.

Three-dimensional modeling and meshing diagram of pump as turbine: (a) Three-dimensional modeling; (b) Meshing diagram.

Variation of hydraulic efficiency with mesh number.
Research methods
The basic assumptions for gas–liquid flow in PAT
There are strong interactions between phase interfaces in the process of gas–liquid flow. The factual flow in PAT is much complex turbulent flow because the gas–liquid flow pattern is still unclear and the complicated passage structure. Therefore, the basic assumptions have to be introduced when analyzing the two-phase flow characteristics in PAT.
The high-pressure mixture fluids are homogeneous, which means the gas is uniformly distributed in liquid medium.
The gas is ideal, which satisfies the state equation of ideal gas.
The duration of mixed fluids flow in PAT is very short, which means the heat exchange with outside can be neglected.
The change phase of gas expansion or condensation belongs to isothermal process, which means the inner energy variations are also neglected.
Numerical calculations of PAT
Calculation period and time step set-up
In order to capture the transient characteristics of gas–liquid flow in PAT, the unsteady calculations are employed herein with different gas fractions. The steady convergence results are set as initial value of unsteady calculation. The rotation speed of PAT is 1450 RPM. Then the period T for one cycle is 0.041379 s. The time step is selected as 0.0003448 s for the impeller rotating three degrees, namely, the calculation experienced 120 steps in one cycle.
Turbulent model and boundary condition set-up
The mixture multiphase model is chosen as two-phase flow model in PAT according to the numerical calculation references of gas–liquid flow in centrifugal pump. The time-averaged N-S equations are closed by the standard k-ε turbulence model. The momentum and continuity equations are decoupled and solved by SIMPLEC algorithm. The main forms of momentum and continuity equation are written as follows: 15
Continuity equations

where

Momentum equations

where n is the phase number,

The

The sliding mesh technology is employed to handle the RSI (rotor–stator interaction) coupled in PAT for the unsteady calculation. Pure water and ideal gas are selected as working medium in PAT. The mass flow boundary condition is given at the inlet of PAT, and it is assumed that the gas distributes uniformly. The gas density can be calculated according to the following state equation of ideal gas

where
The mixture mass flow rate of water and ideal gas is adjusted by changing the gas volume fraction at the inlet of PAT. Usually, to prevent the hydraulic turbine from getting cavitated, the 0.4∼0.6 MPa pressure is reserved at the outlet of PAT, therefore, the pressure of 0.5 Mpa is given at the outlet of PAT. The no-slip wall is given as the wall boundary condition. And the standard wall function is adopted near the wall. The residual target of convergence is set as 10−5. The pure water is given as the main phase, and the ideal gas is the second phase. There is no process of phase change and mass transfer between pure water and ideal gas.
Results and discussion
The external characteristic of PAT
In order to validate the rationality and accuracy of numerical calculation, the external characteristic results of experiment and numerical calculation are compared through hydraulic performance test. The comparisons for the case of gas volume fraction

Test bench for pump as turbine.

Comparison between test and numerical performance curves of pump as turbine.
The efficiency was calculated as follows

where
Obviously, it is shown that the predicted
The velocity distribution of PAT
In order to study the internal flow state of PAT and provide initial conditions for unsteady simulation, the velocity distribution in pump as turbine was analyzed under different working conditions, and the velocity contours are shown in Figure 5.

Speed contours of pump as turbine under different working conditions: (a) 0.8Q. (b) 1.2Q. (c) 1.4Q.
At the flow rate of
At the flow rate of
At the flow rate of
Compared comprehensively, the fluid velocity distribution at the flow rate of
Power loss characteristics
During the process of energy recycling, the pressure energies were converted into mechanical energies through the pump as turbine, and then pumps or fans were driven by these mechanical energies. This is the energy conversion principle in PAT. To the pressure energies that going through the impeller, only some of them were converted into mechanical energies, the rest were lost. According to the law of conservation and transformation of energy, the power loss equals to the difference of total pressure energy and net power, the formula is as follows

Where
When the high-pressure fluids with gas flowed in PAT, the power loss is different for various gas contents. Therefore, it is necessary to analyze the influence of gas contents on it. The transient characteristic of power loss varied under different gas volume fractions is shown in Figure 6, the last calculation cycle is marked on the abscissa, and the ordinate represents power loss in impeller.

Time-domain diagrams of power loss on turbine impeller under the variable working conditions: (a) 1.0Q. (b) 1.2Q. (c) 1.4Q. (d)1.6Q.
From Figure 6, the power loss in one cycle performs periodic variations and the wave numbers are the same as the blade numbers. Under the different gas content the uncertainties of power loss are caused by the uncertainties of total pressure energy and net power. The larger the flow rate is, the greater the power loss is. Meanwhile, for the same flow rate, the higher the gas fraction level is, the less the power loss is. These above two phenomena occurred for the cases of gas volume fraction of
To summarize, the power loss distributions are disorder and not uniform enough when the gas contents are less than
Transient radial force analysis
Radial force vector distribution
The transient hydrodynamics of radial force is comprehensively studied, the unsteady numerical calculations are run for the cases of 1.0Q, 1.2Q, 1.4Q, and 1.6Q, respectively. The numerical values of radial force are integrated by the pressure and shear stress of blade suction side, pressure side, hub, and shroud. The distribution curves of radial force vector are obtained for different gas volume fractions in PAT in Figure 7. The z axis was chosen as a rotating axis, the radial force FX and FY is the component force in the direction of x and y axis, respectively. The point represents the radial force on impeller at certain moment.

Vector diagrams of radial force on impeller under variable working conditions: (a)1.0Q. (b) 1.2Q. (c) 1.4Q. (d)1.6Q.
It is shown that the radial force vectors on impeller are distributed within four quadrants in the rectangular coordinates. The curves are asymmetrical and the centers of vector are partially displaced to first and fourth quadrants, which performs same trend as that in pure liquid medium. In the phase of rotating cycle, the magnitude and direction of radial force vector both experienced evident changes, and the curves of radial force distributions all closed to ellipse shape for different gas content and flow rates, but near the volume tongue an obvious wave appeared.
The radial force vectors performed wave character and huge force differences impinging on the impeller under different gas contents, which all can be found in Figure 7(a). The circumferential component of radial force vectors are uniformly distributed except for the case of
Time domain distribution of radial force on impeller
The transient radial resultant forces on impeller for different gas contents and operation working are shown in Figure 8, in which the abscissa varied with time sequence marked on the ordinate corresponding to the last revolution. The abscissa represents time in one cycle (the sixth rotating cycle is 0.2069∼0.2483), the ordinate represents resultant force of transient radial force. The maximum radial force fluctuation differences under variable gas contents and working conditions are shown in Table 2. The maximum radial force fluctuation difference is defined as follows


Time-domain spectrums of radial force on impeller under different working conditions: (a) 1.0Q. (b) 1.2Q. (c) 1.4Q. (d) 1.6Q.
The maximum fluctuation difference and dominant frequency of radial force under variable gas contents and working conditions.

where
In Figure 8, under different working conditions, the more the flow rate is, the larger the radial force is. In one circle, the change trend of radial force is consistent and the radial force changes periodically; but the radial force does not change as regular as that of pure liquid condition, as serious fluctuation appeared, especially for the gas volume of
In Table 2, for the same flow rate and different gas content, the maximum radial force difference changes irregularly, and considerable difference exists. But for the same gas content and different flow rate, the maximum radial force difference changes regularly, and the total change trend is the larger the flow rate, the larger the radial force fluctuation amplitude. At gas volume fraction of
To sum up, the gas inclusion plays a major factor to influence the radial force on impeller. But, it can be concluded that there are not distinct patterns for the cases of large and small flow rates, the maximum radial force fluctuation usually appears at the lower volume fraction and larger flow rate.
Frequency domain distribution of radial force on impeller
According to the time sequence of radial force imparted on impeller, the frequency domain spectrums of radial force on impellers were obtained through Fast Fourier Transfer (FFT), and the frequency domain spectrums of radial force under different working conditions are listed in Figure 9.
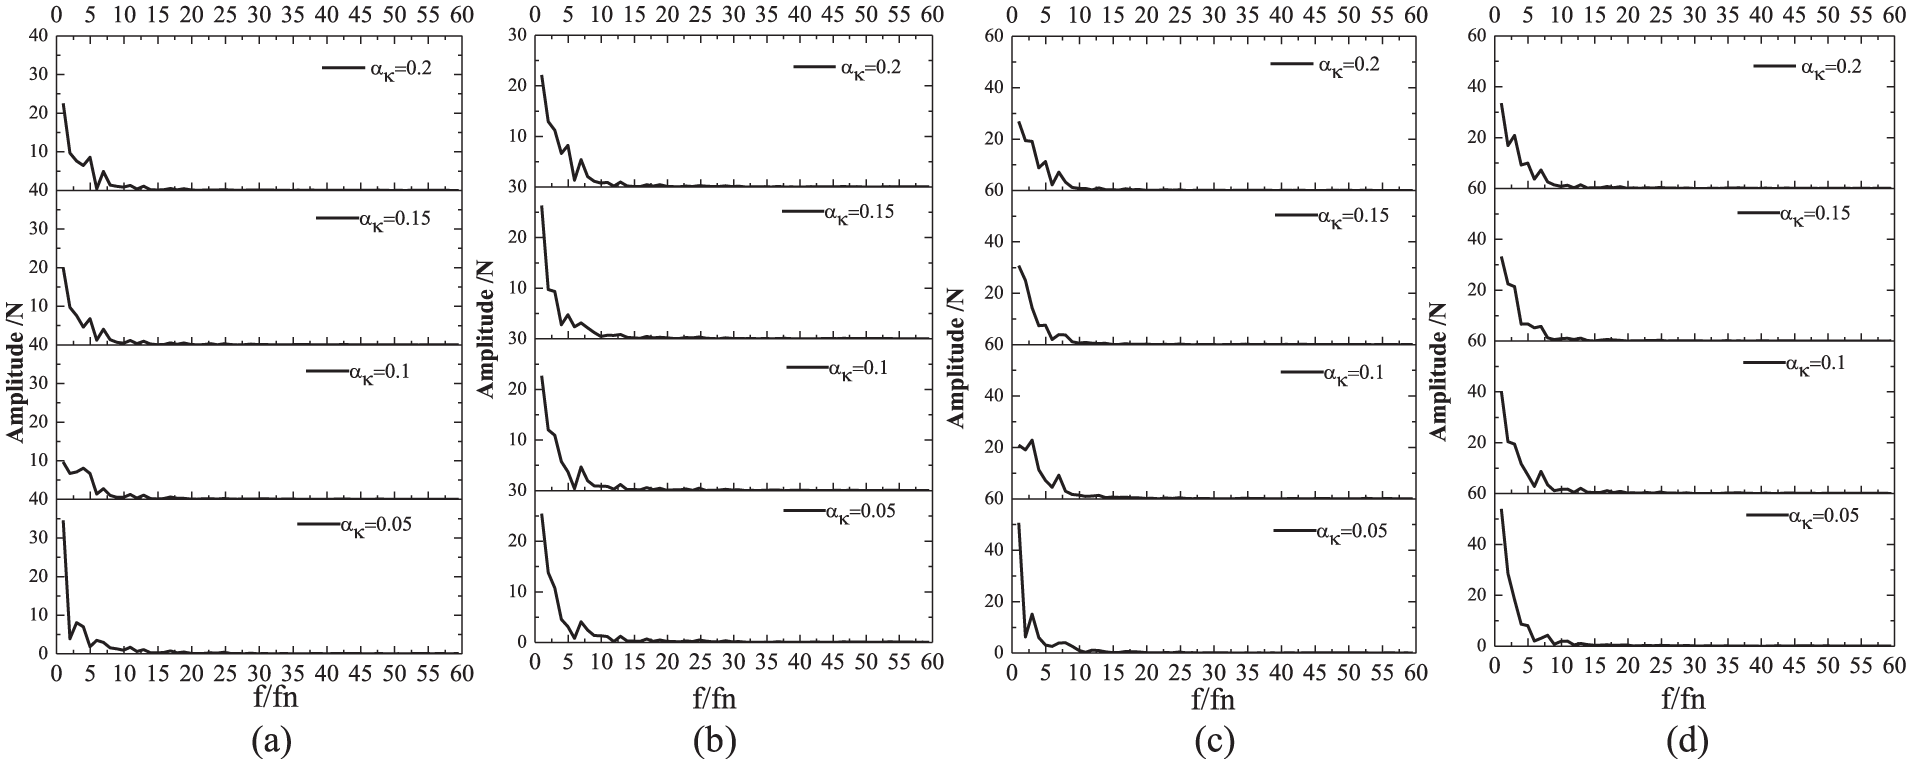
Frequency-domain spectrums of radial forces on the impeller under different working conditions: (a) 1.0Q. (b) 1.2Q.(c) 1.4Q. (d) 1.6Q.
The ordinate shows the frequency amplitude of radial force on the impeller, and the abscissa shows the ratio of the radial force frequency to the rotating frequency. For this pump as turbine, the rotating speed of impeller is
From Figure 9 and Table 2, for all the different flow rates and gas volume fractions, the dominant frequency of radial force equals to rotating frequency, the subordinate dominant frequency does not appear. After the
Conclusion
On the effect of rotor–stator interaction and gas content, the velocity distribution in pump as turbine is uneven, low pressure area appeared, which is not good for the steady running of turbine. The power loss distribution is in disordered manner and not uniform enough when the gas contents are less than
Under the gas–liquid two-phase condition, the radial force vector distribution all closed to ellipse shape for different gas content and flow rates, but near the volume tongue, an obvious wave appeared. The impeller transient radial force is affected by gas content. The more the flow rate is, the larger the radial force is. When the radial force does not change regularly as that of pure liquid condition, serious fluctuation appeared. There are not distinct patterns for the cases of large and small flow rates, the maximum radial force fluctuation usually appears at the lower volume fraction and larger flow rate. For different gas contents, the dominant frequency always equals the rotating frequency of impeller, and subordinate dominant frequency does not appear. As a whole, under low gas content and high flow rate, both the fluctuation amplitude and dominant frequency are the maximal. For this hydraulic turbine, the flow rate equals to
Footnotes
Handling Editor: Rui Lima
Declaration of conflicting interests
The author(s) declared no potential conflicts of interest with respect to the research, authorship, and/or publication of this article.
Funding
The author(s) disclosed receipt of the following financial support for the research, authorship, and/or publication of this article: This work was financially supported by the National Natural Science Fund Project of China (Grant 51569013), Key Laboratory of Fluid machinery and Systems, Gansu Province (901709), Gansu province science and Technology Fund (17JR5RA110), Key Laboratory of Fluid and Power Machinery, Ministry of Education, Xihua University (szjj2017-091) and Doctoral fund of LanZhou University of Technology (061802).