
Abstract
Pump as turbine is a device for energy conversion. To master the characteristics of energy transformation, especially within impeller, plays important roles for further optimum design of pump as turbine. In order to analyze the energy-changing features in detail using computational fluid dynamics, the impeller is divided into six regions by the radius. Under different operating conditions, the variations of power in the different radial cross-section of the impeller, the input net energy in different regions of the impeller, and the energy from the fluid to the impeller were demonstrated. The results show that the pressure energy of fluid is primary for impeller work, instead of the kinetic energy; the front and middle regions of the impeller (about the area of (0.6–1.0) D2) are important parts for energy conversion; in the rear area of the impeller, it acquires little energy from fluid relatively, what’s more, the fluid not only does not work to impeller, but also consumes the impeller mechanical energy under the large flow conditions. So this research may point out the direction for optimization design of the impeller blade.
Introduction
Energy conservation while exploring renewable environmentally friendly energy resources is vital in the quest to catch up with increasing energy demands. Pump is reversible rotating machinery. The forward run can transform the rotating mechanical energy into liquid pressure energy, achieving the role of liquid pressurization. The reverse run as a turbine, transforming the high-pressure liquid pressure energy into rotating machinery energy, can accomplish the exploitation and utilization of high-pressure fluid. When pump is used as turbine, it also has the advantages of simple structure, small volume, low cost, reliable operation, convenient maintenance, and so on. So it has been widely used in the petroleum industry, desalination, 1 water distribution network,2–4 and other process industries,5,6 because there is a lot of high-pressure fluid in those process industries, and usually this part of the energy is wasted in vain. However, the efficiency of pump as turbine (PAT) is low, which means that its ability of energy recovery is poor. Therefore, it is of great significance to research the performance of PAT.
At present, the study of PAT is partly focused on selecting the appropriate pump used as the turbine,7–13 while the research on the high-efficiency optimization design of PAT is relatively scarce.14–16 Through production practice and existing literature, it is found that the efficiency of PAT is usually not higher than that of pump in the corresponding operating conditions. 17 The main reason is that some geometric parameters of pump are not well suited to run in the turbine operating conditions. Because these geometric parameters are designed in favor of its forward, and does not consider the reversal of the situation. Therefore, when the centrifugal pump is reversal for the turbine, some geometric parameters need to be optimized properly. However, the essence of the PAT is to convert the kinetic and potential energy of the fluid into the rotating mechanical energy of the impeller; it is a kind of energy conversion device. If the energy conversion process and its rule in the PAT are known, it will provide the direction for design and optimization of PAT. So it is necessary to study the energy conversion characteristics of PAT, before optimization of the PAT. The research result may provide a reference for the subsequent optimization design.
For researching energy conversion characteristics of PAT in detail, theoretical analysis and empirical prediction can only outline the energy conversion characteristics in the macroscopic point of view, and it is very difficult to study energy conversion in the impeller due to the limitations of the experimental method. Therefore, the technique of computational fluid dynamics (CFD) is used to analyze the energy conversion characteristics in the impeller of PAT. The premise of adopting the CFD technique is that numerical calculation can accurately predict the performance of PAT. So a laboratory model of PAT test rig was set up to validate numerical simulation.
Numerical investigation
Main design parameters of PAT
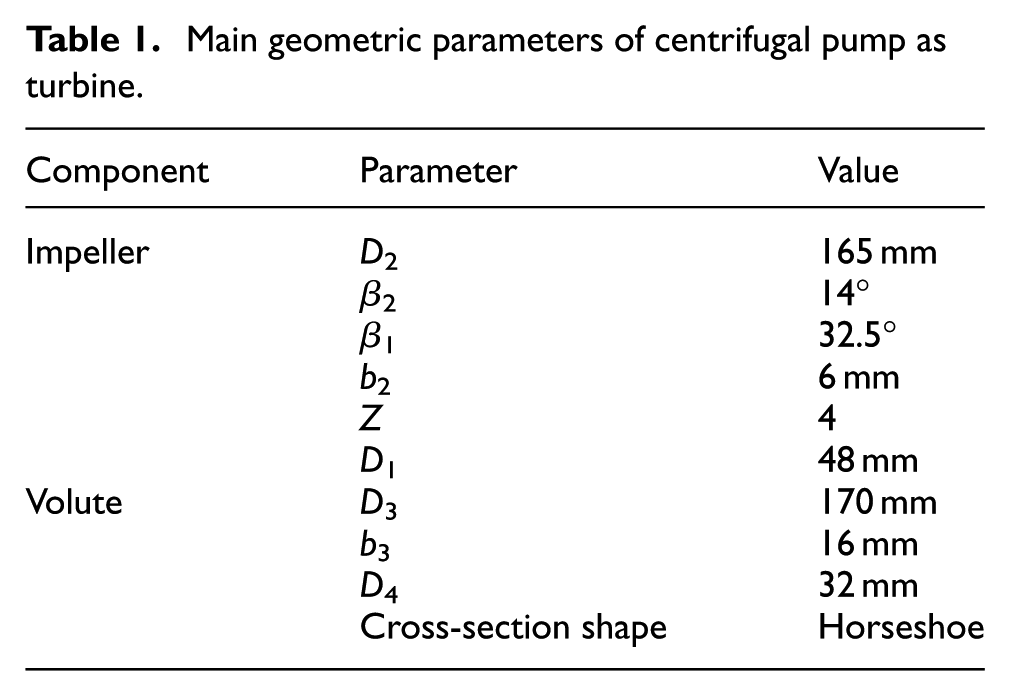
In this study, a single-stage and single-suction centrifugal pump running in the reverse model as turbine was selected. 18 The centrifugal pump design parameters are as follows: flow rate Q = 12.5 m 3 /h, head H = 30.7 m, rotating speed n = 2900 rev/min, specific speed ns = 48, and the shape of the blade is cylindrical. Figure 1 shows the projection of the selected turbine. Table 1 shows the main geometric parameters of the turbine.

(a) Impeller axial plane projection and (b) impeller plane projection.
Main geometric parameters of centrifugal pump as turbine.
Three-dimensional model of the PAT’s fluid
The computational domain model was generated by the three-dimensional (3D) modeling software Pro/Engineer. The computational domain is composed of water inlet duct, volute, impeller, leakage channel, and draft tube, which is shown in Figure 2.

Division of 3D model within the PAT’s control volume.
Mesh generation
After determining the calculation domain model, ICEM 19 was used to generate a structured hexahedral mesh for each component part. The grid sensitivity test was performed; using six kinds of size of the mesh to divide the grid of the model, the grid numbers of 506,484, 694,260, 926,242, 1,178,560, 1,368,766, and 1,608,472, respectively, are used. When the grid number is about 1.1 million, the variation of efficiency was within 0.5% as indicated in Figure 3. The final mesh number is 1,178,560. Figure 4 shows the meshes of the centrifugal impeller and the mesh assembly of the whole flow field.

Effect of the mesh numbers on the numerical prediction.

Mesh of impeller and assembly.
Solution parameters
The ANSYS-FLUENT software
20
was selected to calculate 3D Navier–Stokes equation. The turbulence chosen was the standard k–ε model. The convergence criterion was
Validation of numerical simulation
Experimental setup
A laboratory model of PAT test rig, as shown in Figure 5, was built at Lanzhou Xiyu pump Co., Ltd. The main equipment of this experimental table is composed of an electric motor, a feed pump, a control valve, an electromagnetic flow meter, a differential pressure transducer, a PAT, a torque meter, and an energy dissipation pump. In this test rig system, a feed pump was used to supply high-pressure fluid for the PAT’s energy recovery; the flow rate of PAT is controlled by the control valve; the discharge was measured by the electromagnetic flow meter; the torque meter was used to measure the energy generated by the PAT; the energy dissipation pump was installed to consume the energy generated by the PAT. After measuring all the parameters, the required pressure head, shaft power, and efficiency were obtained. The uncertainties of the measured required pressure head H, flow rate Q, hydraulic power Ph, generated shaft power P, and efficiency η are ±0.16%, ±0.52%, ±0.54%, ±1.16%, and ±1.25, respectively.

PAT test rig.
Comparison between the numerical and experimental results
The PAT described in this article was selected to validate the numerical accuracy. The geometric parameters are listed in Table 1. Figure 6 shows the PAT model. Comparison between the numerical and experimental results is presented in Figure 7. As shown in Figure 7, the tendency of the PAT’s numerically predicted performance curves corresponds to that predicted using the experiment. The numerically predicted results are higher than the experimental results. The overprediction of efficiency and pressure head may be attributed to neglecting the leakage loss through the balancing holes and the mechanical loss caused by mechanical seals and bearings. The comparison between the numerical and experimental results reflects that the grid and turbulence models selected are beneficial to the PAT’s performance prediction. CFD can be used for the PAT’s performance prediction.

PAT model.
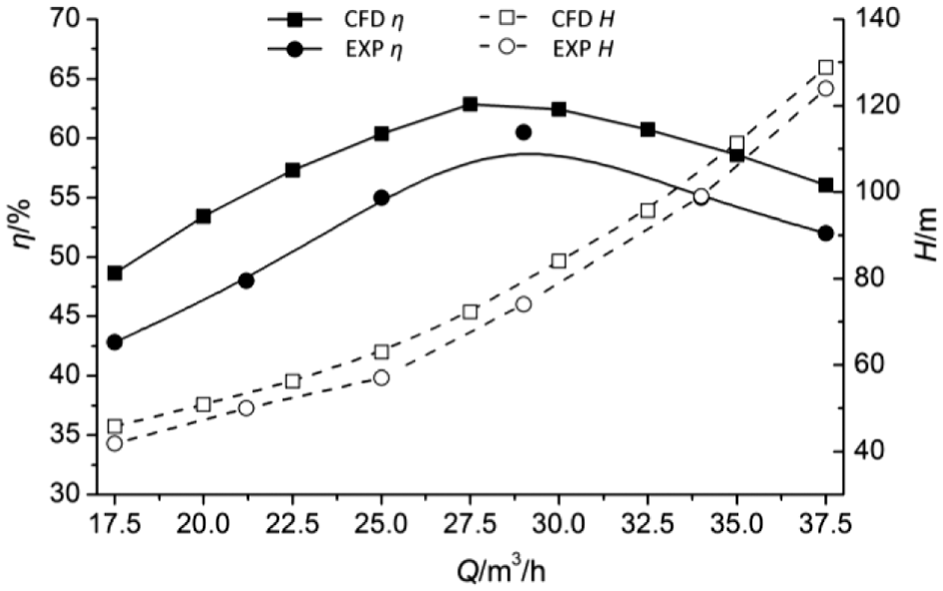
Numerical and experimental results.
Energy conversion characteristic analysis
Impeller is the key component of PAT energy conversion. Controlling the internal energy conversion process and the characteristics of impeller will contribute to the design and optimization of PAT. In order to analyze the internal energy conversion process in detail, the impeller is divided into six parts from the inlet to the outlet. The seven specific sectional positions are shown in Figure 8(a), where section 1 is the inlet section of the impeller and section 7 is the outlet section. The 3D schematic diagram of every region of the impeller is shown in Figure 8(b).

Schematic diagram of the impeller division of the PAT: (a) plane projection and (b) 3D plot.
The variation feature of power in different radial cross-sections of the impeller
Figure 9 shows the power change curve of each cross-section of the impeller at different flow rates. The power is calculated according to equation (1) 21

where the part within the integral symbol represents the power density,
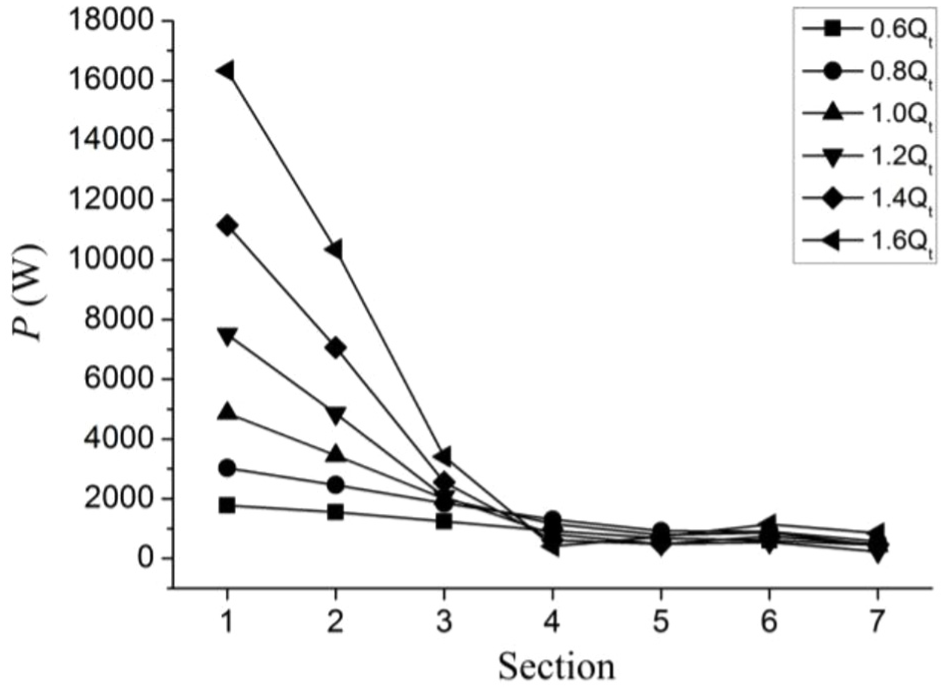
Power distribution of cross-flow section of impeller.
It can be seen from Figure 9 that, under different flow rates, the power change trend along the sections (from inlet to outlet) is similar. In the first three sections, the power showed a downward trend and the power descending gradient at high flow rates is greater than that at small flow rates. From the fourth section to the outlet section, the energy of the fluid is not much different at different flow rates.
The total pressure includes static pressure and dynamic pressure. According to formula (1), the total power can also be divided into static pressure power and dynamic pressure power, which can be calculated using formulas (2) and (3). Figure 10 shows the static pressure power and dynamic pressure power curves at different flow rates


where

Static and dynamic pressure power distribution of each section of the impeller under different flow rates: (a) static pressure power and (b) dynamic pressure power.
It can be seen from Figure 10 that, in the first four sections of the impeller, the variation law of static pressure power is similar to that of the total pressure power. That is, the static pressure power on the first four sections is decreased in turn. And after the fourth section, there is a significant difference between the static pressure power and the total pressure power in the amplitude and the variation law. For the change of static pressure in the impeller, there are three main reasons. First, there is the mutual conversion of static pressure power and dynamic pressure power in different sections, because the area of each section is different. It can also be clearly seen from the figure that there is a strong transformation between the dynamic and static pressure energies from the third section to the sixth section of the impeller; second, the static pressure energy is used to drive the impeller to rotate. That is, the pressure energy of the fluid is transformed into mechanical energy of the impeller; third, because of the existence of hydraulic resistance, a part of static pressure is consumed.
The correlation between the dynamic pressure power and the flow is different in each section. The correlation between the dynamic pressure power and the flow is small in sections 3, 6, and 7. But the dynamic pressure power in each section is positively related to the flow. That is, the greater the flow, the greater the dynamic pressure power on each section. This is because, when the flow is increased, the kinetic energy of the fluid through each cross-section will be increased correspondingly.
Input net energy change regulation of different regions of the impeller
The input net energy of each region of the impeller represents the energy difference between the two adjacent sections. Figure 11 shows the net power change curves for different regions of the impeller at different flow rates.

Input net power change curve of each region of the impeller.
It can be seen from Figure 11 that, in the first three regions of the impeller, the input net energy is the most and directly proportional to the flow rate, that is, as the flow rate increases, the net power of the first three regions is increased. And the input net energy is relatively small in the last three regions; what is more, as the flow rate is increasing, the input net energy is negative in the fourth and fifth regions of the impeller.
The transferred energy from fluid to impeller
The net energy of the input impeller cannot be completely converted into usable mechanical energy because of the existence of hydraulic losses in the PAT impeller. The energy of these losses is difficult to obtain directly. In order to acquire the transferred energy from the fluid to the impeller, equation (4) is used to calculate this part energy. Figure 12 shows the energy conversion features of each region of the impeller at different flow rates

where

The transferred energy distribution from the fluid to the impeller of each impeller region.
It can be seen from Figure 12 that the energy obtained by the impeller mainly comes from the first three regions of the impeller, where most of the energy is in the second region, and the energy gained by the impeller also increases with the increase of flow rate. For the fourth and fifth regions of the impeller, the energy obtained is relatively small at low flow rates. As the flow rate increasing, not only are these two regions no obtaining the energy from fluid, but also do work for the fluid actually. Since the sixth zone does not contain blades, the energy obtained from this region is almost zero.
When the fluid-driven PAT impeller is rotating, the pressure energy of the fluid is converted into mechanical energy of the impeller. This part mechanical energy is equal to the product of the impeller rotating shaft torque and rotational angular velocity. The impeller rotor torque can be divided into two parts: the first part is the fluid pressure of the impeller passageway surface on the impeller shaft drive torque; the second part is viscous force torque caused by no sliding wall conditions on the impeller. Therefore, per unit time, the work done by the fluid on the impeller includes the work of the pressure part and the work of the viscous force, which is equal to the sum of the above two parts’ moments multiplied by the impeller rotation angular velocity, which is given by

In formula (5),
Figures 13 and 14 show the distribution of two kinds of power in the whole impeller and each region of the impeller, respectively.

Power distribution of pressure and viscous force acting on the impeller under different flow rates.

Distribution of pressure and viscous forces acting on each region of the impeller under different flow rates: (a) 0.6Qt, (b) 0.8Qt, (c) 1.0Qt, (d) 1.2Qt, (e) 1.4Qt, and (f) 1.6Qt.
It can be seen from Figure 13 that the fluid do work to impeller is dominated by the pressure energy, while the work comes from the viscous force generated mostly at near-wall regions does accounts for only a small proportion, what is more, the viscous force do negative work to the impeller.
Figure 14 shows the work done by the pressure and viscous forces in each region of the impeller in detail. At small flow rates, the viscous force do negative work to all the regions, but in the large flow conditions the viscous force is doing positive work on the first region of the impeller. Whether the viscous force does positive or negative work mainly depends on the angle between the direction of viscous force and that of the resultant forces of the impeller. If the angle between the direction of the viscous force and that of the resultant forces that the impeller can withstand is less than (or greater than) 90°, the viscous force will do positive work (or negative work) to the impeller. Combined with Newton’s internal friction law, it can be known that the direction of the viscous force is related to the direction of the relative velocity of the fluid. So, based on the viscous force on the impeller in different regions of the work done, the fluid movement could be obtained in these regions.
Energy conversion capability of the impeller
Energy conversion capability of the impeller is a very important macro parameter. The above sections analyzed the input net power and the fluid does work to the impeller of PAT under different flow rates. Next the energy conversion capability of the impeller will be analyzed as follows. In the hydraulic machinery, the hydraulic efficiency of the impeller is usually used as a parameter to measure the energy conversion capability, namely

where
Figure 15 shows the efficiency curves of the PAT impeller at different flow rates.

PAT impeller efficiency under different flow rates.
As can be seen from Figure 15, the efficiency of the PAT impeller increased gradually from 0.6Qt to 0.8Qt, from 0.8Qt to 1.2Qt it basically remained unchanged, and from 1.2Qt to 1.6Qt it gradually decreased. In short, the PAT impeller energy conversion capability at 0.8Qt, 1.0Qt, and 1.2Qt is stronger than that under the other flow rates; it can also be seen from the figure that the efficiency of the impeller is relatively poor, even in the highest efficiency point. That is, there is a large energy loss in the impeller. So it is necessary to optimize the impeller to improve the efficiency of the PAT, because impeller is the most important component in the PAT. Combining the research results of this article, for the research model proposed here, the impeller blade in the fourth and fifth regions should be optimized at least.
Conclusion
The energy transfer characteristics of the impeller are studied when the centrifugal pump is reversely operated as turbine. The results show that the pressure energy of the fluid is primary for impeller work, instead of the kinetic energy. The key region for doing work is the front and middle part of impeller (about (0.6–1.0)D2), while in the rear region of the impeller, the fluid do work to the impeller is relatively small at the small flow rates, and the fluid not only cannot do work to the impeller, but also consumes impeller mechanical energy at large flow rates. This at least shows that the PAT blades need to be optimized to improve the performance, especially in the impeller blade rear area.
Footnotes
Appendix 1
Handling editor: Jiin-Yuh Jang
Declaration of conflicting interests
The author(s) declared no potential conflicts of interest with respect to the research, authorship, and/or publication of this article.
Funding
The author(s) disclosed receipt of the following financial support for the research, authorship, and/or publication of this article: This study was financially supported by the Gansu Province Science and Technology Fund of China (17JR5RA110), Open Research Subject of Key Laboratory of Fluid and Power Machinery (Xihua University), Ministry of Education (szjj2017-091), and National Natural Science Fund Project of China (51569013).