
Abstract
Secondary accidents usually occur after an accident in a freeway tunnel. To this end, this article proposes an integrated safety early warning system for preventing secondary accidents in tunnels. First, we analyzed key parameters such as the average speed in the tunnel, the interior light sensitivity, and the driver’s physiology, and proposed a safety warning model for tunnels. According to the driving rules of tunnels, an efficiency grooming model is proposed to analyze the delay of the traffic in tunnels and determine the best warning. Finally, the Jiulingshan Tunnel was simulated and verified by VISSIM software to analyze the feasibility and effectiveness of the model.
Keywords
Introduction
At present, there is still a high incidence of traffic accidents in highway tunnels, while the study of tunnel traffic safety is only in its early stages. After the accident, untimely warning, bad warning position, and many other factors may lead to a secondary tunnel accident. The secondary traffic accidents are very harmful, they cause more serious casualties and property damage than ordinary traffic accidents, and the research of anti-accident early warning system for expressway tunnels is imminent.
Early warning studies of highway accidents were conducted widely around the world. In 1999, Abbas and McCoy 1 first proposed the variable message sign (VMS) location optimization problem; in 2007, YC Chiu and N Huynh 2 pioneered the optimal location model of VMS for accident treatment periods; in 2012, C Oh et al. 3 applied it to intelligent transportation systems on the basis of accident monitoring, warning, and processing; in 2012, KD Kusano and HC Gabler 4 studied the collision warning of vehicles with traditional ranging sensors; in 2012, V Milans et al. 5 proposed a fuzzy rear-end collision warning model based on time to collision (TTC) and headway distance; from 2007 to 2012, foreign scholars analyzed the highway safety and the influencing factors of accidents, used traffic flow to evaluate the safety level of expressways, and proposed the corresponding safeguard measures.6–10 In the field of highway accident early warning, from 2013 to 2014, domestic scholars L Sun et al., 11 M Hao, 12 and Z Jiang et al. 13 conducted a basic and in-depth study on traffic volume and traffic conflicts. In 2014, W Zhan et al. 14 conducted a gray Maldives forecast for highway tunnel traffic accidents. In 2015, H Chen and J Lu 15 conducted VISSIM simulation verification on highway traffic accidents. In this article, we propose an integrated safety early warning system for tunnels against secondary accidents, and the emergency plan for tunnel accident handling was based on the safety warning distance; we also perform an optimal warning for the location of accidents in tunnels. Diverting and responding at first will greatly reduce the emergency response time of highway tunnel managers. At the same time, the rear vehicle will perceive the anomaly of the road ahead faster, then slow down the speed, or bypass in advance through the area of the incident, and it could effectively reduce the probability of secondary accidents in the tunnel and improve the safety and efficiency of road driving (Figure 1).

Proportion map of accident types in expressway tunnels.
Through the collection and analysis of traffic accident data during the operation of highway tunnels in the past 5 years from 2012 to 2017, 16 the types of accidents are fully understood (Table 1).
Highway tunnel traffic accident data.
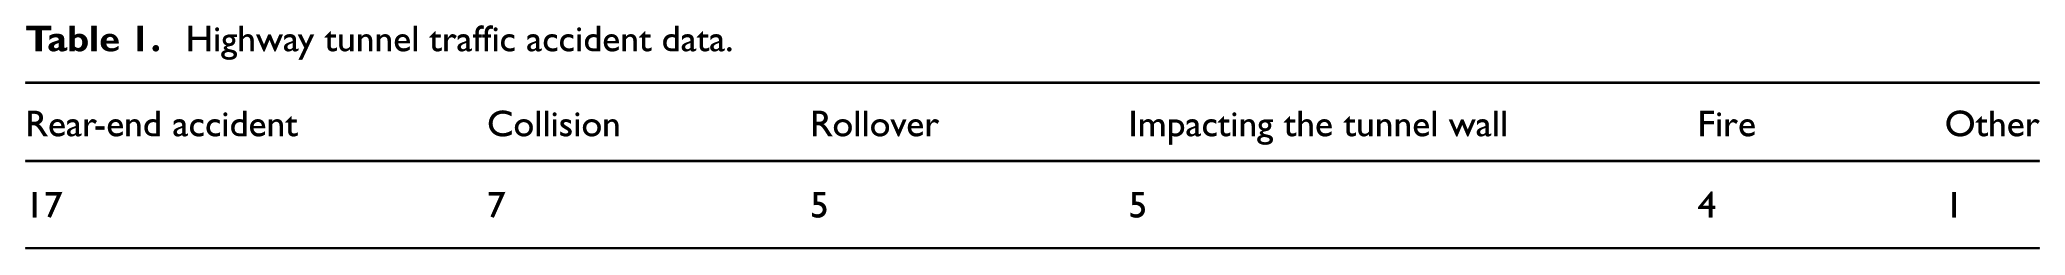
According to the chart, the rear-end collision accident accounts for about 62% of the total accidents. The early warning of the second rear-end accident is very important.
This article improves the existing security early warning model and obtains a new security early warning distance. Based on the security early warning distance, it analyzes the optimal grooming position after the accident and finally uses the VISSIM software to verify the grooming model.
Tunnel accident early warning model
In this article, we used accident detection technology and model optimization to propose a secondary accident early warning model, as shown in Figure 2, in which the single line in the dotted line box represents the internal connection and the line between the dotted line frames represents the external contact.
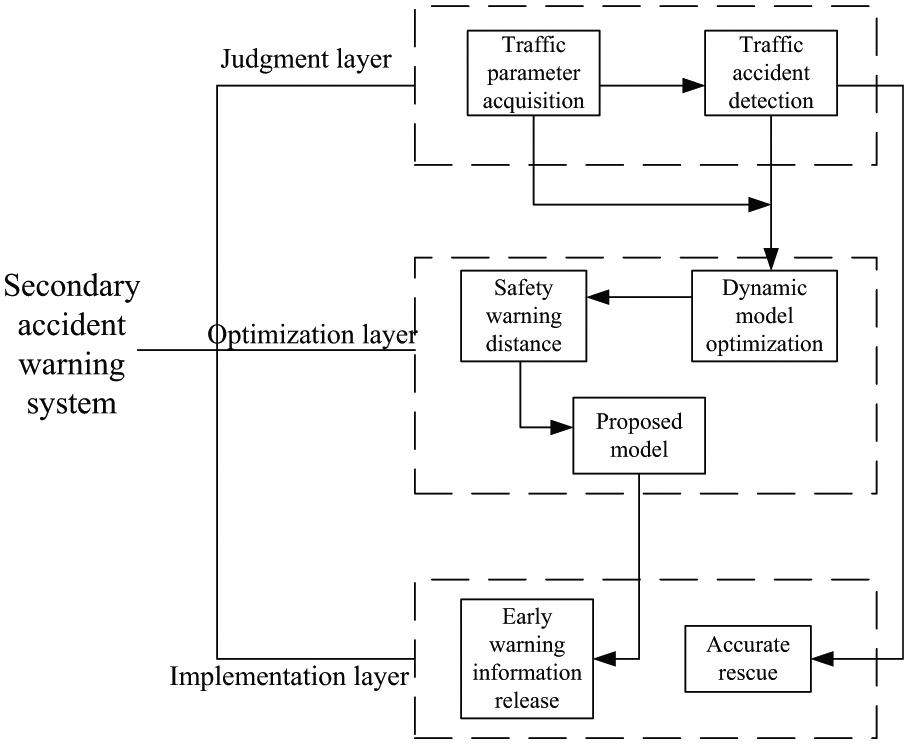
Secondary accident warning model.
The model structure is mainly divided into three layers. On the upper layer, the judgment layer acquires the information of the traffic operating parameters in the tunnel and detects the traffic accident according to the continuous flow in the tunnel. The optimization layer optimizes the existing model according to the operating parameters in the tunnel, obtains a more secure security warning distance, and proposes a grooming model on the basis of the security warning. The implementation layer issues early warning information and accurate rescue (Figure 3).

Accurate information release diagram.
Tunnel warning analysis
Tunnel security early warning analysis
A typical vehicle braking process is described as follows: the driver identified the front traffic and was aware that an emergency brake should be made, the right foot was moved to the brake pedal, and the emergency brake was stopped until the vehicle stops. The whole braking process can be divided into the following four stages, the vehicle braking process curve is shown in Figure 4.

Simplified diagram of the vehicle braking process.
The driver’s response phase includes the time when the driver finds the fault and makes the judgment and the time the foot moves from the accelerator pedal to the brake pedal.
The brake coordination phase
The deceleration growth phase
Continuous braking phase
Set the initial speed
According to the type of accident in the highway tunnel, we can judge the state of the target vehicle and synthesize the previous research on the warning distance of the safety accident. We can obtain the following information.
Braking distance

Warning distance

The formula improves the light sensitivity coefficient and defines the light sensitivity coefficient L. 17 When the tunnel achieves good performance, the driver is less affected by the light and the reaction time tL is shorter. When the line of sight is poor, the driver will be affected by light.
Photosensitivity reaction time is given as
Warning distance

Tunnel accident grooming model
The traffic in the tunnel is a continuous flow, and it can be seen as the continuous flow of the front distance. If the vehicle arrives in accordance with the Poisson distribution, the headway distance is consistent with the negative exponential distribution (Figure 5).

Vehicle trajectory map of tunnel accident.
The probability of arrival (k = 0) of the vehicle in the time interval t is

The above formula shows that, at a specific time interval t, if no vehicle arrives, the distance between the arrival of the vehicle and the arrival of the vehicle is at least t seconds; in other words, P(0) is also the distance h greater than or equal to the probability of t seconds

While the probability of less than the distance t is

When the front time is t1 – t2

If Q represents the hourly traffic volume, then
According to the efficiency promotion model, the location of the warning is further determined.
Instance verification
Jiulingshan Tunnel analysis
Safety warning distance calculation
Compared with other ordinary highway tunnels, the mountainous highway tunnel has the following characteristics: the mountainous bad weather and the bad road visibility (less than 50 m) seriously affect the safety of the tunnel traffic. The mountain tunnel has many turns and the downhill road is long, although there are some one-way four-lane tunnels, but the proportion of two-lane tunnels is still relatively high, and they are unable to meet the growing traffic demand. In the event of a traffic accident, the tunnel is likely to cause traffic congestion.
The length of Jiulingshan Tunnel is 5.4 km, known as the “longest tunnel in Jiangxi Province” and is also the first tunnel hitting a length of 1000 m of inclined shaft ventilation tunnel in Jiangxi Province. With the help of the expressway management branch, some basic data of Jiulingshan Tunnel were collected and data on the relevant research literature and field investigation of Jiulingshan Tunnel were collected. The peak hours, traffic volume, average driving speed, and some other quantitative index values were obtained.
There are some parameters to be determined in the model:
Speed ν: China stipulates that the maximum speed of cars is 80 km/h (some tunnel speed limit 60 km/h) and that of other motor vehicles is 60 km/h. This provision is conducive to the protection of traffic safety, maintenance of order, and efficiency of the highway. The value of its speed should be based on the measured data at 60 km/h.
Driver response time tr: The driver reaction time is generally 0.3–1.2 s. According to the test, when the speed is 40 km/h, the driver response time is 0.6 s in normal circumstances; when the speed is increased to 80 km/h, then the reaction time is 1.2 s. In addition, the driver on the highway driven a long time, the reaction time will increase, so the sake of safety we should take 1.2 s.
Braking coordination time ta and brake deceleration growth time ts: In accordance with the provisions of the European Community, when the car is being driven at 80 km/h, the sum of the brake coordination time and half the brake deceleration growth time should be less than 0.36 s. Brake deceleration growth time is usually 0.2 s, so the braking coordination time is preferably 0.1 s.
Road surface adhesion coefficient φ: This coefficient is closely related to weather conditions, speed, road surface type, tunnel time, and other factors and the road tunnel road surface adhesion coefficient is generally between 0.25 to 0.65, but in a special environment, the pavement adhesion coefficient should be based on the measured data.
Safe distance d0: The recommended value of distance is 2–5 m in China and abroad; considering the safety problems and system delay, the safety distance should be assumed to be large, but considering the tunnel capacity, the distance of 3 m is more reasonable.
Photosensitivity reaction time
According to the parameters, we calculated the safety warning distance as 70 m.
Efficient channel model calculation
The traffic volume of the two lanes is 2000 veh./h, so the traffic volume of each road is 1000 veh./h. According to the survey analysis of the accident after the vehicle transit time required for 3–5 s, takes 4 s. When the front distance is greater than 4 s, it allows the vehicle to change

When the front distance is greater than 6 s, it allows two vehicles to change

When the front distance is greater than 8 s, it allows three vehicles to change

When the front distance is greater than 10 s, it allows four vehicles to change

When the front distance is greater than 12 s, it allows five vehicles to change

When the front distance is in the range 4–6 s, we can pass a car

When the front distance is in the range 6–8 s, we can pass two cars

When the front distance is in the range 8–10 s, we can pass three cars

When the front distance is in the range 10–12 s, we can pass four cars

Behind the accident point 60 m is the safety of the accident warning distance, when the warning distance is 60 m, the number of vehicles can be changed for the Qchange

The t1 accident processing time is 20 min and
If the warning distance is variable x, then the numbers of changes and parking vehicles are


The delay time is divided into lane delay, parking delay, and driving delay. The delay time is 4 and 6 s. When the car nearing the warning position, the speed is 40 km/h and the speed through the accident point is 20 km/h

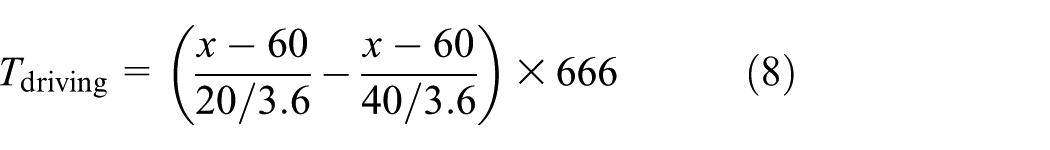
where the number of stops decreases as the warning distance becomes 7.4 – 0.04x (Figures 6 and 7 and Table 2).

Vehicle lane change, parking number, and warning distance.

Vehicle delay time and warning distance.
Early warning distance and delay schedule.

According to the data analysis, when the warning distance at 110 m, the tunnel delay time is the least.
Traffic simulation model establishment
In this simulation, the tunnel length is 5000 m, one-way two-lane, and it has the representative significance. According to the local survey of real-time data, the actual operating conditions were obtained: the average car driving speed is 60 km/h and the average truck driving speed is 40 km/h (Figure 8).

Schematic diagram of the simulated road section and accident point of highway.
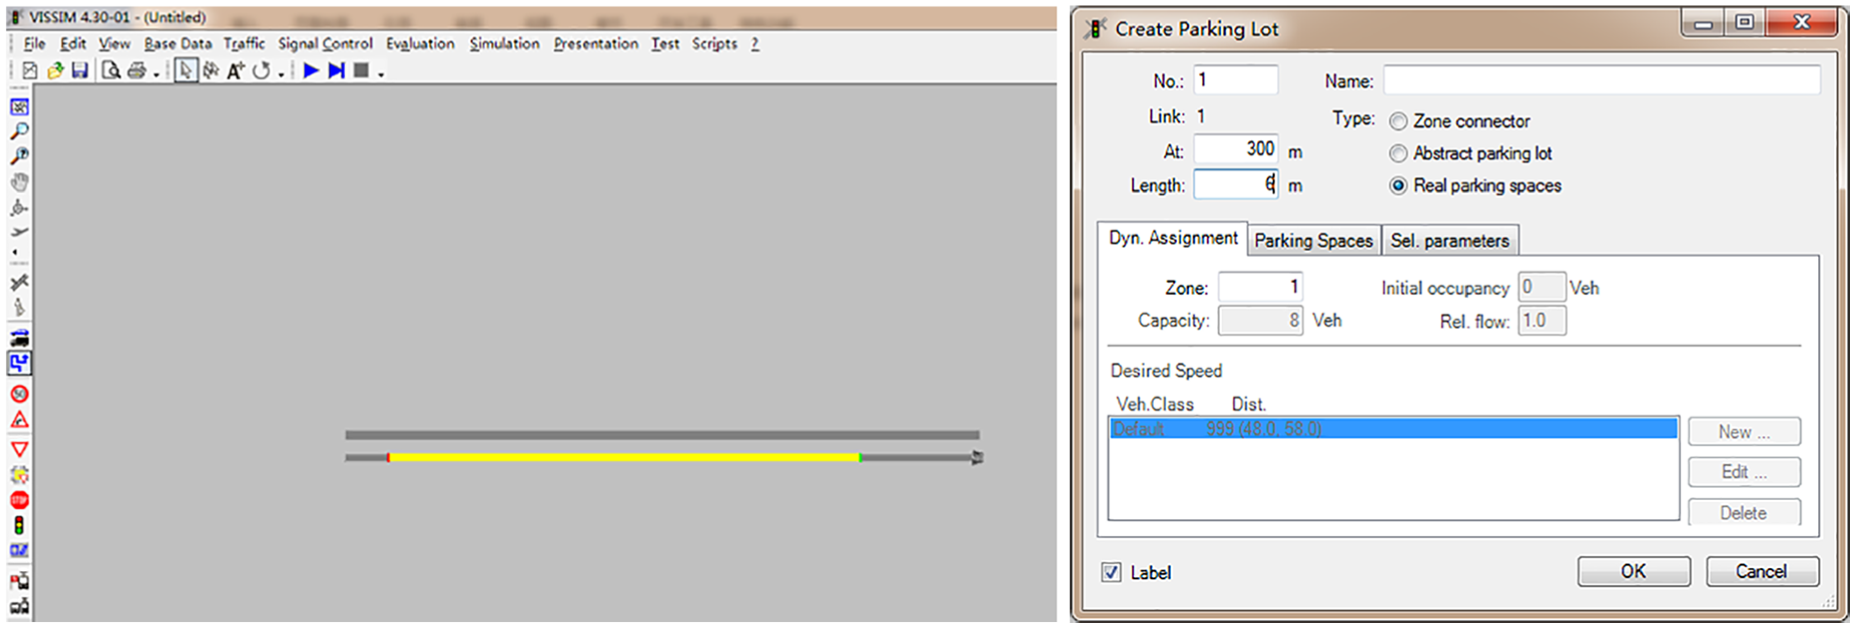
The model needs to set the parking path of the vehicle to the parking lot and define the faulty vehicle to stop for 20 min. After an accident occurs in the vehicle, the vehicle flow needs to be provided with a shorter connector as a temporary passage for the vehicle. For the highway tunnel entrance section simulation model, the simulation steps are as shown in Figures 9–11, which can be better enough simulation requirements.

Simulation parameter settings.

Road network and model ratio.
Creation of static paths and accident points.
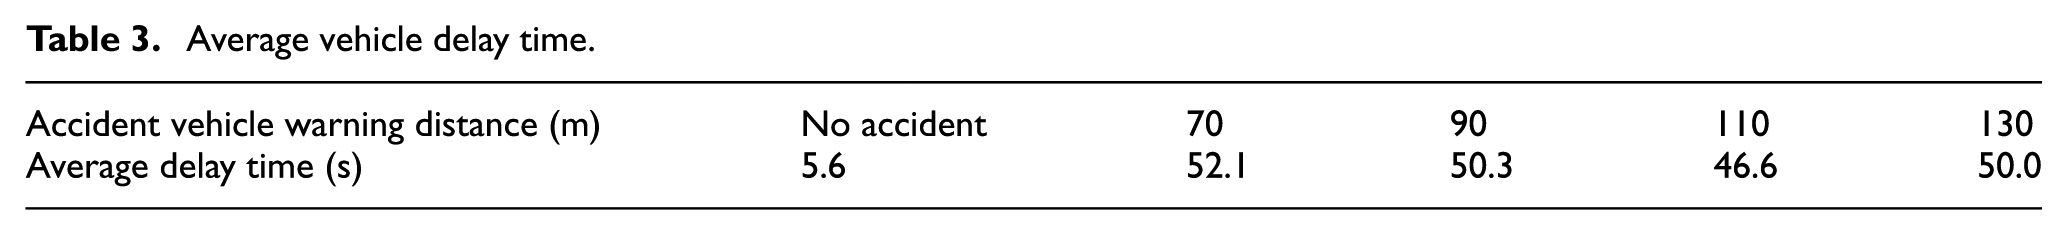
When the vehicle passes through the tunnel where the traffic accident occurs, some external factors may cause certain driving delays. In the tunnel simulation experiment, we set the delay detector in the rear of the accident car, and according to the accident car at different docking times, it can output the average delay time (Table 3). Data and charts are analyzed as shown in Figures 12 and 13.
Average vehicle delay time.

VISSIM simulation model scene.

Vehicle delay time chart.
According to the above analysis, the chart data and simulation data maps are roughly the same, and we can obtain the following conclusions: when there was an accident inside the tunnel, there was a huge impact on the traffic inside the tunnel; the length of the warning distance has an impact on the internal traffic of the tunnel; the length of the warning distance can cause congestion in the tunnel and increase the chance of accidents. Hence, choosing the correct accident warning can minimize the loss.
Conclusion
In this article, we propose a tunnel secondary accident warning model, analyze the safe operating level of the tunnel by extracting the tunnel traffic operating parameters after the accident, and then integrate the tunnel safety level coefficient into the accident safety distance model. Finally, the accident analysis was conducted based on the security warning distance, to improve the efficiency of the evacuation.
The accident safety early warning is more reasonable by considering the tunnel operating parameters, and it is more effective to analyze the accident based on the safety warning distance. The early warning model can adapt to the changing traffic operation environment. In short, the model method proposed in this article can effectively reduce traffic conflict points and vehicle delay time, and can play a good role in traffic guidance. It is recommended that the tunnel should respond in time after an accident occurs in the tunnel, to remind the driver carefully and improve the vigilance of the second accident. In addition, the tunnel should improve the detection devices to ensure traffic safety of the tunnel.
The research of the thesis can evaluate and analyze the safety level of the tunnel after the accident, determine the evaluation index system after the accident, and then select the evaluation method. Compared with the entropy weight fuzzy comprehensive evaluation system, the fuzzy-analytical hierarchy process (AHP) comprehensive evaluation system and the fuzzy multi-attribute decision-making method computations are more complicated, and the usability is inconvenient. The comprehensive evaluation of entropy weight fuzzy can evaluate the difference weight and importance weight of the index, and the comprehensive weight of each index is good. Finally, the tunnel is evaluated by the fuzzy comprehensive analysis method of entropy weight. The safety early warning model is further optimized using the tunnel safety level.
Footnotes
Acknowledgements
We are very grateful to the anonymous referees for their insightful and constructive comments and suggestions that led to an improved version of this paper.
Handling Editor: Hai Xiang Lin
Declaration of conflicting interests
The author(s) declared no potential conflicts of interest with respect to the research, authorship, and/or publication of this article.
Funding
The author(s) disclosed receipt of the following financial support for the research, authorship, and/or publication of this article: This work was supported by the National Nature Science Funding of China (No. 51468020) and Jiangxi Provincial Focus on Research and Development Projects (No. 20161BBG70080).