
Abstract
The objective of this study was to investigate how route familiarity affected drivers’ eye movement features (fixation and saccade) and driving speed when driving in the entrance zone of highway tunnels with different spatial visual conditions. On-road tests were conducted on the drivers’ visual characteristics and the speed were recorded in real time using an eye tracker and onboard diagnostic system. The variations in the eye movement features and speed in the entrance zone of the tunnels were analyzed. Then, statistical methods were conducted to examine the influence of the route familiarity and spatial visual conditions of tunnels on the driver behavior. The results demonstrated that the variations in the drivers’ eye movements and speed were much more significant in the entrance zone of a tunnel without spatial intervisibility than in a tunnel with spatial intervisibility. The impact of this environmental transition on unfamiliar drivers was greater than that on familiar drivers. Road familiarity reduced the drivers’ period of adaptation to the tunnel entrance environment and increased the driving speed.
Introduction
Road tunnels are accident-prone locations, especially at the entrance. 1 Crashes here often result in serious casualties because of the drastic environmental transition and the psychological panic drivers experience owing to the unknown traffic conditions inside the tunnel, which can affect their information perception and driving performance.
Owing to the structural complexity and limited internal space, the environment within a tunnel is quite different from that on the open road. These features of tunnels were proved to cause increased visual mental workload 2 and stress 3 associated with lower driving speeds and differences in lateral deviations (distance to the tunnel wall). 4 In a dynamic visual environment, traffic information is obtained via various senses, and approximately 90% of the information is obtained through vision. 5 Drivers need to continuously observe changes in the driving environment to extract valid traffic information. Amundsen stated that drivers’ visual features are influenced by the driving environment to a considerable extent. 6 The complex environment, especially in the tunnel entrance, causes visual difficulties for drivers owing to the drastic environmental transition, which lead to impairment of driving performance and increase likelihood of crashes. 7
There is no doubt that the closed, narrow, and low-visibility environment in tunnels significantly affects a driver’s visual performance. As drivers’ visual characteristics are internally associated with their information acquisition and decision-making abilities, controlling visual behavior is a major factor that must be considered in optimizing driver behavior and reducing crashes. Previous studies have focused on the lighting conditions in tunnel entrances on drivers’ visual behavior. 8 The equivalent luminance of the tunnel entrance has been proved to affect the physiological characteristics of drivers. 9 Other studies examined the effects of different tunnel characteristics; for example, longer tunnels have a negative effect on drivers’ concentration. 10 However, only a handful of on-road studies have provided a comparative insight into the impact of the spatial visual conditions of a tunnel on driver behavior. There is a large difference in the road alignment and illumination of spatial non-intervisible (SNI) tunnels and spatial intervisible (SI) tunnels, and the spatial visual conditions of tunnels significantly affect a driver’s visual perception, which may eventually lead to unsafe driving, especially in tunnel entrance zone. 11 When driving through a tunnel entrance zone with spatial intervisibility, drivers can identify the tunnel exit and the traffic conditions inside the tunnel before they enter it. However, some tunnels lack spatial intervisibility owing to the road alignment and tunnel design. This means drivers can only identify the traffic conditions within a limited distance after the tunnel entrances; thus, they cannot obtain much information on the interior of the tunnel and exit, which can trigger anxiety and directly affect their decision-making abilities and behavior.
A wide body of research has suggested that drivers’ route familiarity/unfamiliarity may affect both driver behavior and the likelihood of road crashes.12,13 Milliken et al. 14 found that route familiarity is a factor influencing speed choice and trade-offs between travel time and safety. The results obtained from Milliken’s study are similar to what Colonna et al. suggest about route familiarity. They performed on-road tests on a rural road over 6 days and found that route familiarity did affect the speed choice of drivers: speed increased with repeated travel on the same route. 15 Yanko and Spalek 16 conducted a simulator experiment to compare the driving performance between familiar drivers (drivers who drove on the experimental route four times before the test) and unfamiliar drivers (drivers who drove on the experimental route for first time during the test). The results demonstrated that the familiar drivers needed a longer time to respond to emergencies than unfamiliar drivers. Martens et al. found that route familiarity produced inattentional blindness, which caused performance impairment and increased crash risks. 17 This result agrees with that obtained by Young and Stanton 18 ; they reported that route familiarity decreased the mental workload, but this decrease had negative effects on driving performance.
In terms of the abovementioned factors, the tunnel features (spatial visual conditions) and route familiarity are key factors affecting driving performance and crash risk; moreover, the impacts of these two factors on driver behavior and road safety are not adequately studied in a tunnel environment. Hence, the purpose of this study was to examine the influence of the spatial visual conditions in the tunnel entrance zone on the behavior of familiar and unfamiliar drivers. For this purpose, 32 drivers familiar (or unfamiliar) with the experimental route were recruited for on-road tests in real tunnel sections of the Lan-Shang (Lantian–Shangluo) highway in Shaanxi, China. During the tests, the drivers’ eye movements (fixations and saccades) and driving speed were recorded. Then, the mean value was calculated to characterize the variations in the driver behavior in the tunnel entrance zones. The specific research questions were as follows: How do different spatial visual conditions of a tunnel affect a driver’s behavior (visual behavior and speed control) in the entrance zone? and Does route familiarity affect driving speed and visual perception?
Method
Experimental route
Typical highway tunnels (408-m Wangchuan #2 Tunnel and 4748-m Qinling Tunnel) on the Lan-Shang highway (Lantian–Shangluo section) in the Shaanxi Province were selected for the experiment. These two tunnels have different spatial visual conditions. As shown in Figures 1 and 2, the traffic conditions in the interior and at the exit of the Wangchuan #2 Tunnel can be determined before entering it. Conversely, drivers can only see the traffic conditions within 50 m at most before entering the Qinling Tunnel. In this study, the Wangchuan #2 Tunnel is the SI tunnel and the Qinling Tunnel is the SNI tunnel. Both tunnels are unidirectional with two lanes. Their geometrical dimensions and orientation are listed in Table 1.
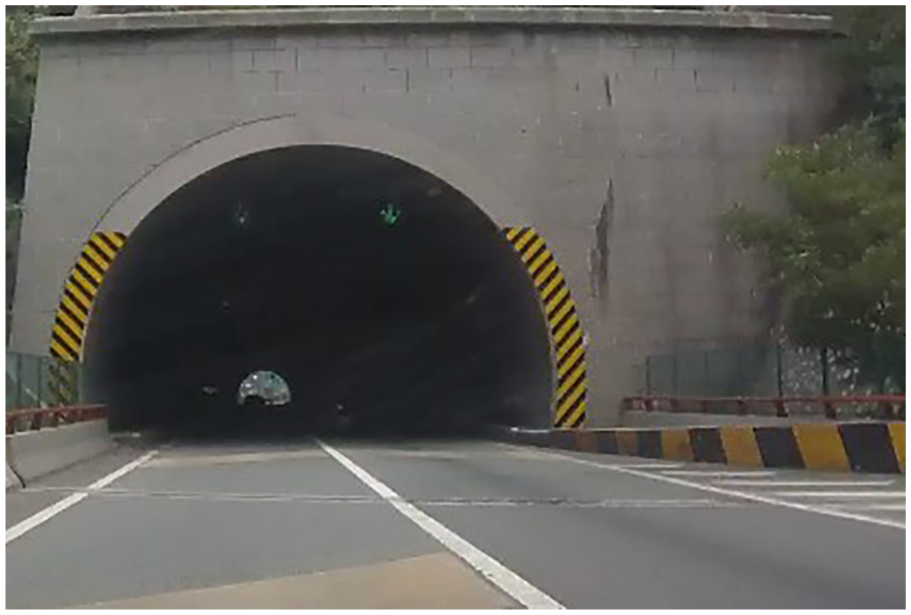
Spatial intervisible tunnel (SI tunnel).

Spatial non-intervisible tunnel (SNI tunnel).
Geometrical dimensions and orientation of tunnels.

SI: spatial intervisible; SNI: spatial non-intervisible.
The average road surface luminance was measured using the CS-200 Color and Luminance Meter produced by Konica Minolta. It can measure light from any source over a wide range of luminance levels from 0.01 to 20,000,000 cd/m2. The selectable measuring angle feature enables users to select an optimum angle of 1°, 0.2°, or 0.1° based on the application. In this study, the average road surface luminance varied in different tunnel areas: 780.11 cd/m2 for the SI tunnel access zone (300 m before the entrance), 170.11 cd/m2 for the tunnel entrance, and 90.56 cd/m2 for the transition zone (entrance to 300 m after the entrance). The respective values for the SNI tunnel were 785.05, 120.11, and 60.25 cd/m2. The speed limits within the tunnel and on the open highway were 60 and 80 km/h, respectively. On-site observation of the hourly traffic volumes indicated that the route was mainly in a free flow status. In other words, drivers could vary their speed freely based on their driving style, vehicle conditions, and road conditions, without being affected by traffic.
In accordance with the Specification of Highway Route Design (JTG D20-2006) on-road alignment, stopping sight distance, traffic volume, and design speed, the tunnel entrance zone lies between 300 m outside the tunnel entrance (access zone) and 300 m immediately after the tunnel entrance (transition zone). 19 The entrance zone contains thirty 20-m intervals, and the mean values of the variables (number of fixations, fixation duration, saccade speed, saccade amplitude, and diving speed) at each interval were calculated.
To reflect the universality of the influence of spatial visual conditions in the tunnels and route familiarity on driver behavior, excluding the effect of certain factors such as the road shape and safety facilities, the mean values of the variables including eye movements and driving speed for the Wangchuan #2 Tunnel and Qinling Tunnel in both directions (south and north) were obtained to characterize the changes at a specific interval.
Participants
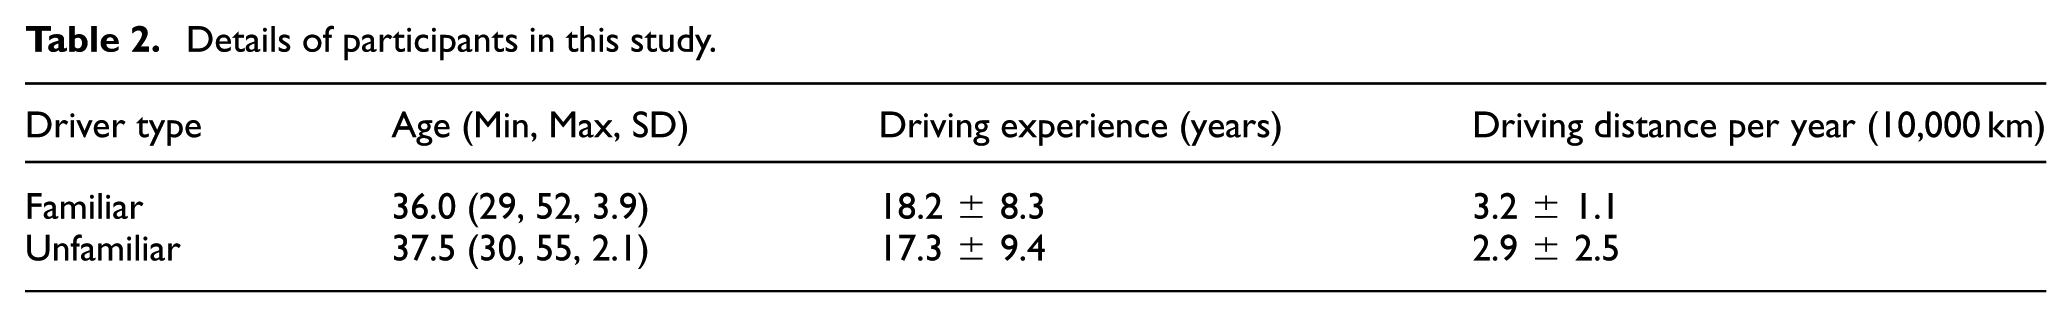
A total of 32 (16 females and 16 males) participants were recruited for this study, including 16 familiar drivers (8 females and 8 males with at least 3 years of management and driving experience along the experimental route) who were familiar with the experimental road conditions and 16 unfamiliar drivers (8 females and 8 males with no experience driving on the experimental route). No significant age differences were found between the familiar and unfamiliar drivers, p = 0.14. Detailed information of all the participants is provided in Table 2. All the participants hold a valid class C1 driver’s license. Of the 32 participants, 31 stated that they have normal vision and 1 stated that he had his vision corrected to normal vision. All the participants stated they did not take any alcohol, medication, or drugs that could impair their driving performance.
Details of participants in this study.
Apparatus
The iView X HED head-mounted eye tracking system produced by SMI in Germany, with a sampling frequency of 50/60 Hz, was used to capture eye movements (fixations and saccades). The visual feature acquisition interface is shown in Figure 3. The real-time speed was recorded using an onboard diagnostic (OBD) system and saved using single-chip microcomputer (SCM) software. All the recorded data were saved as .txt files that could be used for offline analysis. KIA Carens, a five-seater automatic transmission automobile, was used as the experimental vehicle.
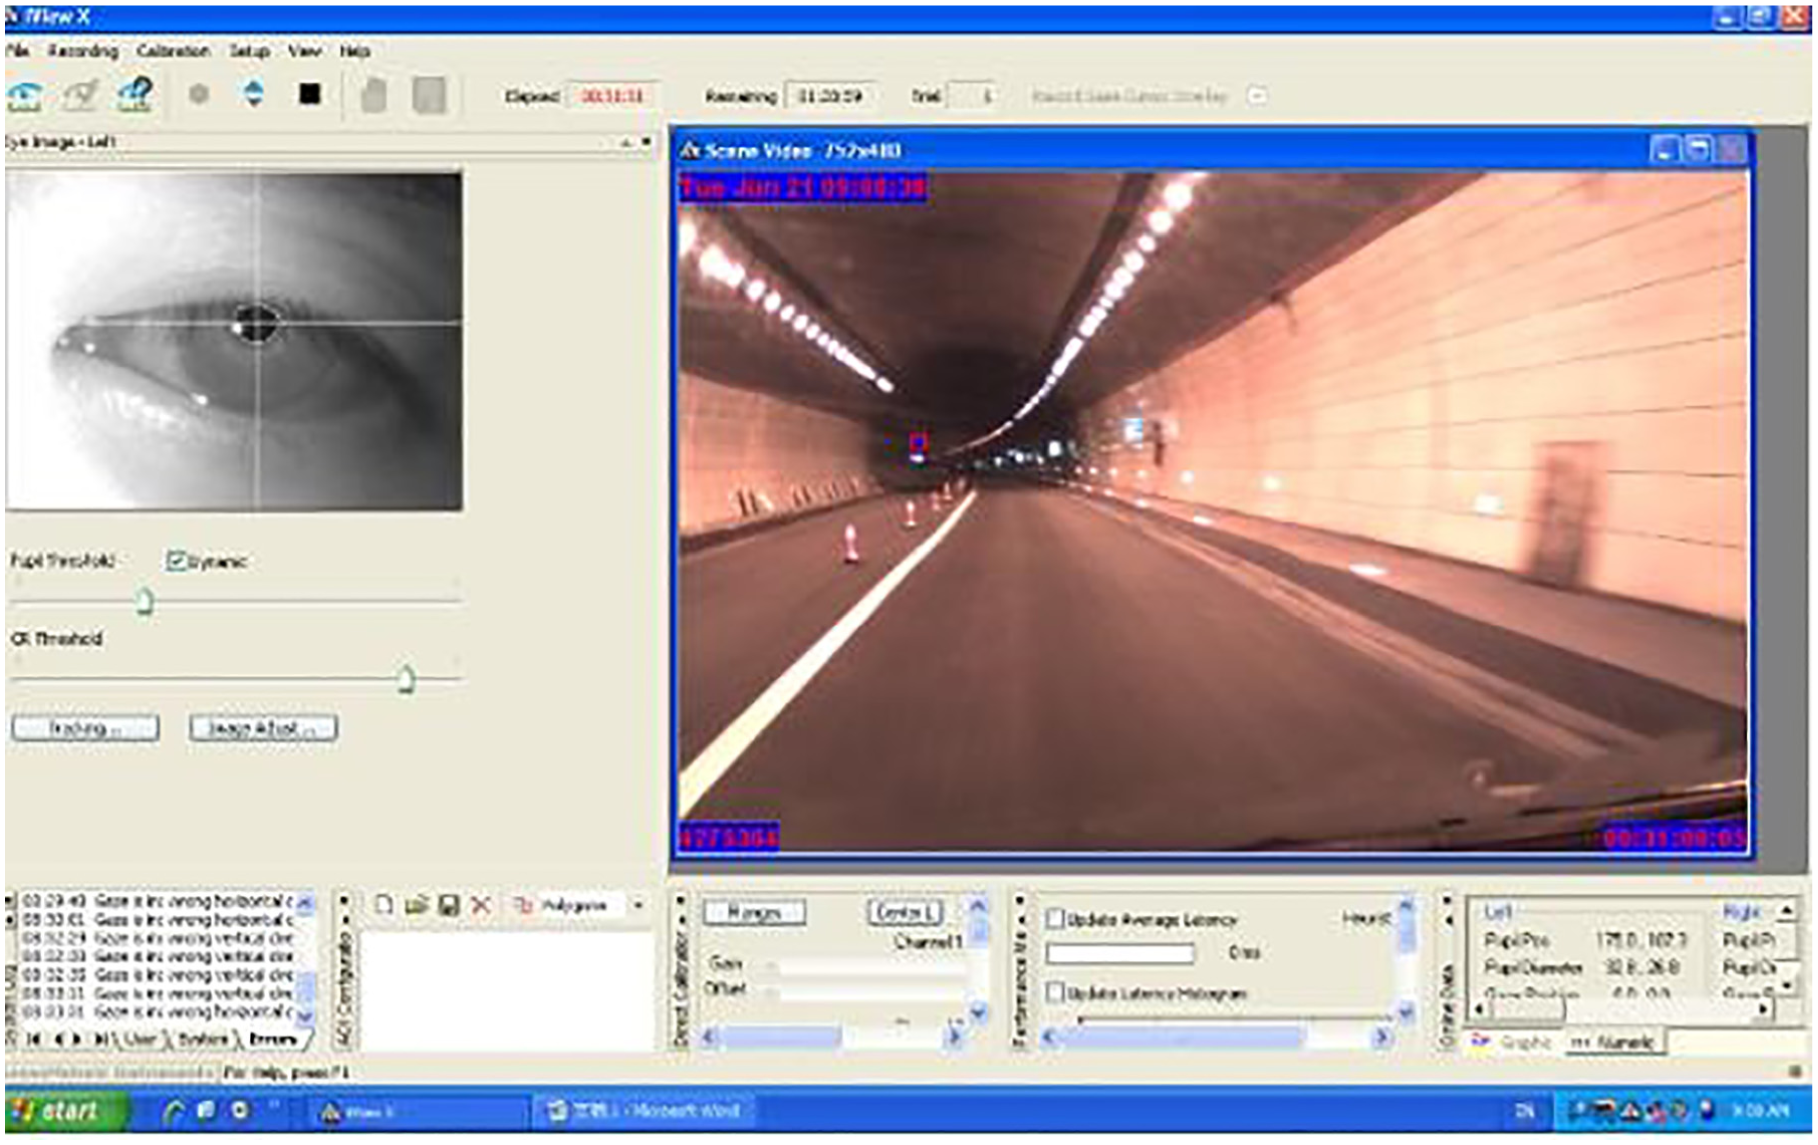
Visual feature acquisition interface.
Experiment design
The experiment used a 2 × 2 mixed design with route familiarity (familiar with the driving environment and unfamiliar with driving environment) as a between-subject factor and the spatial visual conditions (SI and SNI tunnel) as a within-subject factor. Based on the different route familiarities, the participants were divided into two distinct groups (familiar drivers vs unfamiliar drivers), with 16 participants in each group, balanced for gender (i.e. 8 females and 8 males). Participants were randomly assigned to each group according to their familiarity with the experimental route.
Experiment process
The on-road tests were conducted in the middle of July 2017 in clear weather without rain and fog. The participants were required to drive from the Wangchuan # 1 Toll Gate to the Yangxie Toll Gate between 9:00 and 10:00 a.m. and drive back to the Wangchuan #1 Toll Gate between 11:00 and 12:00 a.m. after resting. In particular, all participants drove through all tunnels with the dipped headlights on. The experimental route is shown in Figure 4. All the participants were informed of the procedure, usage of the eye tracker, and calibration of equipment before the test. After connecting the experimental equipment, the drivers were informed about the experimental route on which they were required to drive in their usual style, following the traffic signs. The participants were also allowed to give up at any time if they felt uncomfortable while driving.

Experimental route.
Results
Owing to the dark and semi-enclosed structure of tunnels, it is difficult for drivers to get much traffic information inside the tunnel before entering it, which increased drivers’ mental stress and directly influenced their behavior even before entering the tunnel. In addition, due to the effects of “dark adaptation” and flicker, when driving into the tunnel entrance in which the environment lighting alternates from light to dark, drivers’ visual features changed drastically to adapt to the environment. In this study, the ending point of dark adaption could be represented by the first stable point or the first dropping (rising) point after the minimum or maximum value of the indicators (mean number of fixations, mean fixation durations, mean saccade speed, and mean saccade amplitude) after passing through the tunnel portal. The ranges of the entrance zone in which familiar and unfamiliar drivers’ eye movement indicators were affected are given in Table 3. It can be observed that the ranges of the entrance zone in which unfamiliar drivers’ eye movement features were affected were greater than those of familiar drivers; this means that the tunnel entrance zone influenced familiar drivers to a lesser extent and owing to the familiarity with the road conditions, they were able to adapt quickly to the changing driving environment.
Ranges of the entrance zone in which familiar and unfamiliar drivers’ eye movement features were affected.

SNI: spatial non-intervisible; SI: spatial intervisible.
The negative values in the table represent the distance from current position to the tunnel entrance before entering it, while the positive values represent the distance from current position to the entrance after entering the tunnel.
Mean number of fixations
Fixation refers to maintaining visual gaze on a single location.
20
The number of fixations is defined as the total number of fixation points on an area of interest.
21
In the visual search process, the number of fixations is related to the amount of information the driver needs to process.
22
Route familiarity had a significant impact on the number of fixations (F(1, 30) = 4.705, p = 0.013, and
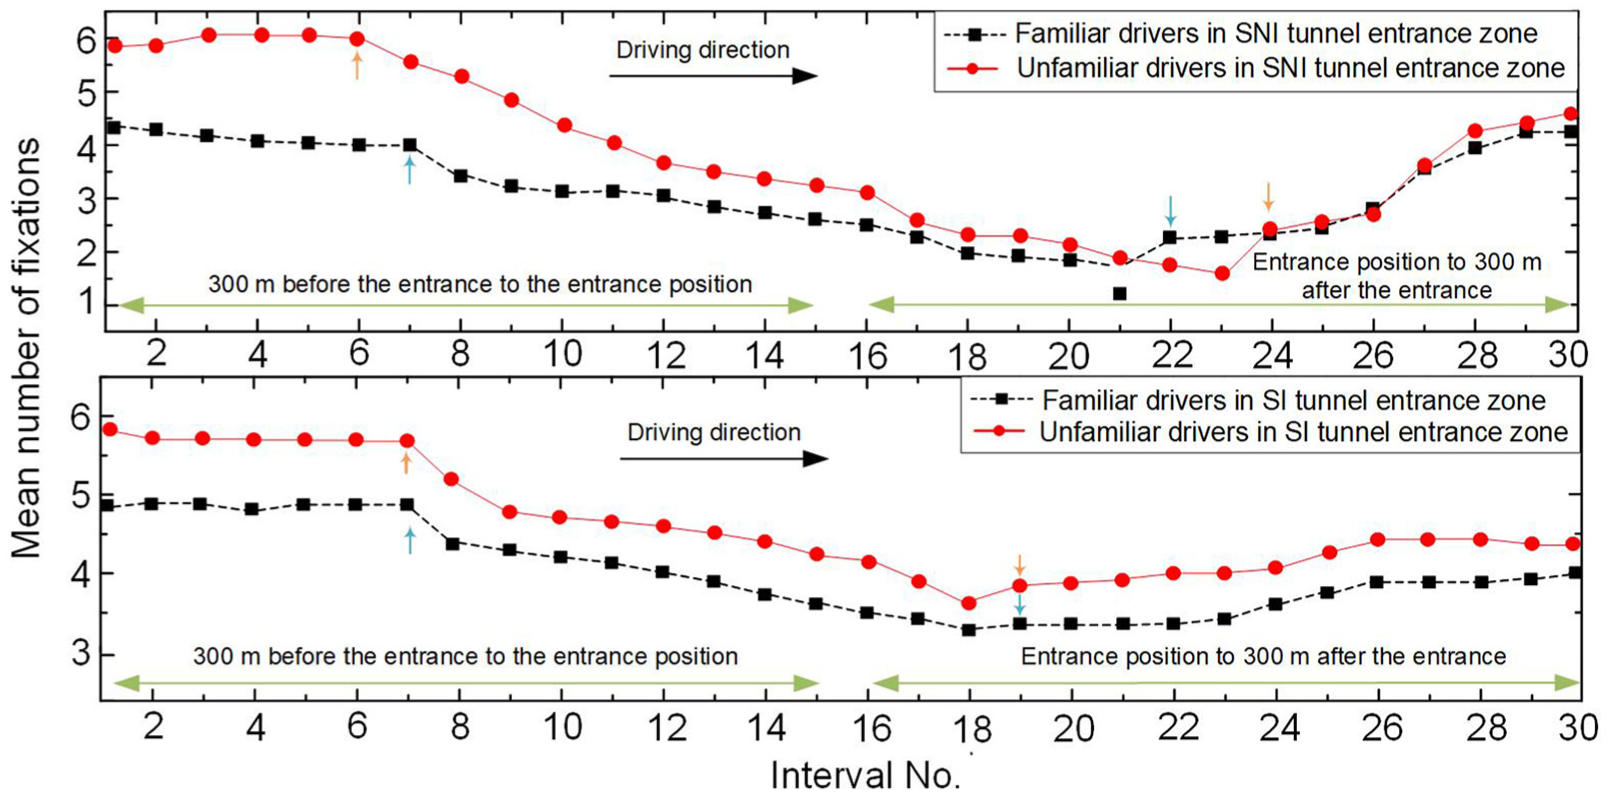
Change in drivers’ mean number of fixations.
Mean fixation duration
The duration of fixation reflects the ease of extraction of information, and it is generally believed to increase with increasing visual and mental task demands.23,24
Route familiarity had a weak effect on the fixation duration (F(1, 30) = 15.11, p = 0.052, and
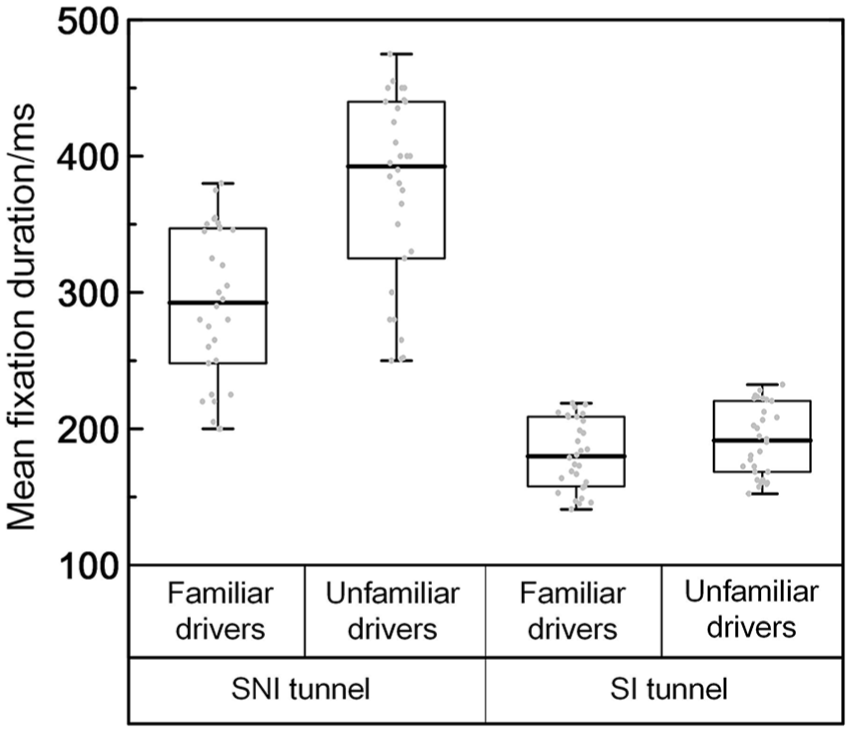
Boxplot of mean fixation duration.
Mean saccade speed
The mean saccade speed (°/s) is the average ratio of each saccade angle to its duration, which indicates the speed and efficiency of visual searching and information processing. 20 The route familiarity difference was weakly significant with F(1, 30) = 0.987, p = 0.057, η2 = 0.256, while the spatial visual conditions were not significantly different (F(1, 30) < 1, p > 0.05). The mean saccade speeds in the SNI tunnel entrance zone were smaller than those in the SI tunnel entrance zone for both types of drivers as shown in Figure 7; this indicates that the spatial visual conditions of the SNI tunnel negatively influenced the efficiency of searching and processing information. Moreover, owing to better familiarity with the driving environment, the mean saccade speeds of familiar drivers were higher than those of unfamiliar drivers in both the tunnel entrance zones. The higher saccade speed and lower fixation number of familiar drivers may indicate that they had fewer active eye movements, but the movement between each fixation was faster, which implies that because of the better familiarity with the road environment, familiar drivers knew precisely where to look for getting the needed information compared with the unfamiliar drivers showing slower eye movements but more fixations.

Mean saccade speed for familiar and unfamiliar drivers.
Mean saccade amplitude
The saccade amplitude variable (°) shows the target position of a given driver’s visual search and indicates the eye movement velocity from one fixation point to another.
25
Large saccade amplitudes mean that drivers can extract and process more information at each fixation as well as recognize more potential hazards, which is beneficial for improving traffic safety. There was a significant difference in the mean saccade amplitude between familiar and unfamiliar drivers (F(1, 30) = 23.14, p = 0.043, and
Mean speed
Route familiarity had a significant impact on the mean speed (F(1, 30) = 5.43, p = 0.028, and η2 = 0.370). The effect of the spatial visual conditions was also significant (F(1, 30) = 17.11, p = 0.001, and η2 = 0.552); the t tests showed a significant effect of route familiarity in both the SNI and SI tunnel entrances (SNI = t(30) = 2.573, p = 0.022; SI = t(30) = 2.856, p = 0.031) on the mean speed. The interaction between route familiarity and spatial visual conditions was significant (F(1, 30) = 4.11, p = 0.011, and η2 = 0.140) on the mean speed. As shown in Figure 8, because of their unfamiliarity with the road conditions, unfamiliar drivers decelerated farther from the tunnel portal than familiar drivers, exhibiting a certain degree of psychological tension. The mean speeds of the familiar drivers in both the SNI and SI tunnel entrances were higher than those of the unfamiliar drivers because of their better familiarity with the experimental route. The mean speeds in the SI tunnel were higher than those in the SNI tunnel entrance, indicating that prior knowledge on the traffic conditions inside the tunnel leads to decreases in mental stress and increases in driving speeds. Drivers may not consider the entrance zone of the SI tunnel as an area that is significantly different from an open road. Thus, drivers may decelerate less in the SI tunnel entrance zone than in the SNI tunnel entrance zone. In addition, the driving speed in both the tunnel entrances exceeded the speed limit, while increasing the crash risks in the entrance zone. Thus, mandatory decelerating countermeasures should be applied in these tunnel entrances.
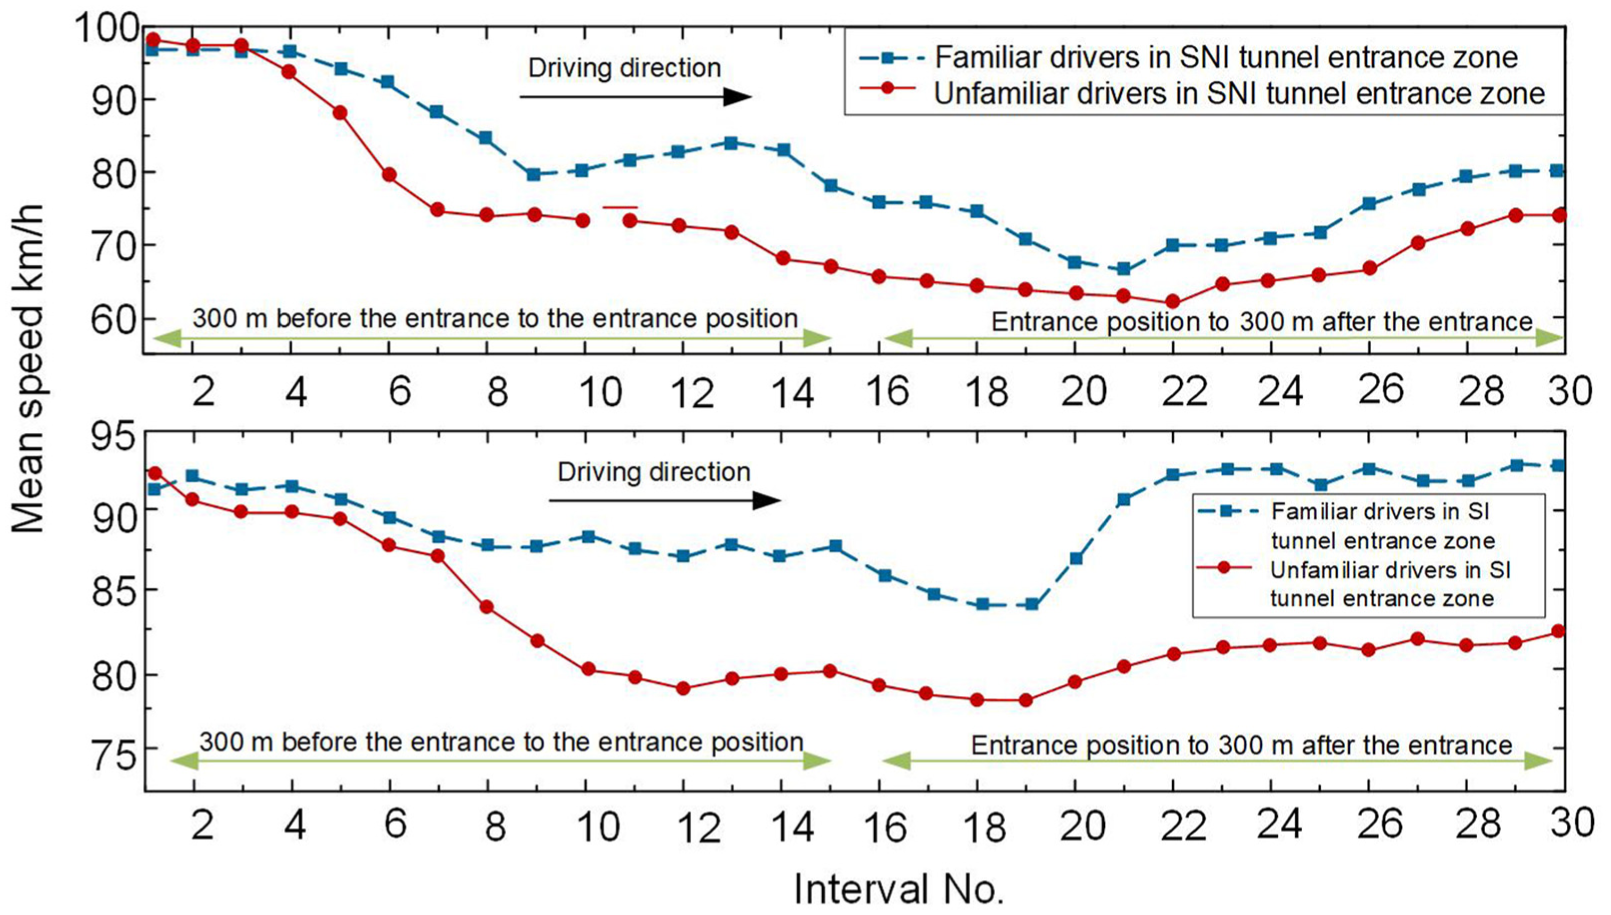
Mean speed of familiar and unfamiliar drivers at tunnel portal.
Discussion and conclusion
The purpose of this study was to determine how eye movement features and driving speed are affected by route familiarity and the spatial visual conditions in tunnel entrance zone. On-road tests at the entrance of highway tunnels were performed to determine this. Two tunnels with different spatial visual conditions in both directions were selected to conduct the tests, while eye movements and driving speeds were synchronously recorded. Finally, the means of the indicators including the number of fixations, fixation duration, saccade speed, saccade amplitude, and driving speed derived were used to characterize the variation at specific positions in the tunnel entrance zones.
The results showed that the route familiarity affected the drivers’ visual features and speed. When driving through the entrance of the tunnels, the distance over which the unfamiliar drivers’ visual features were affected was greater than that of familiar drivers. One possible explanation for this is that the latter are familiar with the environment in the experimental route and can hence extract and interpret valid traffic information more efficiently; thus, they tend to adapt more rapidly to the drastic change in environmental conditions in the tunnel entrance zone. In addition, the variations in the unfamiliar drivers’ visual indicators, such as number of fixations, fixation duration, and saccade speed, are greater and more significant than those for the familiar drivers. These results indicate that the change in environmental conditions has a lesser effect on the behavior of familiar drivers. They are familiar with the road conditions and can adjust their driving strategy in advance to adapt to the changing environment quickly. Moreover, unfamiliar drivers selected lower speeds 25 and tended to slow down farther from the tunnel portal; this implies that unfamiliar drivers are more stressed and cautious, whereas familiar drivers are more relaxed and, hence, their speed control strategy is more flexible. On the contrary, owing to their possible overconfidence regarding the road environment, it could be found that on average, familiar drivers drove faster, which is coherent with the results obtained by Colonna et al. 15 and Bertola et al.; 26 in addition, the mean speed in tunnel entrances exceeded the speed limit, which is an issue in terms of the safety levels. These results can explain why familiar drivers were more often involved in traffic crashes; the matter of crash risk related to route familiarity was considered also by Intini et al. 27
The spatial visual conditions in tunnels influenced driver behavior owing to the possible effect of lighting conditions and road alignment. The closed environment and low light levels in a tunnel entrance affected the drivers’ abilities to perceive the inside of the tunnel because it looks like a dark hole. 7 The variations in the visual characteristics and speed before and after entering the SI tunnel entrance are smaller than those before and after passing through the SNI tunnel entrance. This indicates that drivers may not consider the entrance zone of the SI tunnel as an area that is significantly different from an open road. One possible explanation for this is that unlike in SNI tunnels, drivers can perceive the exterior and interior traffic conditions of the SI tunnel before entering it. This result is similar to what found by Dai and Guo 11 in another field study. This prior knowledge of traffic conditions is helpful for drivers to adjust their driving strategy without excessive changes in the speed and visual features. Thus, the spatial visual conditions in the SI tunnel may help reduce mental stress for drivers because of the better lighting conditions and fewer visual barriers such as curves at the tunnel entrance, which is helpful for improving traffic safety.
The findings from this study offer some practical suggestions to improve tunnel safety. According to the results of this study, traditional measures such as those related to lighting at tunnel entrances could be taken to help unfamiliar drivers adapt to the dim light conditions more quickly. The fact that the ranges of the entrance zone in which familiar and unfamiliar drivers’ eye movement features were affected could provide a basis for designing the layout of the lighting facilities in tunnel entrance zones. Drivers were found to not decelerate adequately in the tunnel entrance zone, which may increase crash risks. The catastrophe points of speed in tunnel entrance zone and the value of the speed differential between two successive driving intervals could be obtained from this study, which provides a theoretical basis for the layout of deceleration facilities and an effective measurement for road design consistency. Some solutions such as particular road signs or variable message signs could assist safe driving. 28 Moreover, deceleration rules should be enforced, and drivers’ perception regarding the level of enforcement and their possible adaptation to these rules should be taken into account.29,30
Footnotes
Handling Editor: James Baldwin
Declaration of conflicting interests
The author(s) declared no potential conflicts of interest with respect to the research, authorship, and/or publication of this article.
Funding
The author(s) disclosed receipt of the following financial support for the research, authorship, and/or publication of this article: This work was funded by the National Natural Science Foundation of China (No. 51178054), Special Fund for Basic Scientific Research of Central Colleges, Chang’an University (No.310822161005), and the Science and Technology Project of Shaanxi Provincial Department of Transportation (No. 15-12K).