
Abstract
Basic rock mechanical parameters, that is, the uniaxial compressive strength σc and elastic modulus E, have close relationships with the fractal dimension and inhomogeneity. Scanning electronic microscopy and fractal dimension calculations are applied to four different rock types (mudstone, sandstone, limestone, and basalt) in order to investigate the relationships between the rock mechanical properties, fractal dimensions, and homogeneity. The results show that the fractal dimension of each rock type fluctuates as the scanning electronic microscopy magnification increases. Rocks with different uniaxial compressive strength and elastic modulus values possess different self-similarity properties, and when the uniaxial compressive strength or elastic modulus increases, the fractal dimension of the rock microstructure decreases. The rock homogeneity is consistent with the fractal dimension, that is, the higher the homogeneity is, the larger the fractal dimension. Generally, homogeneity refers to the macroscale, and fractal dimension refers to the microscale. Overall, this research provides an innovative and effective approach for researching the mechanical behavior of rocks through a combination of uniaxial compression tests, homogeneity, and fractal dimensions.
Introduction
It is generally acknowledged that rock mechanical properties are greatly influenced by rock microscopic characteristics. 1 Rock heterogeneity influences the macroscopic deformation characteristics, such as the strength, failure pattern, and rock burst proneness.2–6
The study of the fractal characteristics that are calculated from scanning electronic microscopy (SEM) imagery is an excellent method for understanding microscopic rock deformation mechanisms. In past decades, scholars have produced essential and valuable research on rock microstructures. For example, Tang and colleagues7,8 studied the influence of heterogeneity on the crack propagation and evolution of brittle materials using experimental methods and revealed that the compositional heterogeneity affects the rock failure process. Zhao et al.9,10 examined the influence of heterogeneity of rock/coal burst liability through numerical simulation. Raynaud et al. 11 analyzed the deformation process of kaolinite at both the microscopic and macroscopic scales via compression tests and X-ray tomography. The results show that the sample permeability does not significantly vary, even if the deformation is large. The above research results show that the microstructural characteristics of rocks are closely related to their macroscopic mechanical behavior.
The development of electronic microscopy and digital image processing (DIP) technology provides an effective technical method for quantitatively studying rock microstructures.12–15 For example, Tan et al. 16 examined the influence of rock microstructure on the burst tendency through SEM tests; Li et al. 17 investigated the relationship between the joint roughness coefficient and the fractal dimension of fracture surfaces; and Peng et al. 18 provided a method for calculating the fractal dimension of rock pores based on computed tomography images and found that the fractal dimension of the pore structure increases as the porosity increases.
In this article, uniaxial compression tests on four types of rocks are carried out, and the microstructures are observed and analyzed using SEM. The fractal properties are investigated, and the fractal dimension is calculated using the pixel covering method. The relationship between the strength, homogeneity, and microstructural fractal characteristics is examined. The connection between the homogeneity and fractal dimension and the influence of the microstructures on the macroscopic failure patterns are analyzed.
Experimental and fractal methodology
Uniaxial compression tests
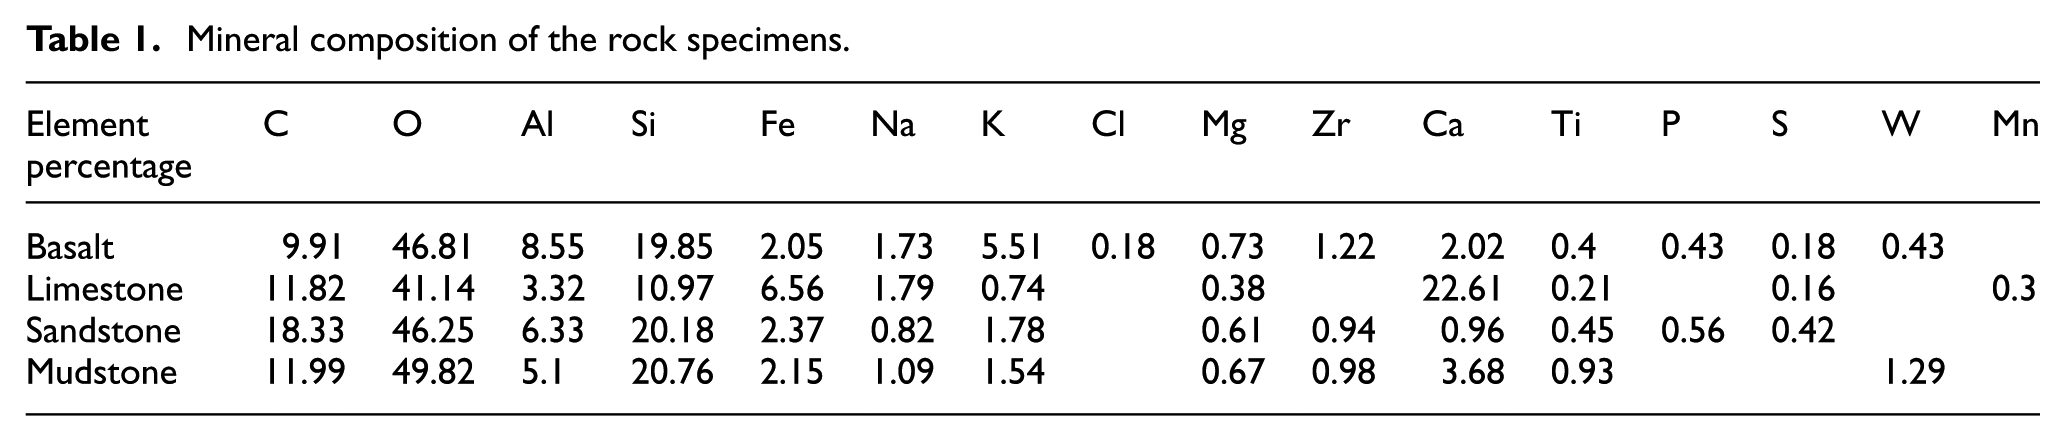
Rock specimens are taken from the Xinwen Coal Mining Group (Figure 1), which is located in Xintai, Shandong Province, China. This mining group contains several coalmines, including the Sunchun Coal Mine, E’zhuang Coal Mine, Xiezhuang Coal Mine, and so on. The average mining depth is greater than 1000 m, and the geological structure is complicated. The surrounding rock is composed of various types of sandstone, limestone, mudstone, and basalt. The composition of the four types of rocks is shown in Table 1. All four types of rocks were tested in this investigation.
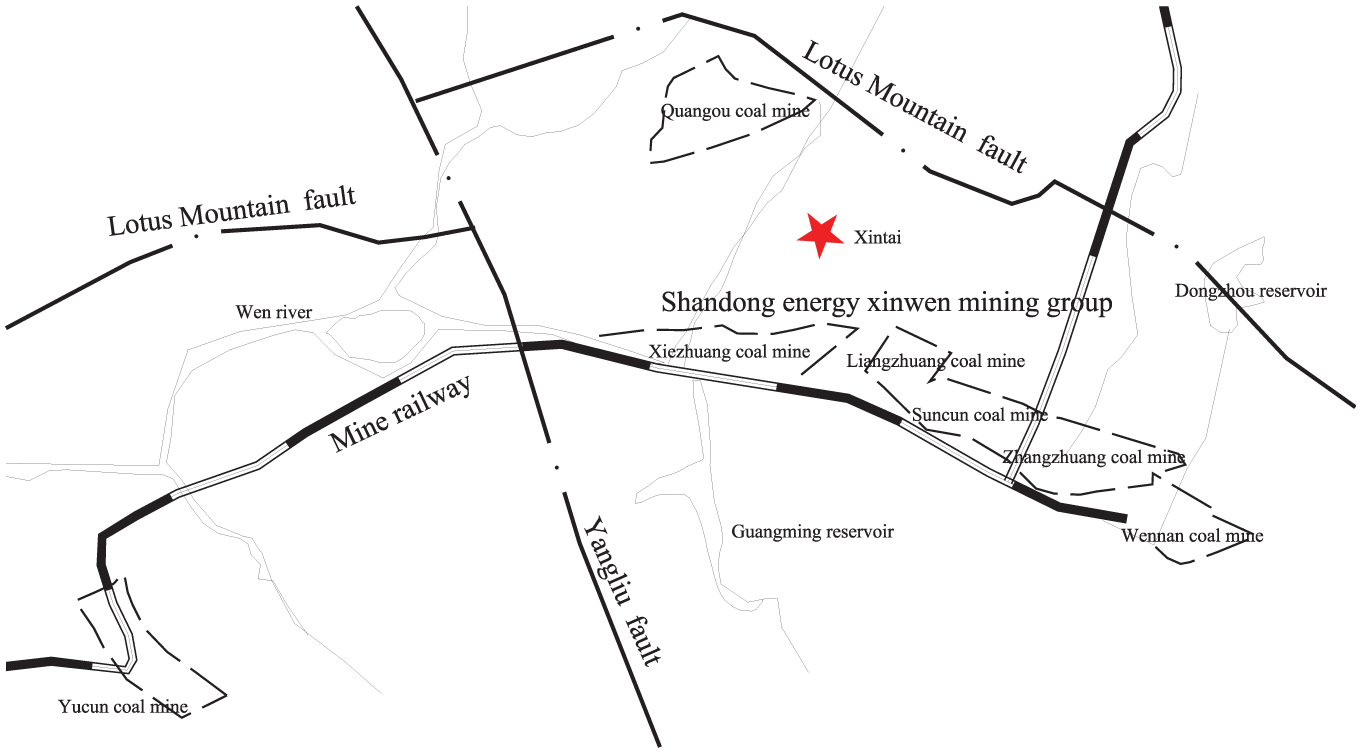
Location of the rock samples in the Xinwen mining group, Shandong Province, China.
Mineral composition of the rock specimens.
First, the rock lithology is identified by the means of a polarizer. The four typical rock types, that is, sandstone, mudstone, limestone, and basalt, are examined using uniaxial compression testing. Cylindrical rock specimens are prepared with a diameter (D) of 50 mm and a height (H) of 100 mm. Ten standard cylinder specimens are prepared for each rock type. The test specimens with an approximate length–diameter ratio of 2 were carefully prepared following the stipulations of the American Society for Testing and Materials (ASTM 2001), and specimen end faces were lubricated before testing. Uniaxial compression tests are conducted using the MTS815.03 hydraulic servo-control testing machine in Shandong University of Science and Technology. The uniaxial compression test is the standard test for obtaining the uniaxial compressive strength (UCS), the elastic modulus (E), and Poisson’s coefficient (ν). The loading rate is 5 mm/min under the displacement control, and the maximum axial load of the apparatus is 2600 kN.
SEM imagery
The rock microstructures are examined using SEM (Figure 2). A focused electron beam scans the specimen point-by-point via scanning coils. Secondary electrons are produced by the electron bombardment and collected by the detector. 19 The image that is composed of the secondary electron signals is called a secondary electron image (SEI). An SEI is the most commonly used SEM imagery and produces a grayscale images in which the gray values represent the intensity of the SEI signal. Secondary electronic signals are commonly emitted at a depth of 5–10 nm below the sample surface and are sensitive to the surface morphology. Such an SEM image contains abundant surface information. The scanning device is a JSM-6510 electronic microscope manufactured by JEOL with a high and low vacuum. SEM operation consists of pulling a vacuum, focusing the image, and automatically collecting the image. The acceleration voltage determines the energy or wavelength of the incident electrons.

Schematic of the SEM setup.
The thin sections are 1 cm2 in area and 1 cm thick. The thin sections were polished and cleaned using ethanol and an ultrasonic cleaning instrument. All thin sections were dried in an oven and coated with gold to provide a conductive surface. The coating is commonly 8–10 mm thick. The electronic gun is vertical to the sample holder. The SEI of the fracture surfaces has a resolution of 6 nm at a 15–20 kV accelerating voltage and a working distance of 10–20 mm. The images are captured for all regions of the sample surface and combined to produce an SEM image of the complete microstructure. To extract the microstructural information of the rock samples, first, the region of interest needs to be extracted from the SEM image, which can be extracted using the gray level adjustment of the image, the detected feature, border recognition, and other processes. Then, the region of interest is converted into a black and white image through binarization processing. These processes are performed in MATLAB. To obtain the fractal dimension of a rock fracture surface, the SEM images of the four rock types are captured, and fractal analysis is performed.
Box-counting approach for fractal dimension
Fractals in geomechanics
Fractal geometry, which was proposed by Mandelbrot, 20 is widely used in image analysis.17,21 The noninteger fractal dimension of a geometric entity can represent its irregularities. Rock is a complex porous material with a complex surface morphology and a heterogeneous macroscopic structure. Previous studies, however, have proved that the structures, joints, and morphologies of rocks have geometrical self-similarity. 22 That is, the rock surface possesses fractal characteristics. In addition, the self-similar properties of rock repeat with continuous magnification.
The development of rock mechanics is closely related to fractal and damage mechanics. Fractures in rocks or rock masses lead to fractal structures with microscopic to macroscopic scales. Thus, the fractal can be used to quantitatively describe complex rock structures, and the fractal dimension is an effective method to describe the self-similarity of rock structures.22–25
There are numerous methods for calculating the fractal dimension, such as the Hausdorff dimension, the box-counting dimension, the similarity dimension, the capacity dimension, the correlation dimension, and the information dimension.26–28 In this study, the box-counting dimension is used. The calculation is as follows
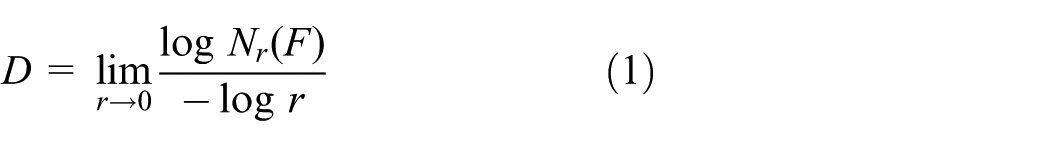
where
Various fractal techniques are widely used to quantify complex rock structures, particularly at different scales. Inhomogeneity and anisotropy were analyzed in Kruhl. 29 Fractal theory was used to develop more reliable methods for rock mass characterization. 30 Field studies have been carried out on dolomite, limestone, fluorite, sandstone, and shale rock types in open pit coalmines and a rock mass classification based on fractal geometry was suggested. 31 Dyskin 24 also conducted a study modeling geological phenomena in the earth’s crust using the concept of continuum fractal mechanics.
The box-counting approach for fractal dimension
The box-counting approach is adopted to calculate the fractal dimensions of rock microstructures. 32 The SEM images are processed into binary images using MATLAB. The images can be analyzed as a data file where each pixel is black or white, and the rows and columns of the data file correspond to the ranks of the binary image. Here, each data value is 1 or 0, depending on if the corresponding point is black or white, respectively. The data file is divided into several boxes with the rows and columns using index k. Each box that contains a 1 is marked as N(δk). Subsequently, different N(δk)s are obtained by changing the length of the box (k = 1, 2, 4,…, 2i). By considering δ as one pixel, the length of each box can be represented kδ. A diagram of log N(δk)–log kδ is determined using the least square method, and the absolute value of the slope of the line is the fractal dimension of the image. 20 The calculation procedure using MATLAB is shown in Figure 3.10,19

Calculation procedure for the fractal dimension using MATLAB.
Test results analysis
Strength
The four rock types (mudstone, sandstone, limestone, and basalt) are located at a depth of approximately 1000 m. Uniaxial compression tests are carried out to obtain the UCS (σc), elastic modulus (E), and Poisson’s ratio (ν). The results are listed in Table 2. A photo of the samples is given in Figure 4, and some of the stress–strain curves of the tested rocks are given in Figure 5. The average UCS of mudstone, sandstone, limestone, and basalt are 21.70, 53.04, 82.03, and 110.53 MPa, respectively, and the elastic moduli are 4.57, 8.98, 12.58, and 27.67 GPa. The dispersion between the Max and Min results (UCS, E, and ν) might be caused by the size, density, porosity, and other micro factors of the rock particles. The average value is used to improve the correction. It can be seen that the uniaxial strength of basalt is higher than that of the other rock types. In addition, the elastic modulus E increases along with the uniaxial strength in all four rock types. Poisson’s ratio shows no obvious systematic variations.
Summary of the experimental results.

Min: minimum value; Max: maximum value; Aver: average value; St dev: standard deviation.

A photo of the samples: (a) mudstone, (b) sandstone, (c) limestone, and (d) basalt.

The stress–strain curve of tested rocks (two samples of each type of rock): (a) mudstone-1, (b) mudstone-2, (c) sandstone-1, (d) sandstone-2, (e) limestone-1, (f) limestone-2, (g) basalt-1, and (h) basalt-2.
SEM image analysis
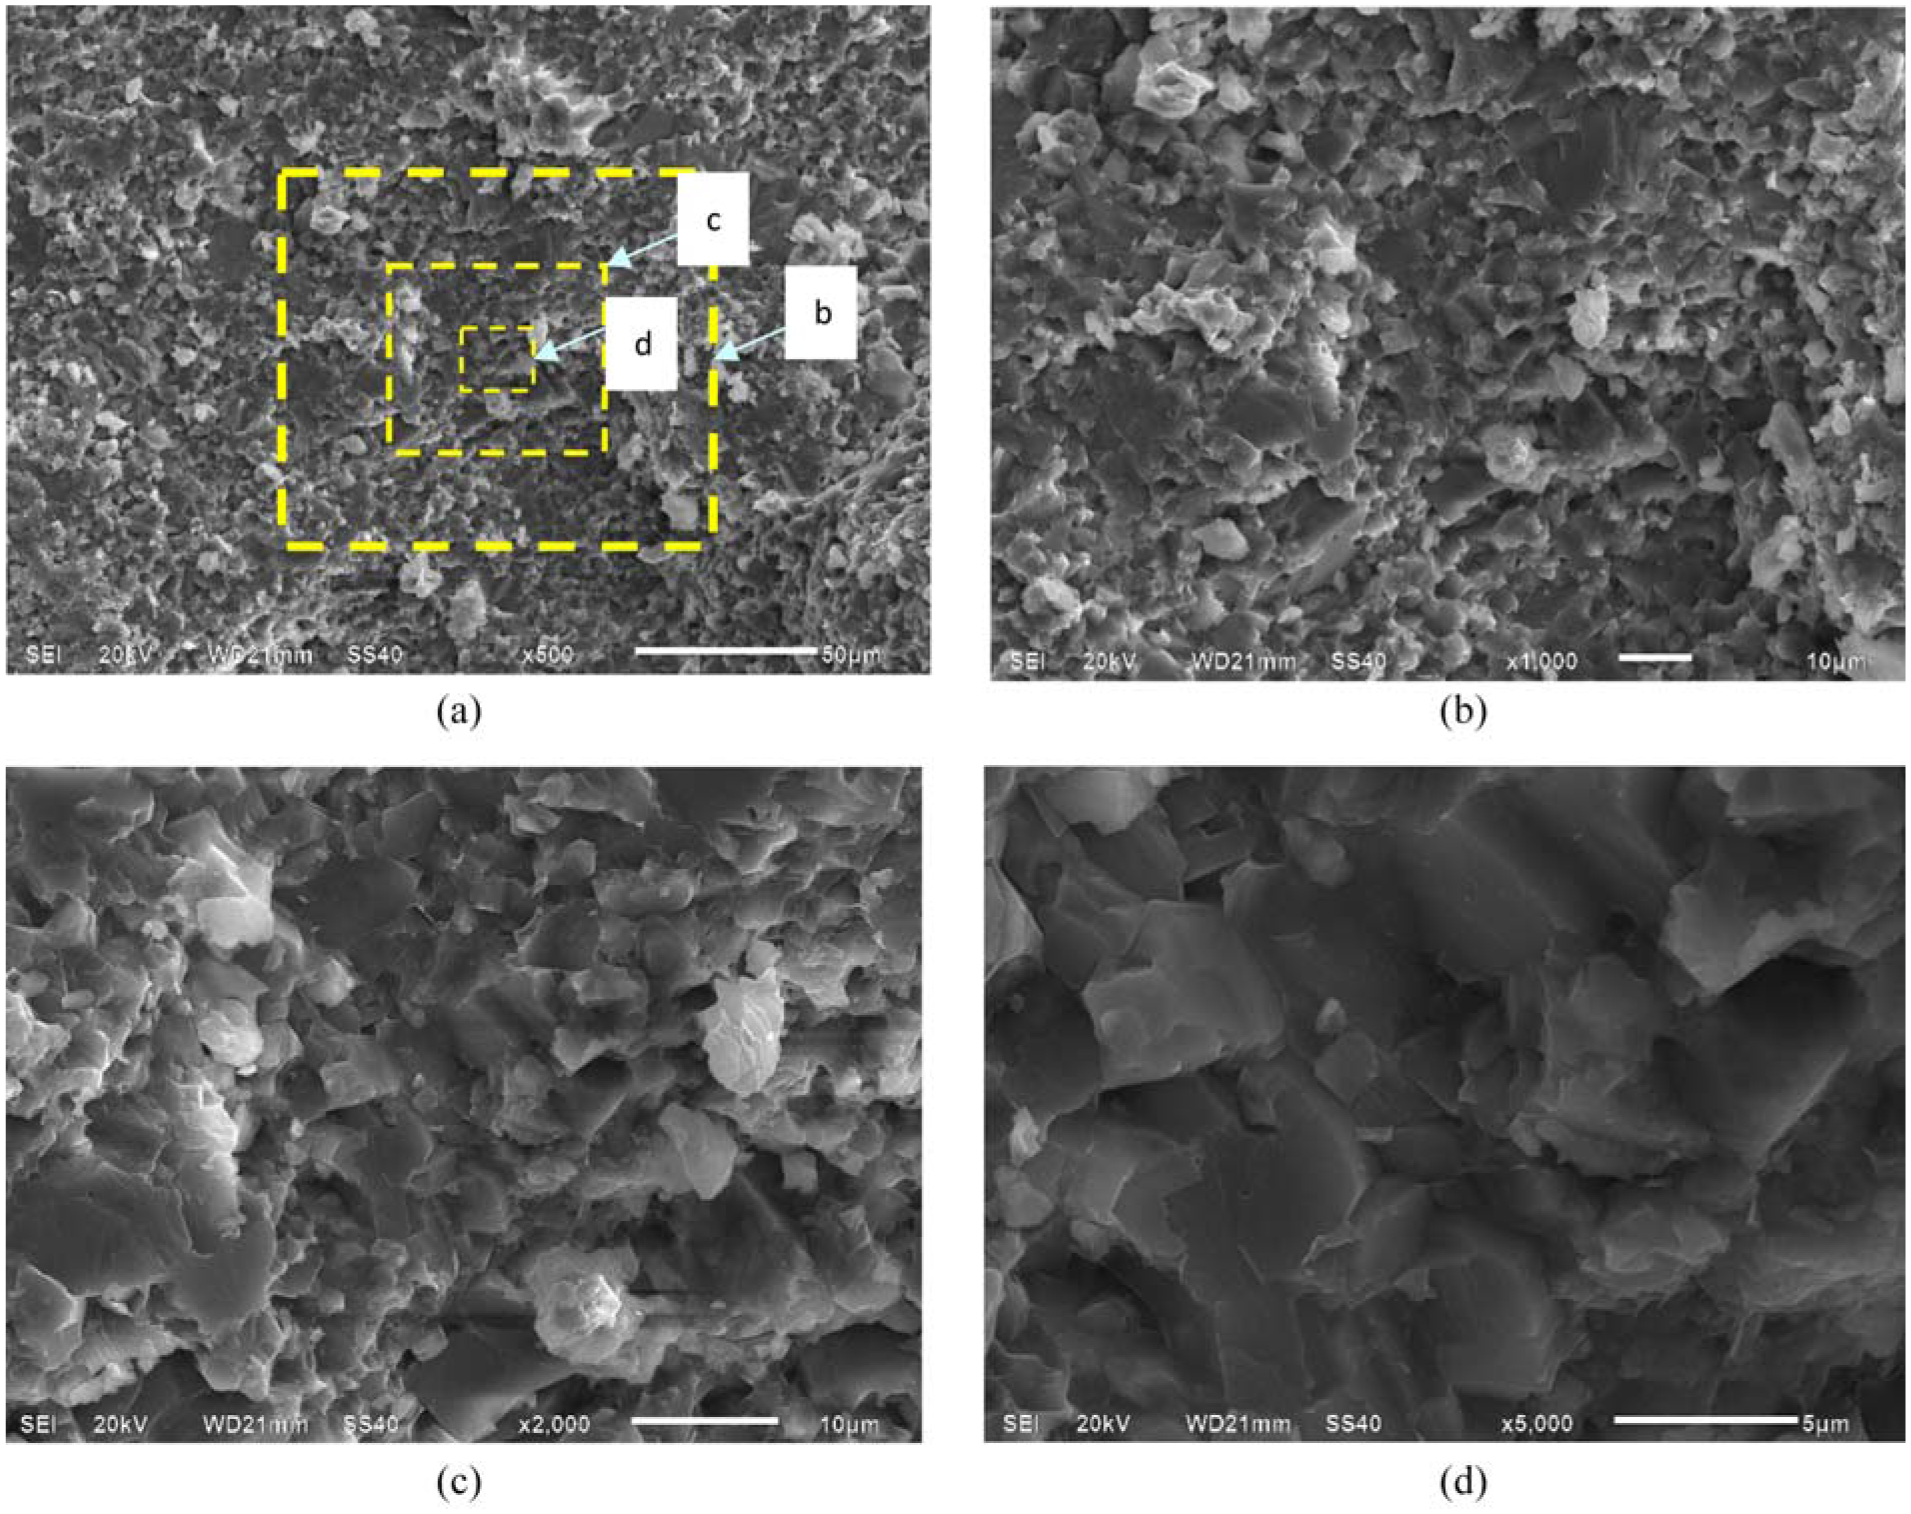
To study the different rock structural profiles, SEM images of the rock structures of the four types of rocks are obtained using fragments from uniaxial compression tests. The images for each sample are obtained at four scales: ×500, ×1000, ×2000, and ×5000. The SEM images of the various rock types at different magnifications are shown in Figures 6–9. The brightness variation is caused by the uneven surface of the samples and results in inconsistency in the electron reflection intensity. These observations are directly related to the changes in the microstructure.
SEM images of mudstone at different magnifications: (a) ×500, (b) ×1000, (c) ×2000, and (d) ×5000.

SEM images of sandstone at different magnifications: (a) ×500, (b) ×1000, (c) ×2000, and (d) ×5000.

SEM images of limestone at different magnifications: (a) ×500, (b) ×1000, (c) ×2000, and (d) ×5000.

SEM images of basalt at different magnifications: (a) ×500, (b) ×1000, (c) ×2000, and (d) ×5000.
The SEM images indicate that pores and cracks are pervasive in these specimens and have circular, rectangular, and other irregular shapes. The pores range in size from 5 to 200 nm and form in various interconnected patterns.
Of the four rock types, the mudstone presents an irregular structure overall. The pores mainly exist in the particles with poor structural integrity, and fractures are regularly distributed. The particles of sandstone have different cementing forms whose surfaces are rather loose with more secondary voids. Meanwhile, there are more fractures and joints in sandstone than in mudstone. The pores in limestone and basalt are dispersed. The cracks and pores in limestone display an irregular pattern, and small particles fill the voids in large particles. The voids between basalt particles are smaller than those in limestone, and basalt is relatively dense. Cementation leads to pore reductions during deposition. Increased strength is related to internal changes in the microscopic structure.
Inhomogeneity
Rock heterogeneity influences the rock macromechanical behaviors such as the crack initiation and crack propagation. DIP technology can quantitatively describe rock heterogeneity. 33 The procedure can be described as follows. First, the feature extraction of the rock profile is obtained; then, the quantities of individual minerals and the shapes of the mineral grains are analyzed; and finally, the rock homogeneity coefficient is obtained. 34
A Weibull distribution is suitable for describing the distribution of the mechanical parameters of the rocks.35,36 The coefficient of the rock homogeneity, m, is adopted using the Weibull function. The function is as follows30,37
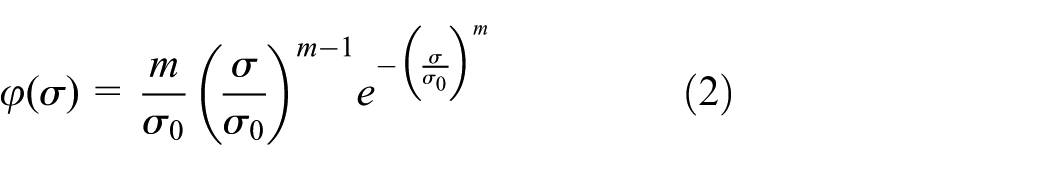
where
To calculate the homogeneity coefficient, first, the probability density distribution curve of the UCS is fitted based on many uniaxial compression tests, which follows Tang et al. 8 Then, according to the hypothesis that the heterogeneity in the rock strength causes progressive failure behavior, a Weibull distribution, which is defined by equation (2), is used to calculate the homogeneity. Using the DIP method and equation (2), the homogeneity coefficient (m) for all specimens is obtained (Table 3). The average values of m are 7.8, 5.9, 4.4, and 3.2 for mudstone, sandstone, limestone, and basalt, respectively. The homogeneity coefficients of mudstone and sandstone are larger than those of limestone and basalt.
Homogeneity coefficient values for mudstone, sandstone, limestone, and basalt.

Min: minimum value; Max: maximum value; Aver: average value; St dev: standard deviation.
Fractal dimension obtained from SEM imagery
The fractal dimension can reflect the structure and the homogeneity of a rock. In this study, the box-counting method for the fractal dimension is performed (Figure 3). Following the methodology described in section “Experimental and fractal methodology,” the fractal dimension and correlation coefficient of the four rock types are calculated. The results for representative specimens of each rock type are listed in Table 4. The results include the values of the fractal dimension (Dc) and correlation coefficient (CC) under different magnifications. The average fractal dimensions of the four rock types are 2.14, 2.06, 1.78, and 1.66, respectively. The CC values are the lowest for basalt.
Fitting results of fractal dimension for different magnifications.

CC: correlation coefficient.
Figure 10 shows the fitting curves for the sandstone specimens at different magnifications. Figure 11 summarizes the values of the fractal dimension for the four rock types at different magnifications. With increasing magnification, the fractal dimension fluctuates for each rock type.
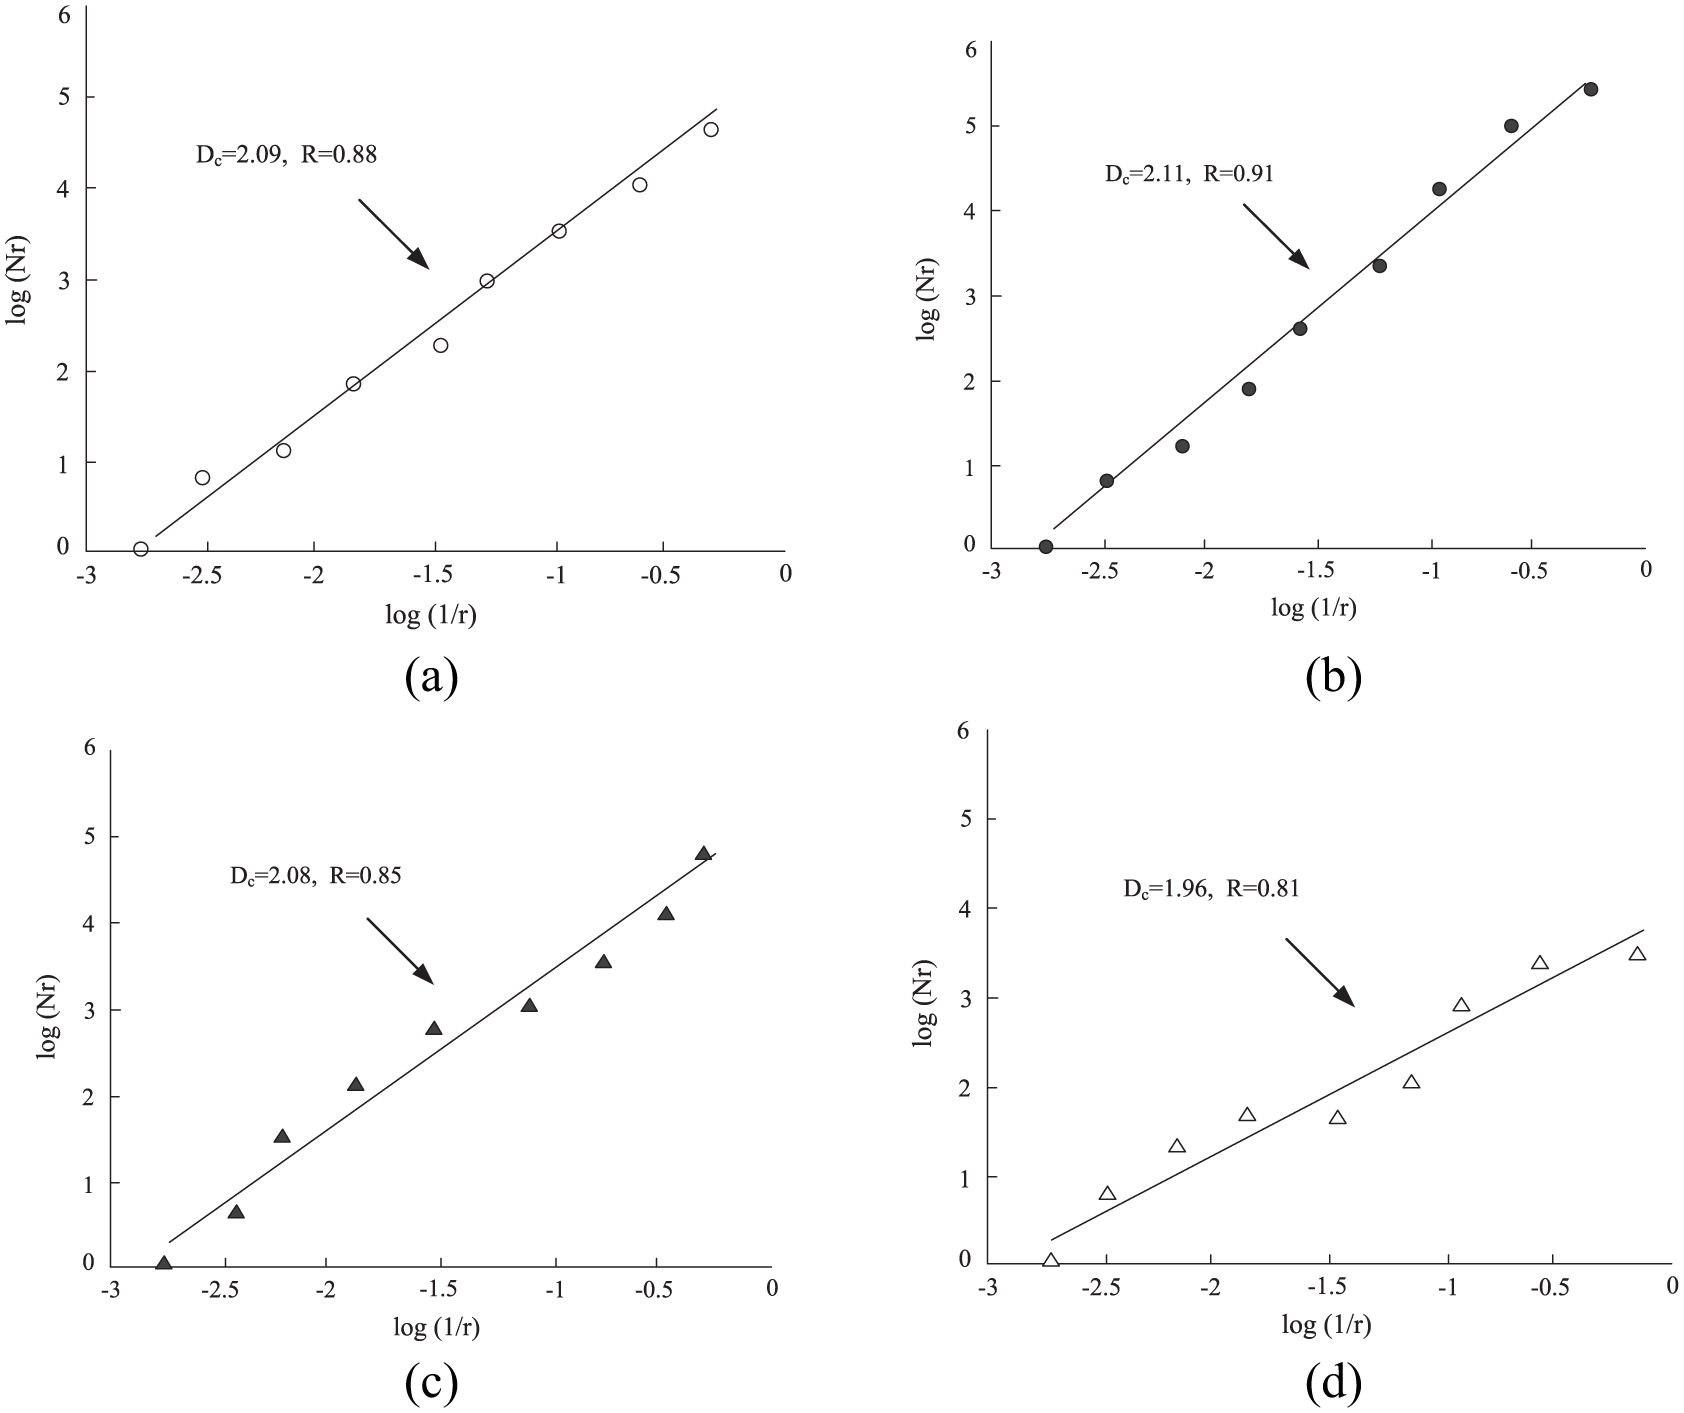
Best-fit Dc curves for sandstone at different magnifications: (a) ×500, (b) ×1000, (c) ×2000, and (d) ×5000.

Variation of Dc with the magnification.
The fractal dimension that is calculated using the box-counting method varies as the magnification increases. For mudstone and sandstone, their fractal dimensions increase as the magnification increases from 500 to 1000, followed by decreasing trends (Figure 11). When the magnification is 500, the fractal dimensions of mudstone and sandstone are 2.13 and 2.09, respectively, and when the magnification increases to 1000, the fractal dimensions increase to 2.19 and 2.11. Above a magnification of 1000, the fractal dimension decreases. For mudstone and sandstone, the fractal dimensions are 2.14 and 2.08 at a magnification of 2000, respectively, and are 2.09 and 1.96 at a magnification of 5000. From Figure 11, it is shown that limestone and basalt have the opposite trend to mudstone and sandstone. The fractal dimensions of limestone and basalt decrease as the magnification increases from 500 to 1000, and above a magnification of 1000, the fractal dimensions increase.
The results show that the CC and fractal dimension have similar variations with increasing magnification, thereby demonstrating that the magnification has an important influence on the self-similarity of the rock structures. Rocks with different lithologies have different fractal dimensions at various magnifications. Typical mudstone and sandstone have high suitability, and limestone and basalt have low suitability. This result demonstrates that the suitability of the fractal dimension description method for rocks depends on both the lithology and magnification.
Discussions on microstructure and macromechanical properties
Rock is composed of different mineral particles and various cemented materials and commonly contains numerous cracks, pores, and microstructures. These mineral particles form various morphologies and components. Therefore, the macrostructure mechanical behavior is closely related to the microstructure. In this section, the relationship between the microstructure and macromechanical properties is investigated.
The distribution of microstructures has a significant influence on the degree of self-similarity and heterogeneity within a rock. Mudstone and sandstone have UCS and elastic modulus values that are much lower than those of limestone and basalt. Mudstone and sandstone have a more complex structure accompanied with a relatively loose granular structure and poor cementation. There are some small holes with a honeycomb or reticulate structure, as well as some secondary porosity; however, the crack growth is uniform, thereby resulting in a higher degree of self-similarity and better homogeneity. The crystal structures of limestone and basalt are quite compact, with fewer pores and cracks, more regular cementation, and a clearer bedding structure development, which indicates higher strength. The basalt and limestone surfaces are uneven, which leads to poor surface homogeneity. The poorly homogeneous structure also results in lower self-similarity. Note that the structures of the four rock types differently vary based on their varying burial conditions.
To study the relationships between the rock structures and macroscopic mechanical behavior, a comparative analysis of the UCS, elastic modulus, homogeneity coefficient, and fractal dimension is conducted for each rock type (Figure 12). The average values for each rock type at all amplifications are considered. The results show that the fractal dimension and rock homogeneity have a linear positive correlation. The UCS and elastic modulus are negatively correlated with the fractal dimension.

Graph showing the UCS, E, and homogeneity coefficient versus the fractal dimension.
Moreover, there are numerous uniformly distributed cracks in the mudstone and sandstone. The mudstone and sandstone have better homogeneity, more self-similarity, and larger fractal dimensions compared to limestone and basalt. Their deformation speed increases under an external load. When the local stress exceeds the rock strength, cracks are produced. Due to the high homogeneity, the cracks grow uniformly, which will cause a chain reaction and further continue creating damage until macrocracks form. The rock experiences brittle failure in a short period of time, thus leading to the destruction and instability of the rock. Conversely, the strength of limestone and basalt is larger, and they have fewer microfractures, which leads to lower homogeneity, less self-similarity, and smaller fractal dimensions. The deformation speeds for limestone and basalt are slower than those for mudstone and sandstone under external loads. Crack initiation and propagation are much slower, which indicates that the rocks experience brittle failures after a longer amount of time. This trend is also consistent with the UCS.
The fractal dimension measures the self-similarity of the rock structure at different scales. Therefore, the fractal dimension that is calculated from the SEM images of rock can provide a complementary parameter for studying rock failures, and the analysis of the fractal dimension may be used to compensate for the deficiency between micro and macro scales. However, the calculation of the fractal dimension is only suitable for the rock structures with high self-similarity. Therefore, a future research topic will be to choose a fractal dimension that solves rock mechanical problems with respect to the microstructure.
Conclusion
To better understand the influence of the microstructure on the macromechanics of rocks, four typical rock types, that is, mudstone, sandstone, limestone, and basalt, are examined using uniaxial compression tests, SEM imagery, and fractal dimensions. The main conclusions are as follows:
The rock structural self-similarity varies with the SEM magnification. As the magnification increases, the different rock types have different fractal dimensions. Thus, it is suitable to describe rock material using the fractal dimension. However, the fractal dimension values fluctuate. Therefore, it is also suitable to describe rock material using the mean fractal dimension.
Rocks with higher UCS have smaller fractal dimensions. The average UCS of mudstone, sandstone, limestone, and basalt are 21.70, 53.04, 82.03, and 110.53 MPa, respectively, while their related fractal dimensions are 2.14, 2.06, 1.78, and 1.66. The fractal dimension decreases gradually as the UCS increases, which indicates that fractal dimension represents the micro profile of the rock structure. The fractal dimension can be used to investigate the rocks from the micro to the macro scales. The same conclusion can be made in relation to the elastic modulus.
Different lithologies have different self-similarity and homogeneity indices. The average homogeneities of mudstone, sandstone, limestone, and basalt are 7.8, 5.9, 4.4, and 3.2, respectively. The fractal dimension is consistent with the variation in the rock homogeneity. The rock structural homogeneity at different strengths can be characterized by the fractal dimension. The fractal dimension can also be used to describe the rock homogeneity at microscopic scales.
Footnotes
Acknowledgements
The authors want to thank to Professor Luis Ribeiro e Sousa from China University of Mining and Technology, Beijing, for their comments in order to improve the quality of the paper.
Handling Editor: Zuzana Murčinková
Declaration of conflicting interests
The author(s) declared no potential conflicts of interest with respect to the research, authorship, and/or publication of this article.
Funding
The author(s) disclosed receipt of the following financial support for the research, authorship, and/or publication of this article: This research was supported by the National Natural Science Foundation of China (nos 51704179, 51604165), Natural Science Foundation of Shandong Province (no. ZR2016EEB23), Science and Technology Program of Shandong Province University (no. J15LH02), and Open Funds of State Key Laboratory (no. MDPC2016ZR03).