
Abstract
Surface topography is an important characteristic of the surface integrity, and influences the performance and mechanical properties of the workpiece to a great extent in micro milling SiCp/Al composites. It is evaluated by three-dimensional surface roughness (Sq) and fractal dimension (Ds) in this paper. Based on the single factor experiment and the orthogonal experiment, the influence of process parameters (feed per tooth, spindle speed, milling depth, and milling width) on surface topography is studied. The results show that Sq is mainly affected by milling width and milling depth and optimal results for minimum Sq are: ae = 1.5 mm, ap = 0.08 mm, n = 12000 r/min, and fz=1 μm/z. While Ds is mainly affected by milling width and optimal parameters for maximum Ds are: ae=1 mm, n = 14000 r/min, fz = 1.5 μm/z and ap = 0.12 mm. There is a weak negative correlation between Sq and Ds. In addition, Ds is more sensitive to the main defects and in general a large Ds corresponds to a good surface.
Introduction
Silicon carbide particle reinforced aluminum matrix (SiCp/Al) composites are being used in complex and precise fields such as optics and aerospace due to their high strength to weight ratio and improved thermo-mechanical properties.1,2 However, since particles are significantly abrasive material, the machinability and surface integrity of this composite are poor, which significantly affects their wide application.3,4
Surface topography is one of the foremost characteristics of the surface integrity and has a great influence on the performance and mechanical properties of the workpiece, such as wear resistance, lubricity, corrosion resistance, fatigue strength, and breaking strength. It is extensively studied and mainly characterized in milling process by two-dimensional (2D) topography parameters, such as Rz (maximum contour height), Rq (root mean square roughness) and Ra (arithmetic mean roughness).5–15 These parameters are mainly calculated based on single surface profile. However, for the SiCp/Al composites, the different properties and removal ways of the two phases and the random distribution of particles lead to many defects on the surface, such as pits and cracks, which make the surface seriously anisotropic and the integrity poor. As a result, the 2D surface profiles obtained at different areas are poorly consisting, and some topography information may be lost. Finally, inconsistent values may be yielded and the surface may be not effectively evaluated. 16 On contrast, three-dimensional (3D) surface roughness parameters have the same dimension with surface, and can evaluate surface topography with more details.17–21
Meanwhile, considering the complexity of the surface topography of SiCp/Al composites and the dependence of statistical parameters on sampling lengths and the instrumental resolution, the 3D surface roughness parameters may not exactly depict characteristics of the machined surface. Fractal analysis is claimed as a reliable tool of quick spatial characterization of unique height deviations from perfect planes in various studies on morphology and mechanical properties of surfaces subjected to nanomechanical processing.22–24 It is a scale-invariant parameter and can retain structural information completely, which is suitable for evaluation of the intrinsic characteristic of non-linear phenomena.25,26 At the same time, it is sensitive to the microstructure. 27 Therefore, it is also suitable for evaluation of the surface topography of SiCp/Al composites.
At present, only a few researches on 3D surface roughness or surface fractal evaluation of SiCp/Al composites are conducted. Wang et al. 20 compared the applicability of 2D and 3D roughness, and found that the surface roughness was mainly affected by machined surface defects. Thus the 3D roughness characterization method was more suitable. Using typical 2D surface parameters (Ra, Rz) and 3D parameters (Sa, Sq), Wang et al. 28 evaluated the surface quality of 65% volume fraction SiCp/Al composites by high-speed milling experiments, and compared the evaluation effectiveness of surface parameters. It showed that the influence of milling parameters on surface roughness can be better characterized by Sa and Sq than Ra and Rz. Muguthu and Gao 29 studied the surface quality by fractal dimension analysis in precision turning with different cutting tools (non-coated CBN tool, coated CBN tool, and PCD tool). The results indicated that the larger the fractal dimension, the better the surface finish. In addition, fractal dimension of the PCD tool was the largest one, indicating that the cutting performance of PCD tools was better than the two CBN tools. In ultrasonic vibration grinding SiCp/Al composites, Zheng et al. 16 used Sq, Ssk (surface skewness), Str (surface structure shape ratio) and Ds to study the surface features. The results indicated that 3D parameters were suitable in evaluating surface quality of SiCp/Al composites, and Ds was more sensitive to the main surface defects. In addition, he found that the traditional method, calculating Ds by profile fractal dimension plus one, showed poor applicability to the anisotropic surface. Therefore, 3D calculation method should be used.
In present studies, the milling parameters are usually larger than the particle size of SiCp/Al composites. However, during micro milling process, cutting depth is almost in the same scale with the particle size, and many microstructures are produced on the machined surface, leading to a complex topography which is necessary to be fully evaluated. In this paper, we choose 3D root mean square roughness Sq parameter and surface fractal dimension Ds calculated by variation method 24 to evaluate the micromilling surface topography of SiC/Al composites. Single factor and orthogonal experiments will be conducted, and the influences of process parameters, including feed per tooth, milling depth, milling width and spindle speed, on the machined surface are investigated.
Experimental design
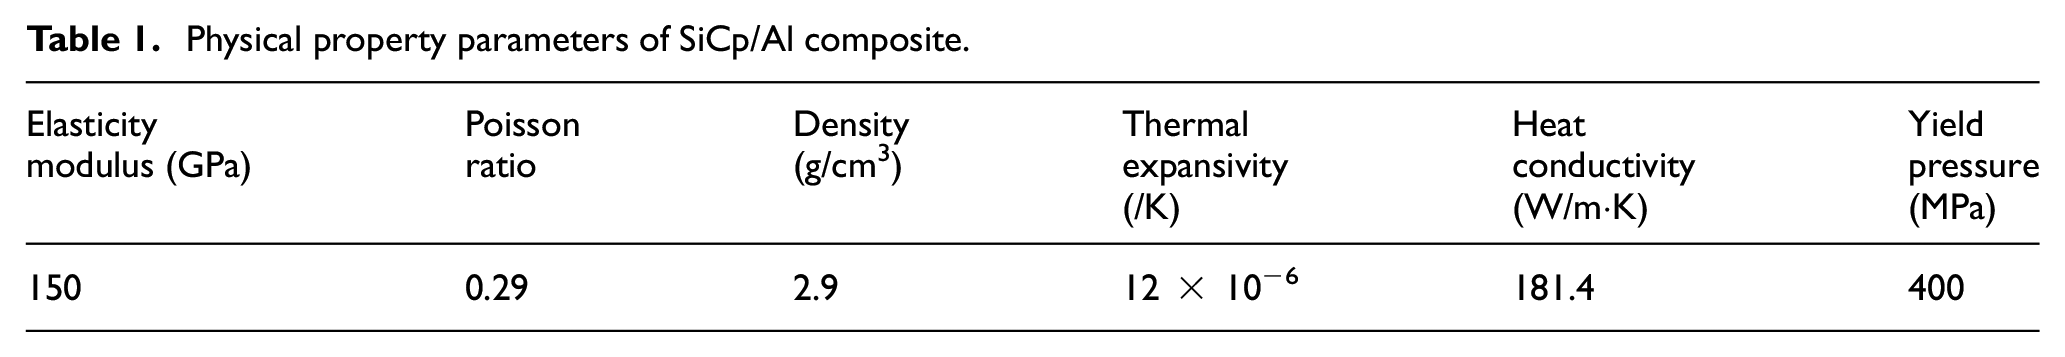
Milling experiments are conducted on a DMG Ultrasonic 70-5 linear ultrasonic machining center. The Workpiece is a kind of SiCp/Al2024 composites (45% volume fraction SiC, particle sizes 2–10 μm, and average particle size 5 μm). This composite is made by extrusion casting process, as shown in Figure 1. The physical property parameters of this SiCp/Al composite are shown in Table 1.
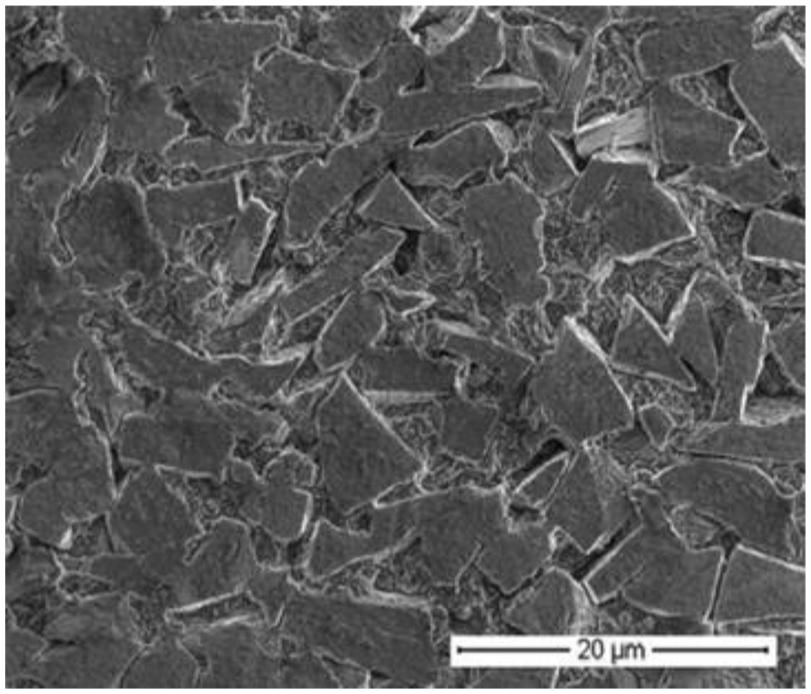
SEM image of SiCp/Al composite.
Physical property parameters of SiCp/Al composite.
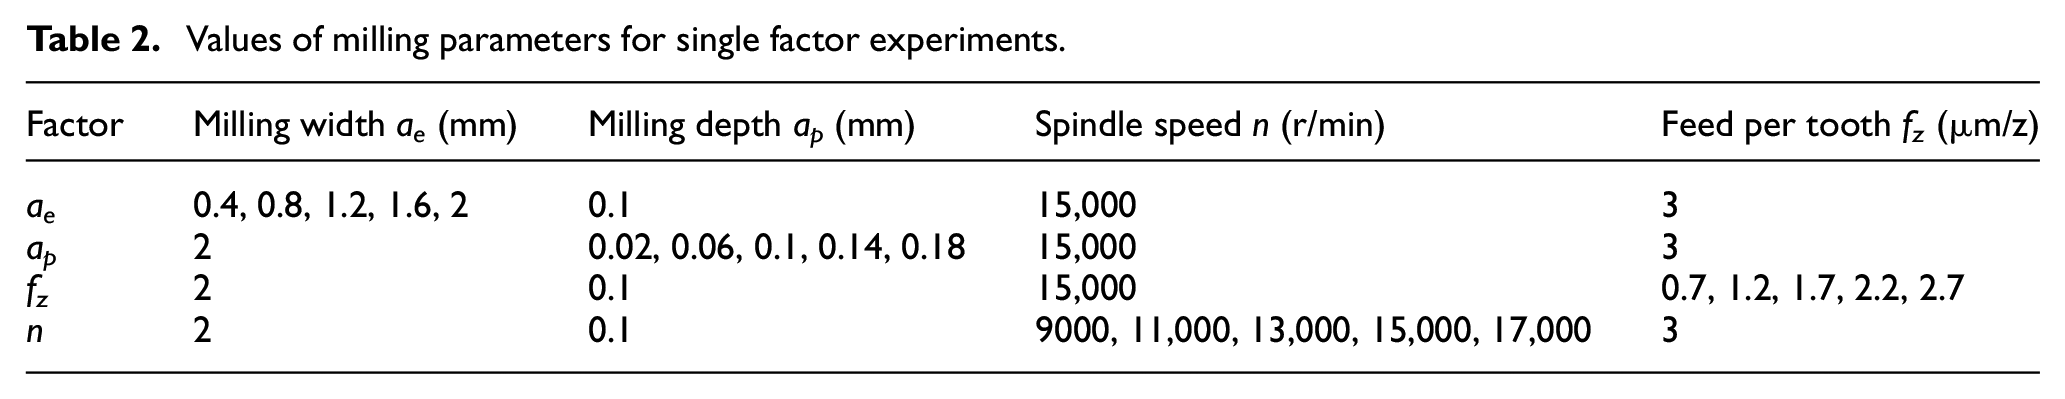
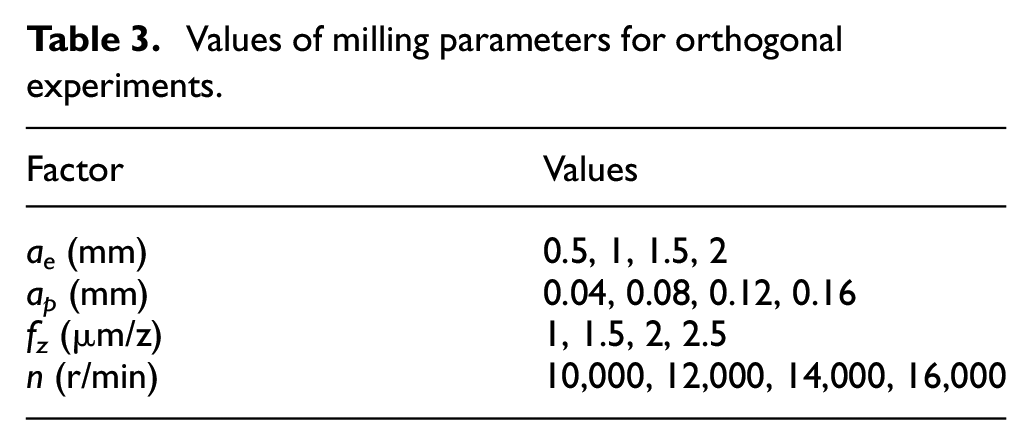
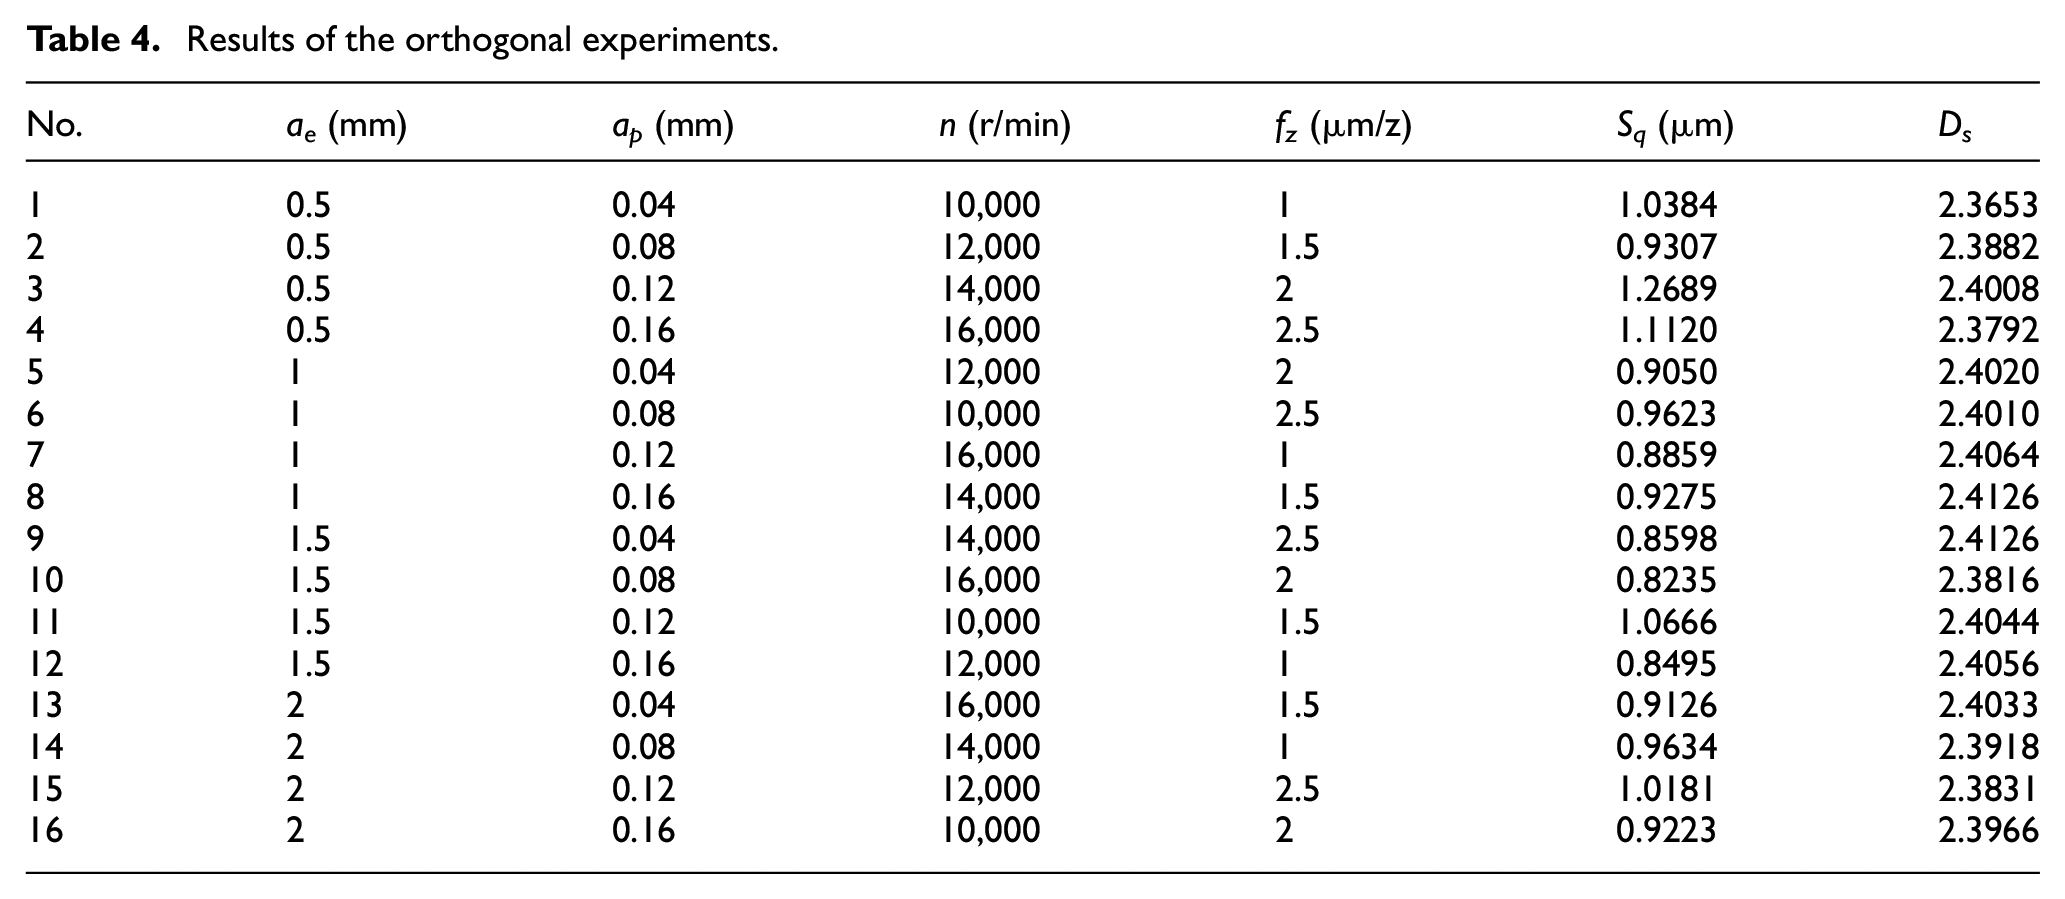
The milling tool is single-blade PCD cutters with diameter 2 mm and cutting edge radius 3 μm. Values of the parameters for the single factor experiment and orthogonal experiment are shown in Tables 2 and 3. In the orthogonal experiment, a four-factor four-level orthogonal experiment is designed and L16(44) is used as the orthogonal array. Interaction of the parameters is ignored. Every experimental group with cutting parameters can be seen in Table 4.
Values of milling parameters for single factor experiments.
Values of milling parameters for orthogonal experiments.
Results of the orthogonal experiments.
The experiment design and final workpiece obtained is shown in Figure 2. After the experiment, samples are ultrasonically cleaned for 10 min. The surface morphology is observed and obtained by OLS3000 laser confocal microscope. The sampling range is 256 μm × 256 μm, and interval along the X and Y directions is 0.25 μm. Three random areas of each surface are measured and the average value is used as roughness of this surface.
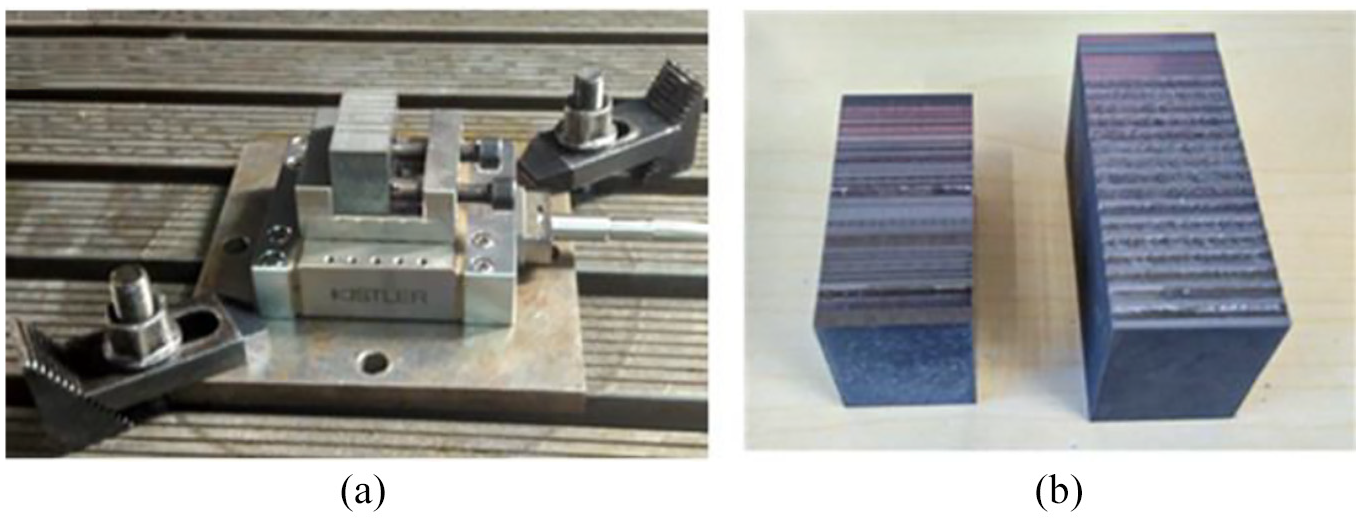
Experimental design: (a) the clamping and (b) final machined surface.
Results and analysis
Influence of milling parameter on surface topography
The 3D roughness Sq is a statistical parameter and represents the root mean square height of each point in the measured region. Usually, a large Sq means a bad surface quality. Surface fractal dimension Ds characterizes the richness of the surface details and reflects the complexity of the surface contour in space and the ability to fill the space. 30 Usually, a larger Ds means more complex and minuteness structures on a surface.
Milling depth
The effect of milling depth on the surface roughness and surface fractal dimension are shown in Figure 3. As ap increases, Sq increases, while Ds basically decreases, meaning the surface quality deteriorates.
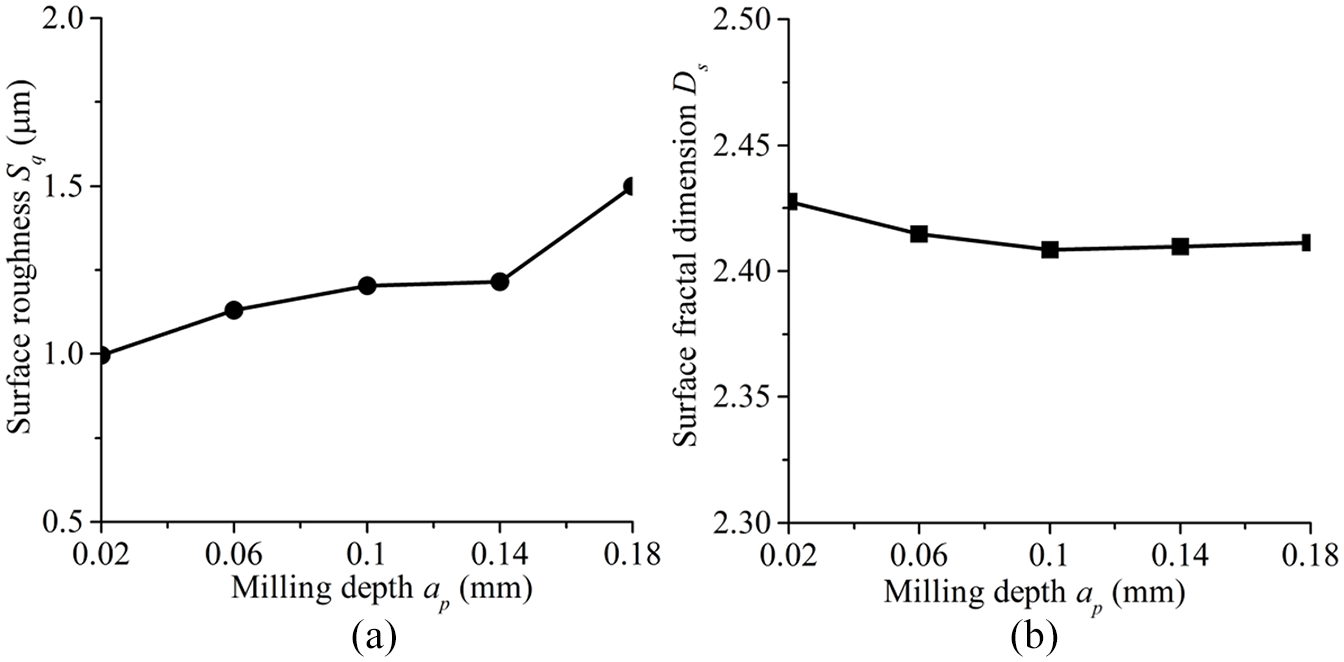
Influence of the milling depth on the: (a) surface roughness and (b) surface fractal dimension.
The three-dimensional surface features are shown in Figure 4. It shows that with ap increasing, the number of the surface defects increases, scratches on the surface increase significantly, and the surface integrity deteriorates. As shown in Figure 4(c) to (e), there are obvious scratches on the surface, and their size and depth increase significantly with ap increasing.
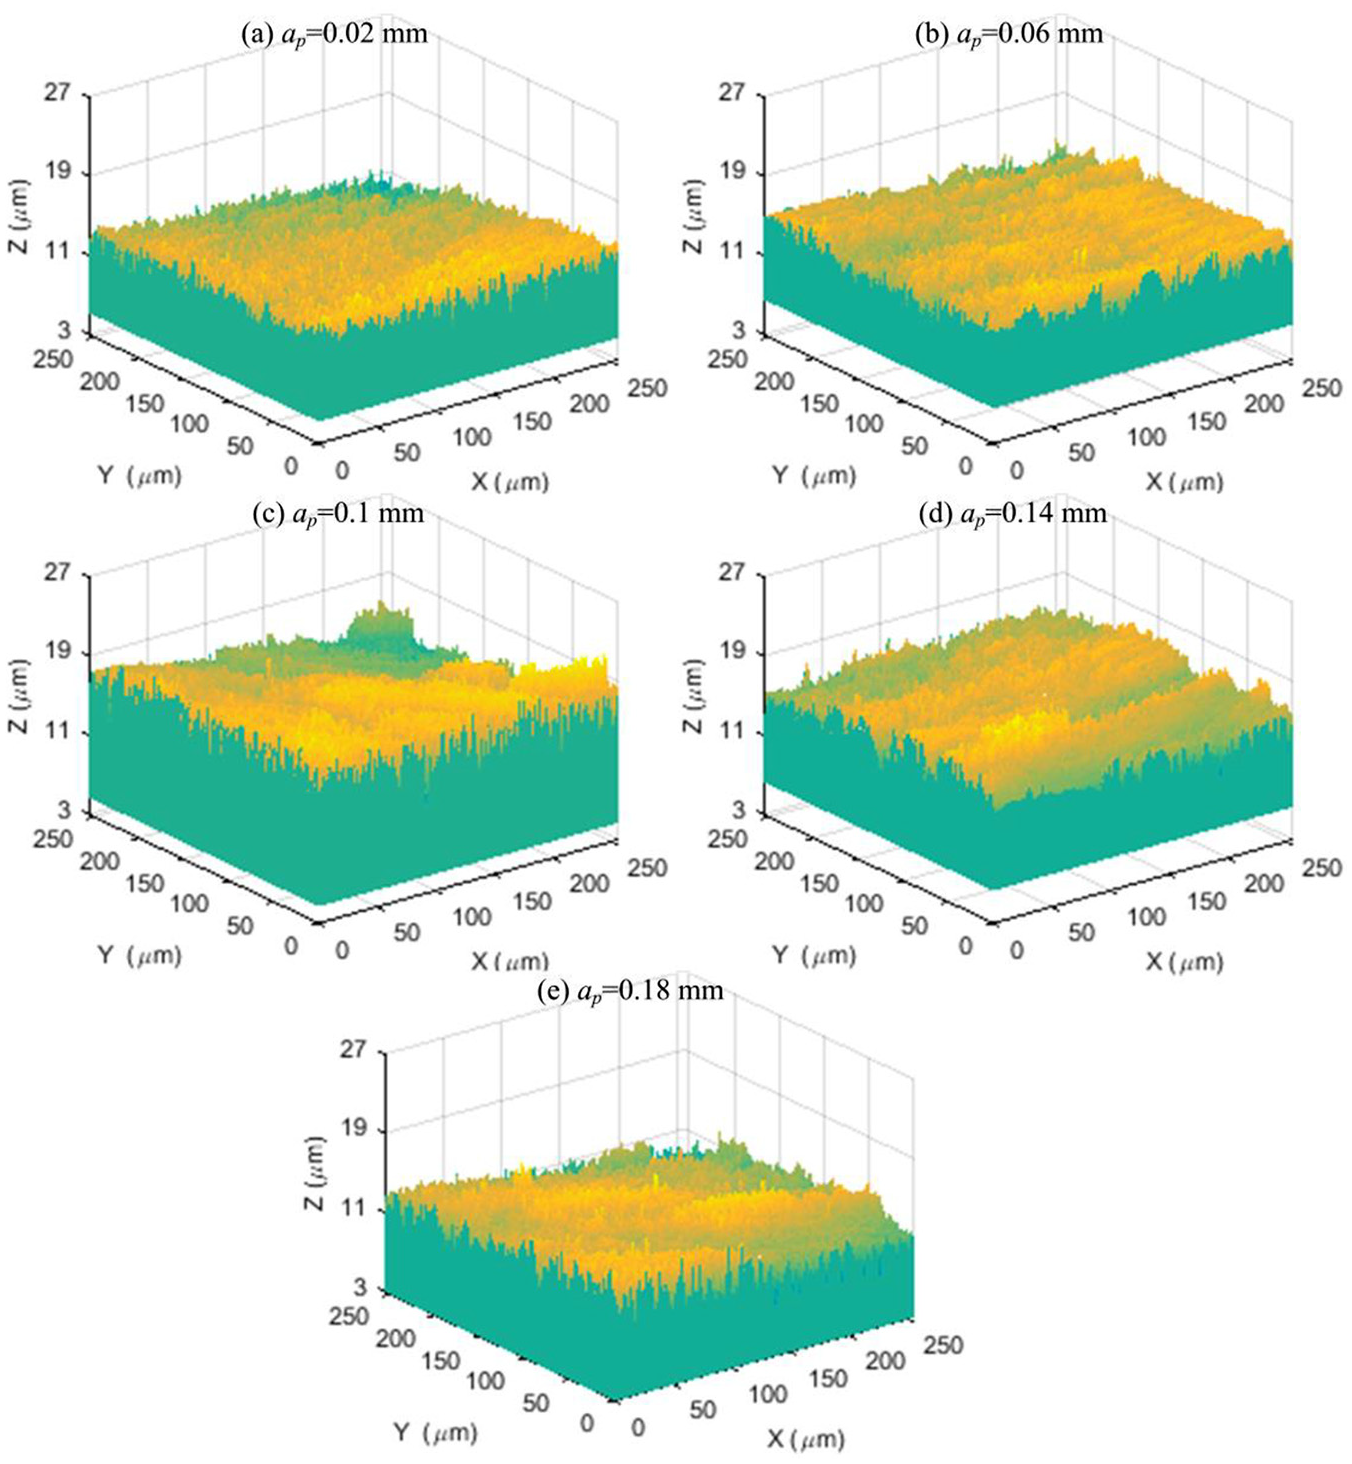
Influence of the milling depth on surface topography: (a) ap = 0.02 mm, (b) ap = 0.06 mm, (c) ap = 0.1 mm, (d) ap = 0.14 mm, and (e) ap = 0.18 mm.
During the milling process, as ap increases, cutting volume increases, resulting in an increase of the number of particles removed during cutting. At the same time, the milling force increases and causes vibration of the tool, and thus increasing the roughness. In addition, the particles’ fracture pieces may scratch the surface with the movement of the tool, which also causes the deterioration of surface integrity.
Feed per tooth
The effect of feed per tooth on Sq and Ds is shown in Figure 5. As fz increases, Sq increases. The change of Ds is similar to Sq basically, which is likely to be caused by the weakened size effect of the matrix with fz increasing.
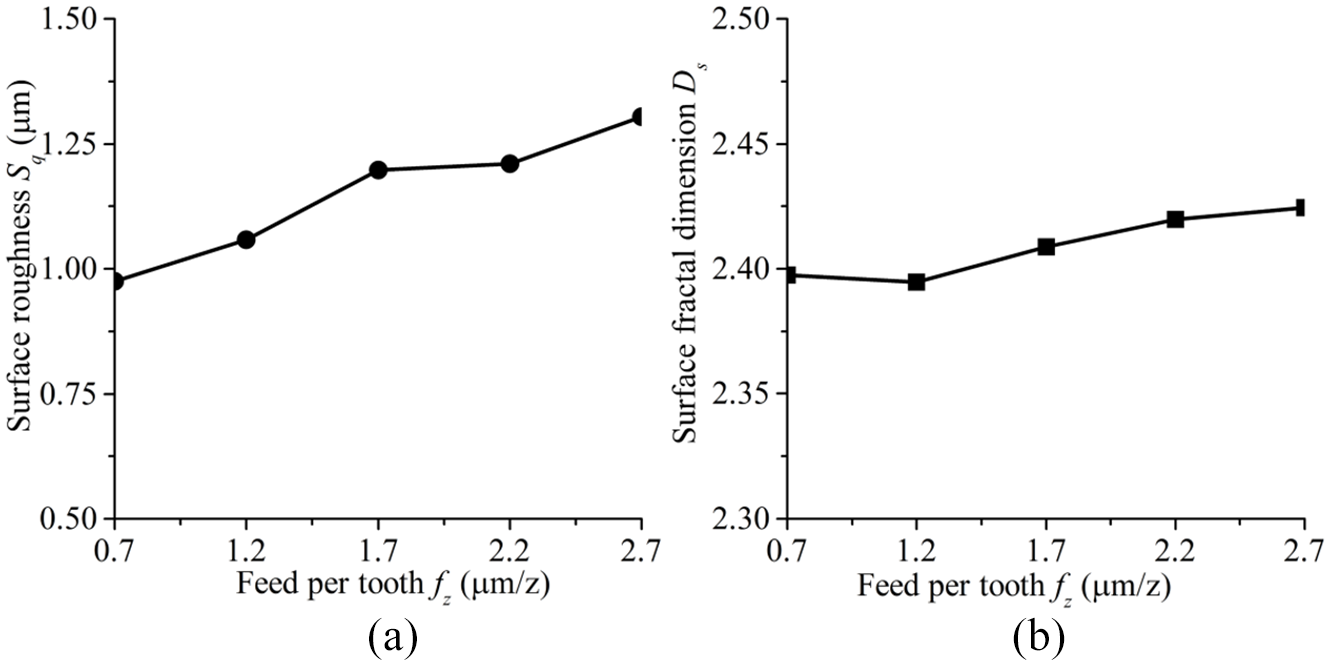
Influence of the feed per tooth on the: (a) surface roughness and (b) surface fractal dimension.
The surface features are shown in Figure 6. When fz is 0.7 μm/z, shown in Figure 6(a), the cutting thickness is small, thus the size effect becomes remarkable and the coating effect of matrix is strong, making the surface relatively smooth. Moreover, the number of broken particles is small, and therefore their influence on the surface quality is small. Their combined role contributes to a good surface. Thereafter, as fz increases, the size effect is weakened, and more particles begin to be removed, which are mainly broken and fractured. The broken particles will scratch the surface, shown in Figure 6(b). With the further increase of fz, the broken parts and volume of the particle increase, and then the surface scratches are increased, deteriorating the surface, shown in Figure 6(c) to (e). In addition, an increase in the milling force with fz increasing also causes an increase in surface roughness. Considering the particle size (2–10 μm) and the value of the feed per tooth, when fz is too large, some small particles will be pulled out and leave pits on the surface, shown in Figure 6(d).
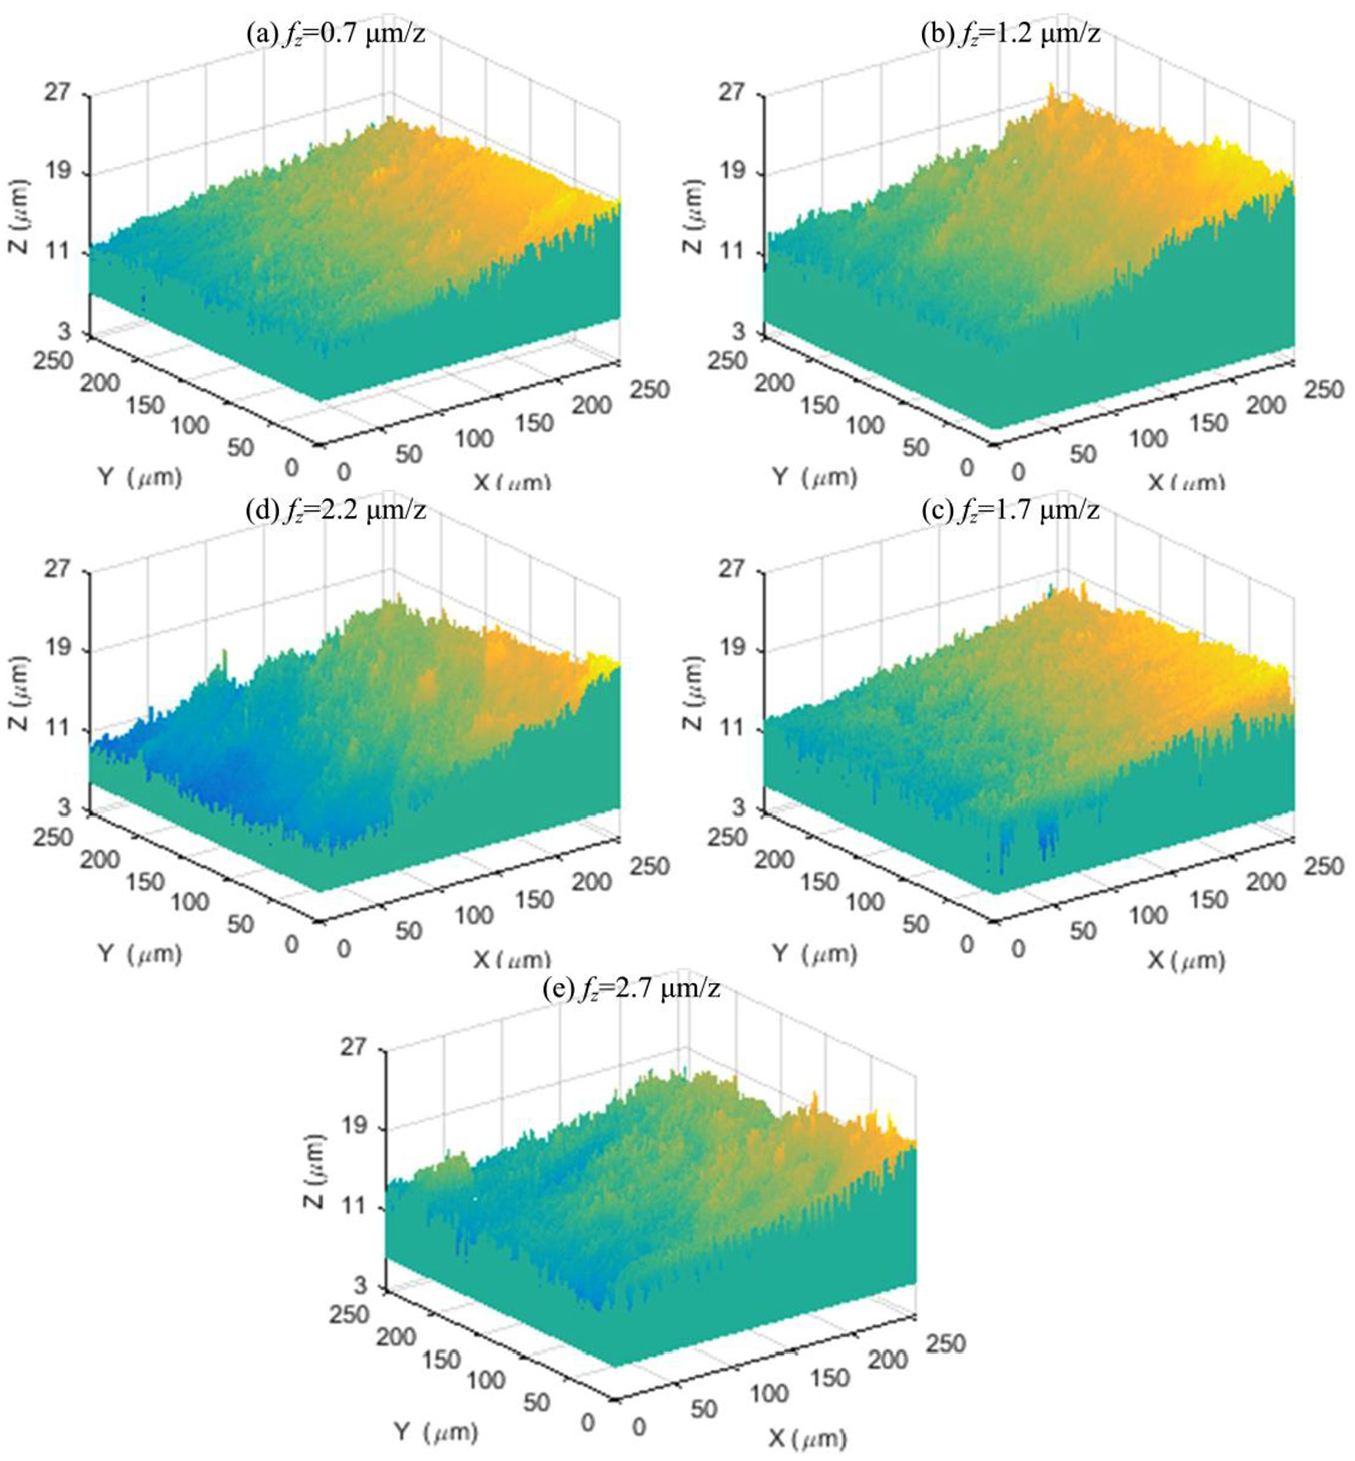
Influence of the feed per tooth on surface topography: (a) fz = 0.7 μm/z, (b) fz = 1.2 μm/z, (c) fz = 1.7 μm/z, (d) fz = 2.2 μm/z, and (e) fz = 2.7 μm/z.
Spindle speed
The effect of spindle speed on surface roughness Sq and Ds is shown in Figure 7. As n increases, Sq decreases, while Ds increases firstly and then decreases with a small fluctuation.
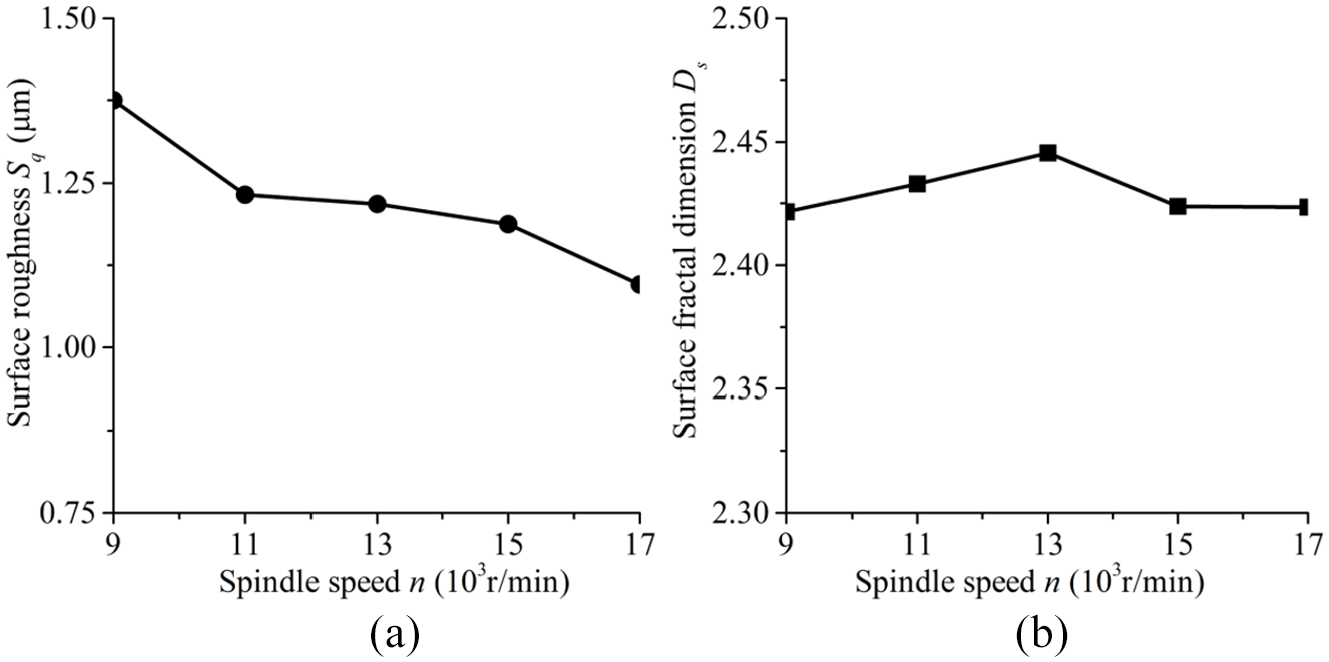
Influence of the spindle speed on the: (a) surface roughness and (b) surface fractal dimension.
The surface features are shown in Figure 8. When n = 9000 r/min, as shown in Figure 8(a), the defects on the surface are more obvious. As n increases, the cutting speed increases and the defects weaken, leading to an improved surface. The fracture depth of the particles decreases as the cutting speed increases, that is, the defects are alleviated, and the surface quality is improved.30–34 In addition, as n increases, because the effective cutting time is reduced and the heat increases, softening the matrix, the milling force is reduced and the surface quality is improved finally. In addition, the fluctuation of Ds may be caused by the decreased microstructures on the surface.
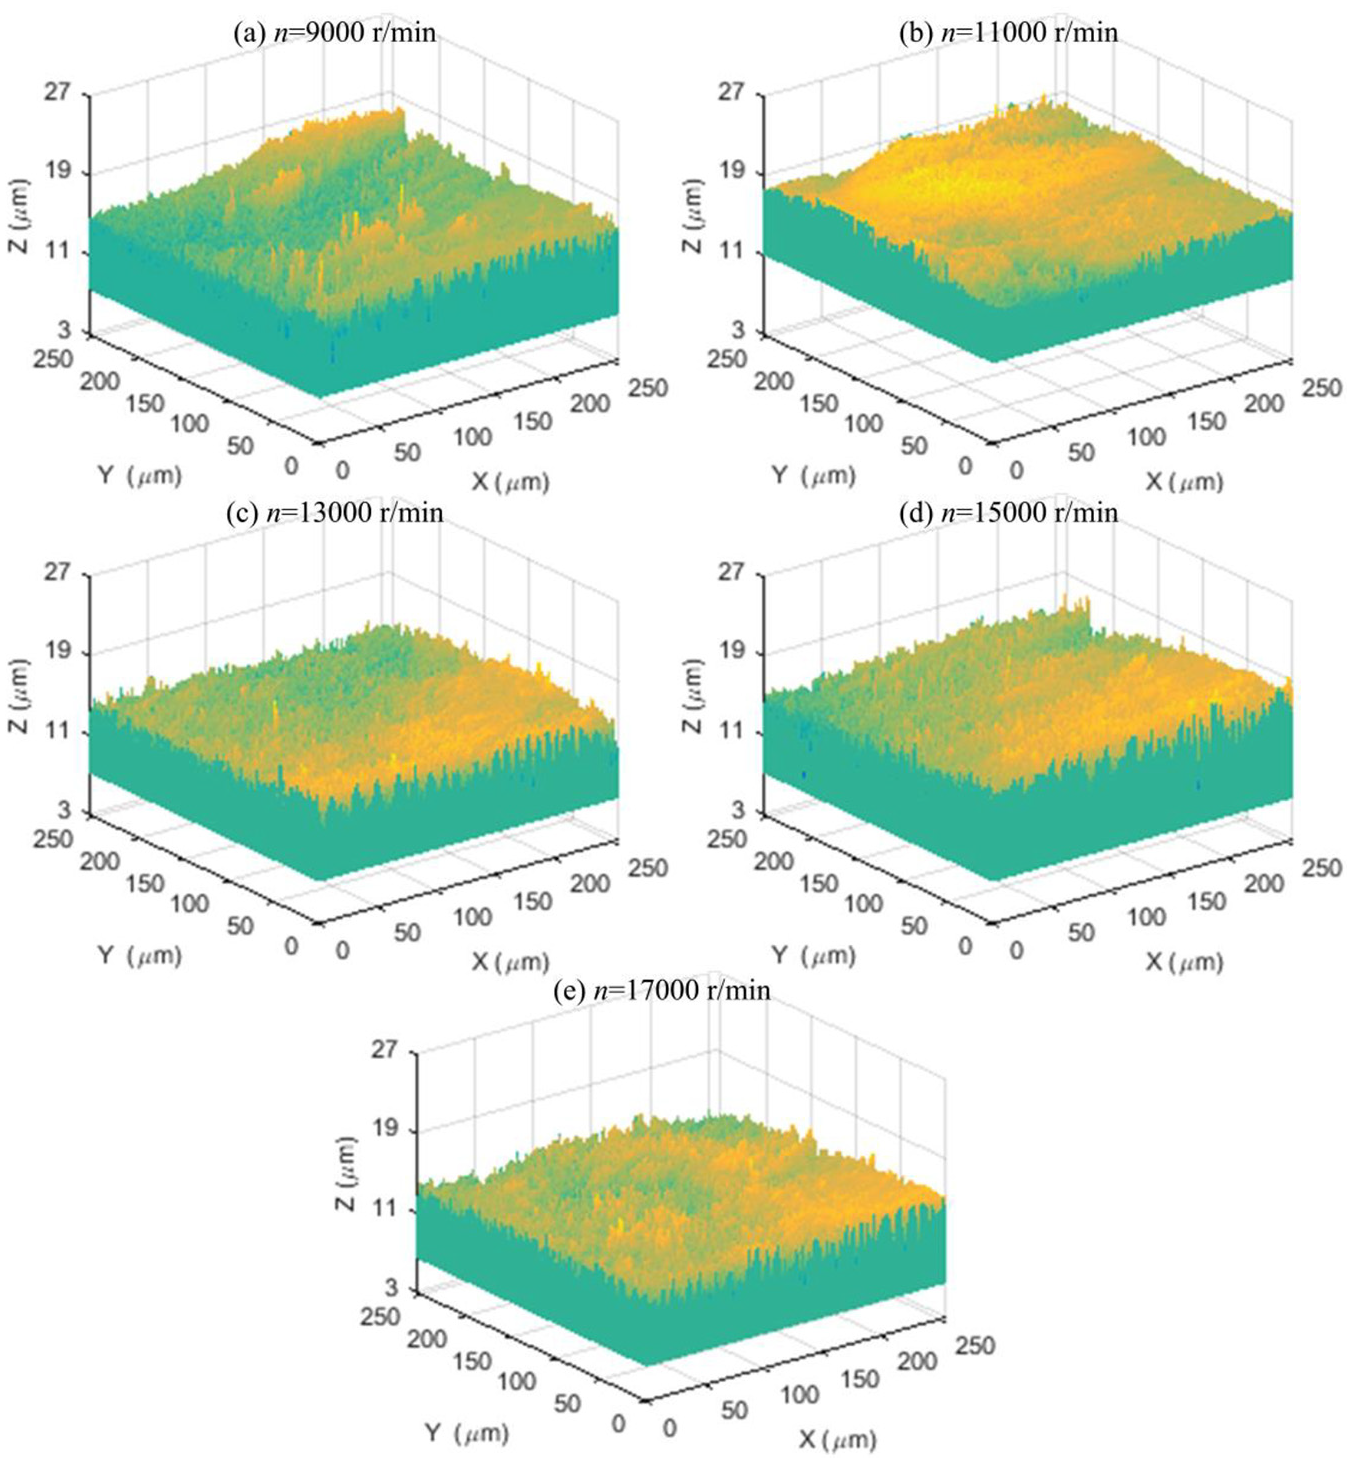
Influence of the spindle speed on surface topography: (a) n = 9000 r/min, (b) n = 11,000 r/min, (c) n = 13,000 r/min, (d) n = 15,000 r/min, and (e) n = 17,000 r/min.
Milling width
The effect of milling width on Sq is shown in Figure 9. As ae increases, Sq gradually decreases, which is similar to the effect of spindle speed. However, Ds increases significantly as ae increases.
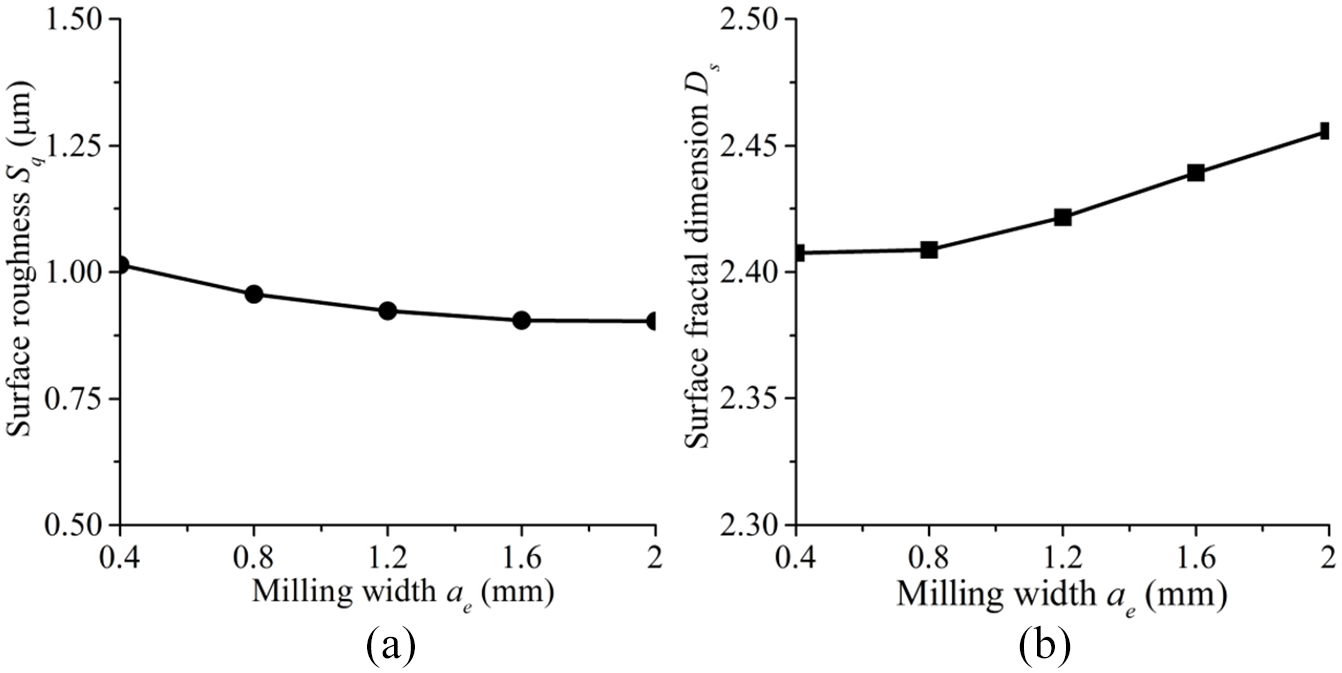
Influence of the milling width on the: (a) surface roughness and (b) surface fractal dimension.
The surface features are shown in Figure 10. Because of the small instantaneous depth of cut and tool tip, most of the material are remained on the area edge, so that the surface near the side is slightly higher. In addition, the reciprocating cutting area of the bottom edge is also small, and the coating and fragmentation of the particles cannot be completely removed, shown in Figure 10(b), thereby affecting the surface quality. With ae increasing, the bottom reciprocating cutting area increases, making the machined surface deviate from the edge, so the surface quality improves, shown in Figure 8(c) to (e). Since the effective machining surface is concentrated on the portion where the cutting thickness is large, the surface quality does not change much when ae is larger than the tool radius.
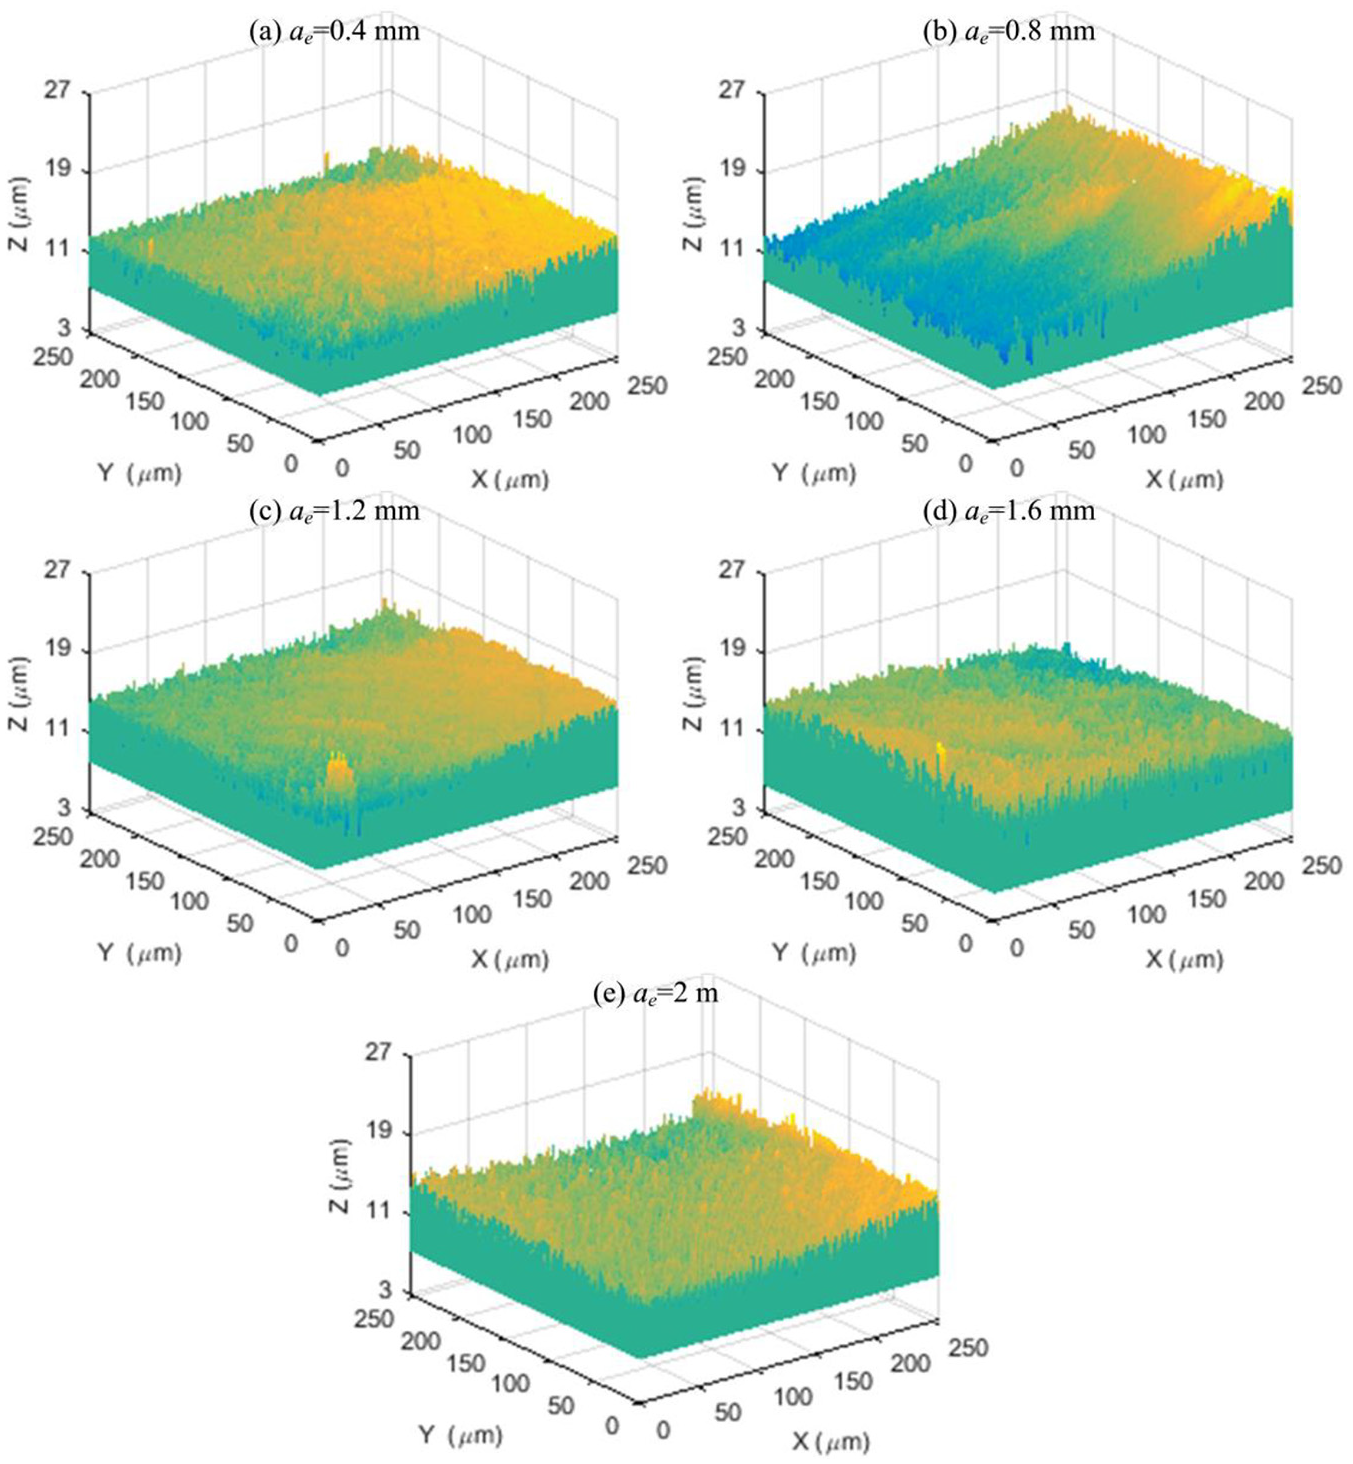
Influence of the milling width on the surface topography: (a) ae = 0.4 mm, (b) ae = 0.8 mm, (c) ae = 1.2 mm, (d) ae = 1.6 mm, and (e) ae = 2 mm.
Relationship between Sq and Ds
Relationship between Sq and Ds are explored in Figure 11, and a black fit line is drawn. In general, as Sq increases, Ds decreases. In other words, a small surface fractal dimension may correspond to a poor surface quality and there is a negative correlation between them. However, this correlation is not strict, indicating that the roughness parameter and the surface fractal dimension are not the same kind of evaluation parameters.
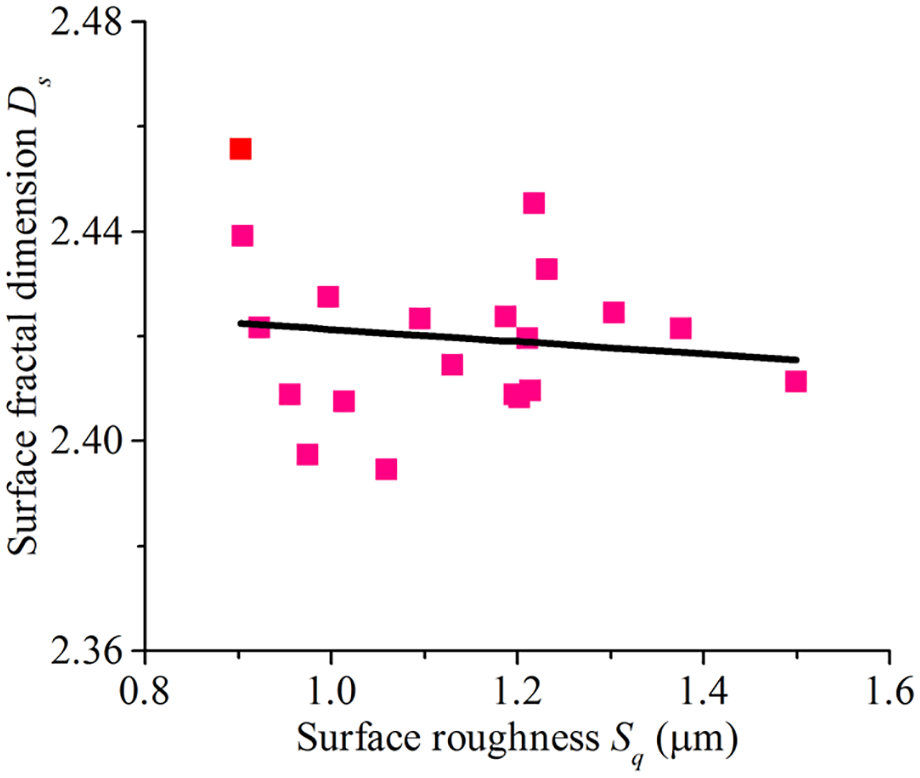
Relation between surface roughness and surface fractal dimension.
In addition, in Figure 11, a plurality of parameter combinations, such as ap = 0.1 mm, ap = 0.14 mm lead to a similar Sq (about 1.2 μm), but their surface features are significantly different, shown in Figure 4(c) and (d), and the surface is smoother with larger Ds. It shows that Ds is more sensitive to some microstructures than Sq, and the larger Ds usually corresponds to a better surface microtopography. The combination of Sq and Ds can better characterize the surface topography to a degree.
Range analysis
Results of the orthogonal experiment are shown in Table 3. The influence degree of each parameter is calculated by Range analysis method (equation (1)). Range analysis values are shown in Table 5.
Range analysis of the results.
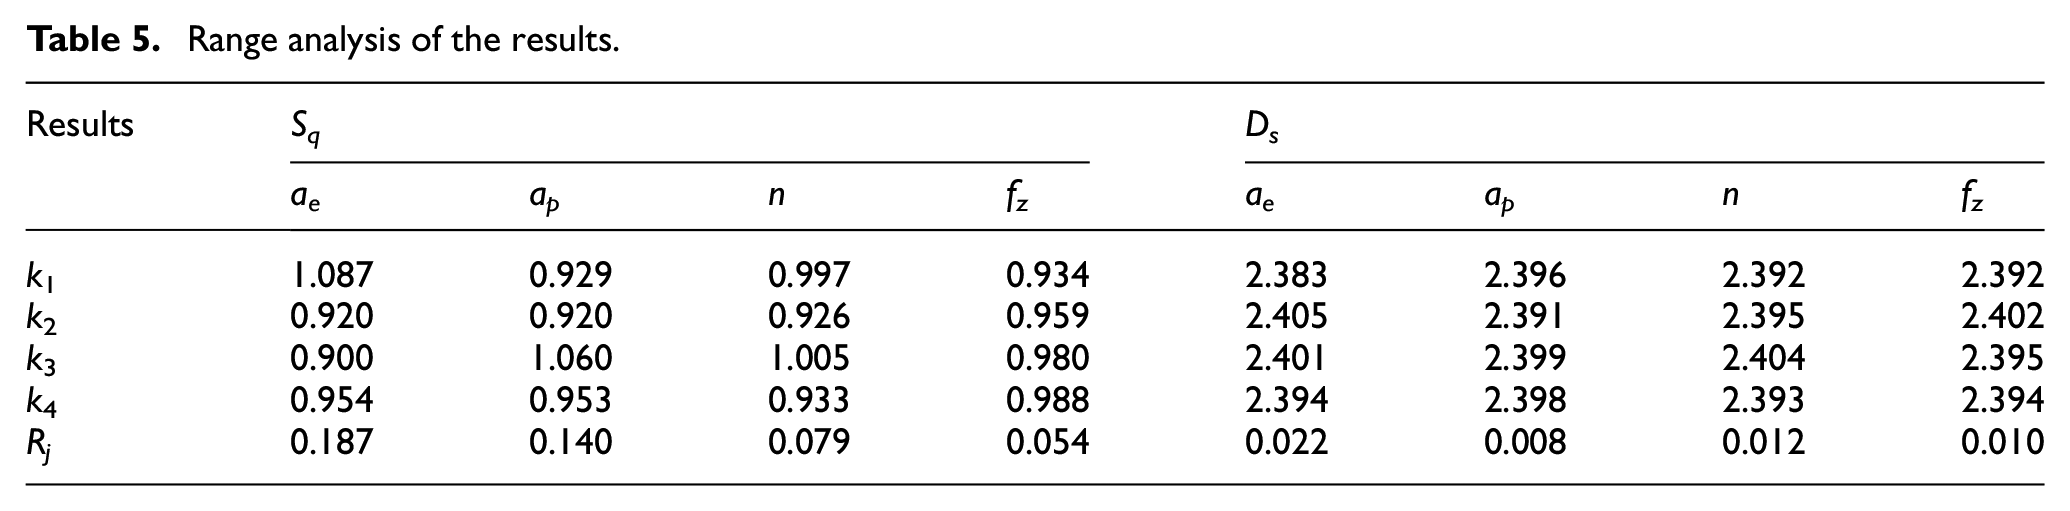
For Sq, there is R1> R2> R3> R4, which means the influence degree of these parameters on Sq is: ae> ap> n> fz. In addition, R1 and R2 are much bigger than the others, meaning the main influence factors are ae and ap. The optimum parameters for minimum Sq are: ae = 1.5 mm, ap = 0.08 mm, n = 12000 r/min, and fz=1 μm/z.
For Ds, there is R1> R3> R4> R2. Therefore the degree of influence of these four parameters is: ae> n> fz >ap. In addition, R1 are much bigger than the others, meaning the main influence factors are ae. The optimal parameters for maximum Ds are: ae = 1 mm, n = 14000 r/min, fz=1.5 μm/z and ap = 0.12 mm.
Conclusion
In this paper, the influence of milling parameters (feed per tooth fz, milling depth ap, milling width ae and spindle speed n) on surface topography of a kind of 45% volume fraction SiCp/Al composites is evaluated by three-dimension surface roughness Sq and fractal dimension Ds. The research can provide data and method for the finishing of composites in the industrial practice and precision experiments. Moreover, it can also be used to other composites and can help the precision machining of composites. The following conclusions are drawn:
Sq increases with the milling depth and the feed per tooth increasing, while decreases with the spindle speed and the milling width increasing.
Change trend of Ds affected by the process parameters is basically opposite to Sq. There is a weak negative correlation between Sq and Ds. In addition, Ds is more sensitive to some microstructures than Sq, and the larger Ds usually corresponds to a better surface microtopography. The combination of the two can better characterize the surface topography to a degree.
Influence degree of each process parameter on surface topography is analyzed. For Sq, there is ae> ap> n> fz, and optimal parameters for minimum Sq are: ae = 1.5 mm, ap = 0.08 mm, n = 12,000 r/min, and fz = 1 μm/z. For Ds, there is: ae> n> fz >ap, and optimal parameters for maximum Ds are: ae = 1 mm, n = 14000 r/min, fz = 1.5 μm/z and ap = 0.12 mm.
Footnotes
Declaration of conflicting interests
The author(s) declared no potential conflicts of interest with respect to the research, authorship, and/or publication of this article.
Funding
The author(s) disclosed receipt of the following financial support for the research, authorship, and/or publication of this article: This work was supported by the National Natural Science Foundation of China (Project No. 51675135).