
Abstract
This article presents detailed experimental results of the influencing factors of flow rate, set pressure, and inlet pipe length of a pressure relief valve. In order to analyze the influence of different flow rates on the instability characteristics of pressure relief valve, the multi-stage output of pump flow is realized. In terms of modeling, we investigated the theory concerning instability in the system: the 3% rule boundary. Data analyses on typical stable, cycling, and chatter instability conditions are conducted. The stable boundaries of the 3% rule and the quarter-wave model are drawn, which are consistent with the experimental results.
Introduction
Pressure relief valve (PRV) is used to keep the pressure of the controlled system or loop constant through the overflow action of the valve port and to achieve the purpose of regulating, stabilizing, and limiting the pressure.1–6 The unstable operation of the PRV causes great harm, which is mainly expressed as follows: decrease of discharge capacity, insufficient function of constant pressure regulation or overpressure protection and the resonance of the whole pipeline system, or the serious damage to the sealing surface of the PRV. Scholars have paid increasing attention on how to reduce the vibration and noise of hydraulic circuits.
The operation of PRV includes three stages: opening, continuous discharge, and re-seating. The disk leaves the valve seat to reach sufficient valve lift, and its discharge capacity reaches the rated capacity, thus completing the opening process. The process in which the disk returns to the seat from the fully open position and the sealing is formed again is the process of re-seating. Re-seating pressure, also known as closing pressure, is the inlet pressure when the disk re-contacts the valve seat after discharge, namely, the valve lift turns to zero. The PRV with qualified operation performance should meet the following requirements: during the whole process of opening, discharging, and re-seating, the PRV is in a stable flow state, without flutter or chatter.
The working medium of PRV is a typical turbulent flow fluid. The motions of flow vary irregularly so that quantities such as velocity and pressure show a random variation with the time and space coordinates. Unsteady turbulent flow can be defined as a flow in which the time-average physical quantities change in time. How to study PRV with unsteady turbulent flow by an effective experimental method has become an essential problem.
Some scholars focused on local stability of PRV to seek the stability domain. The stability criterion in the classical control theory was used near the equilibrium point of the system.
Izuchi 7 investigated the stability of a PRV through experiments and analysis. It was found that the dynamic instability was caused by the interaction effect between the pressure wave propagation through the inlet pipe and the valve disk motion. Li et al. 8 focused on the numerical analysis of the dynamic behavior of a PRV. The authors found that the axial force exerted by the fluid on the valve clack first decreases with the increase of the valve opening and then increases. Wu et al. 9 established a mathematical model of PRV and conducted stability analysis. Applying the deformation data to the PRV model, the stability and relative stability could be analyzed quantitatively through both the frequency-domain analysis method and the time-domain analysis method to detect the influence of fitting clearance after deformation. Yang et al. 10 analyzed the mathematical model of pilot-operated PRV, and the dynamics simulation model with strong vibration environment was built. The simulation results showed that, when the system is stable, the pilot valve is affected by little interference and the system will attenuate vibration to be stable, but when the interference exceeds the critical value, the system generates periodic oscillation. Chen et al. 11 proposed a cartridge one-way PRV, which has the characteristics of direct detection. Theoretical analysis and simulation results indicated that the direct detection characteristic forms the interstage negative feedback, which can effectively reduce the steady-state override pressure.
The above studies greatly promote the engineering application of PRV. However, the stability of the PRV is essentially a fluid–structure interaction problem. Its stability is affected not only by the structure of the valve itself, but also by the hydraulic pipeline and other hydraulic components in the pipeline. Therefore, the impact of pipeline on the stability of the PRV cannot be ignored.
The local stability analysis is based on the linear equation linearized near the equilibrium point of the system, but the system itself is a non-linear system. The local stability analysis of PRV cannot meet the requirement of large range stability. When the disk deviates from the set equilibrium point, the experimental results differ from the theoretical results of linearization calculation near the equilibrium point. In addition, the conclusion of the local stability criterion is only applicable to static stability judgment of the system, and the global dynamic behavior cannot be understood. Therefore, the global stability of the PRV can be reflected more truthfully using the non-linear model of the system.
In recent years, increasing attention has been paid to the numerical simulation as an effective auxiliary research method due to the rapid development of computational fluid dynamics.12–15 However, experimental study is still the basic method to promote the research on PRV.
To sum up, the local and global stability of elevating force caused by the working medium on the disk are the decisive factors affecting the working stability of the PRV. However, there is still much room for improvement in the existing experimental and numerical computation methods.
The rest of the article is organized as follows. In section “Basic principles of PRV,” the fundamental concept of PRV is presented. In section “Instability characteristic experiment of PRV,” the details of experimental objectives, principles, devices, and procedures are introduced. In section “Experimental results and analysis,” the data analyses for typical stable, cycling, and chatter instability conditions are presented. Then in section “Stable boundary analysis,” the work is concluded by showing the stable boundaries of the 3% rule and the quarter-wave model, and finally concluding comments are provided in section “Conclusion.”
Basic principles of PRV
Figure 1 shows the typical PRV components, the precise definitions of which are given in Appendix 2 .

Typical PRV components.
The reaction force acting on the inlet side of the disk is acting against the spring force plus the force applied by the back pressure on the top of the disk, as shown in Figure 2. When the valve is closed, as shown in Figure 2(a), the inlet pressure acting on the disk surface is counteracted by spring force and back pressure force. At initial opening, as shown in Figure 2(b), the escaped fluid forms a thin film on the seat surface and forms a reaction force that prompts the disk to lift when the disk holder flows downward. In the initial stage, these forces are formed very slowly. As shown in Figure 2(c), as the flow rate increases gradually, the velocity difference between the fluid and the valve seat becomes increasingly larger, and the momentum and reaction forces are sufficient to further lift the disk. Overpressure continues to increase to achieve the full opening of the disk. At the closing stage, spring forces and back pressure force bring the disk back to the seat position due to reduced momentum and reaction force.

The operating principle of PRV: (a) closing state, (b) initial opening state, and (c) full opening state.
Figure 3 illustrates the full stroke of the disk from the set pressure (A) to the relieving pressure (B) through overpressure stage and returning to the closing position (C) through the blowdown stage. Moreover, details of the operational characteristics are explained in Appendix 3.
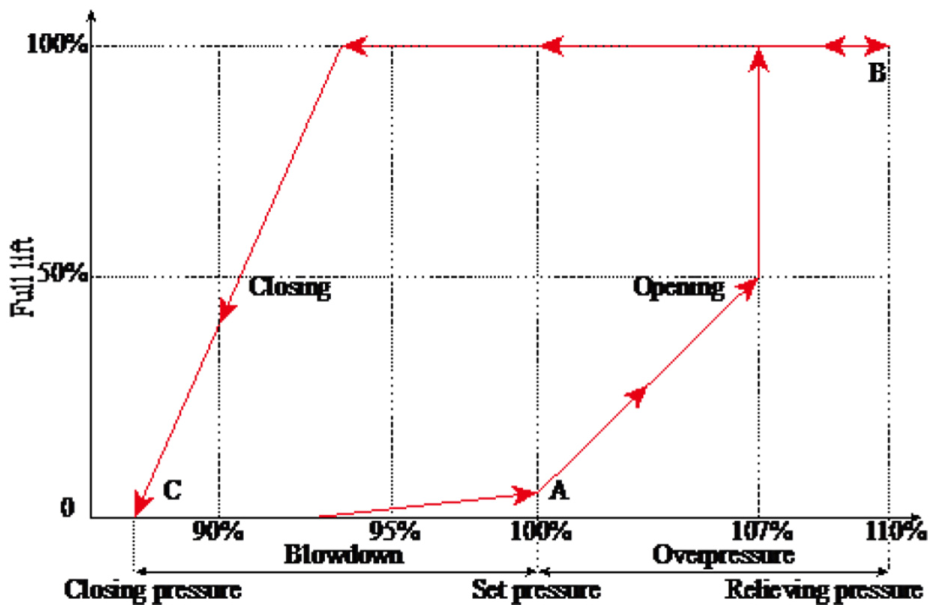
Typical PRV lift characteristic.
Instability characteristic experiment of PRV
The experimental objectives are to measure the mechanical properties of PRV at different set pressures and inlet pipe lengths to study the relevant parameter changes in the fluid field during PRV instability.
Figure 4 illustrates the system configuration of the instability characteristic experiment of PRV, and Figure 5 illustrates the field picture of the instability characteristic experiment of PRV. The programmable multi-stage speed function of the frequency converter is used to realize the multi-stage output of pump flow, adjust the different precompressed spring lengths, and study the influence of set pressure on the instability characteristic of PRV. The length of the inlet pipe of PRV is changed to study the effect of inlet pressure loss on the instability characteristics of PRV. The experimental platform for instability characteristics of PRV contains a frequency converter, an electric motor pump unit, an electromagnetic flow meter, a reservoir, a pressure sensor, an accelerometer, a laser displacement sensor, a data acquisition system, and a computer. In order to reduce the effect of piston pulse on the electric motor pump unit, the reservoir should have enough volume capacity and weight.
Step 1. To adjust the visible light spot project center on the valve spindle, the laser displacement sensor is installed on the fixed bracket. Install accelerometer on the top of the valve spindle. Adjust the set pressure by the adjustment screw of PRV to be 0.1 MPa. The inlet pipe length is 0, 1, 2, 3, 4, and 5 m. The programmable multi-stage speed function of the frequency converter is used to realize the multi-stage output of pump flow, which is 20, 30, 40, 50, and 60 L/min.
Step 2. Observe the action of the PRV to estimate whether it can be reached and maintained in full open condition. Record the valve primary pressure, valve back pressure, valve lift, acceleration, and flow rate of PRV. Observe whether there is a phenomenon of instability and record mechanical properties through auditory, tactile, or visual observations. If chatter, flutter, or cycling occurs for the PRV, it should be recorded. Then gradually reduce the flow rate of the pump, observe the rise and fall of the valve stem, and turn off the electric motor pump unit.
Step 3. Adjust the set pressure by the adjustment screw of PRV to be 0.2, 0.3, 0.4, and 0.5 MPa and repeat steps 1 and 2.
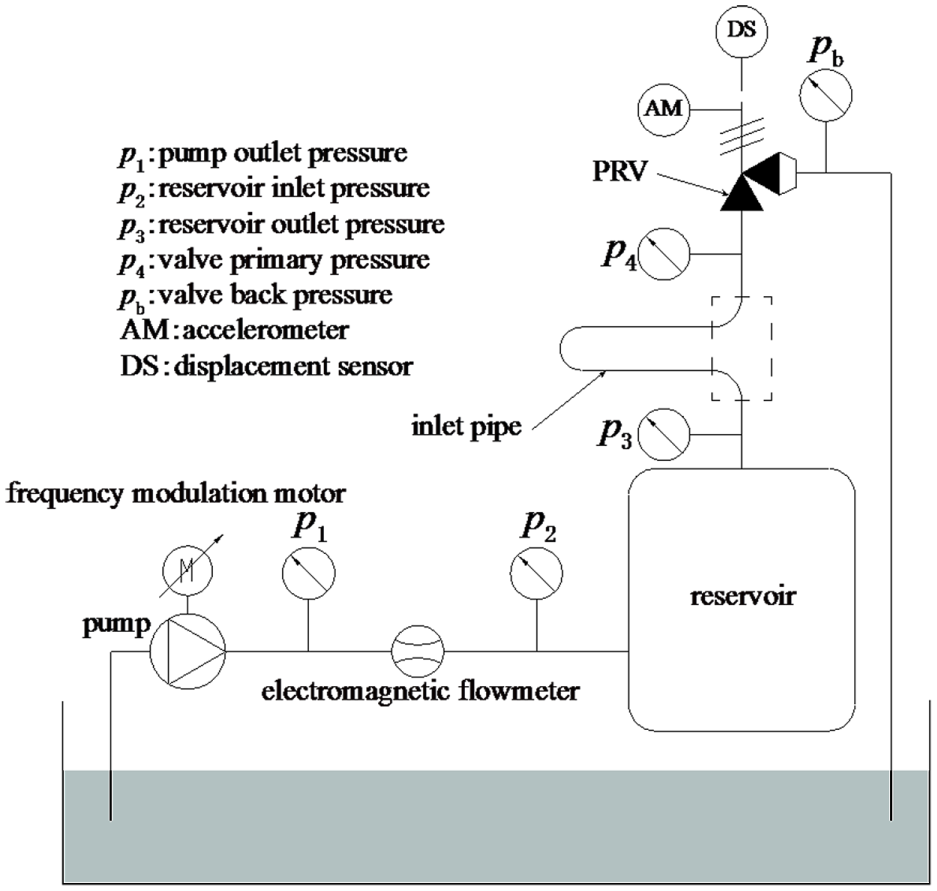
The system configuration of the instability characteristic experiment.

The field of the instability characteristic experiment.
Experimental results and analysis
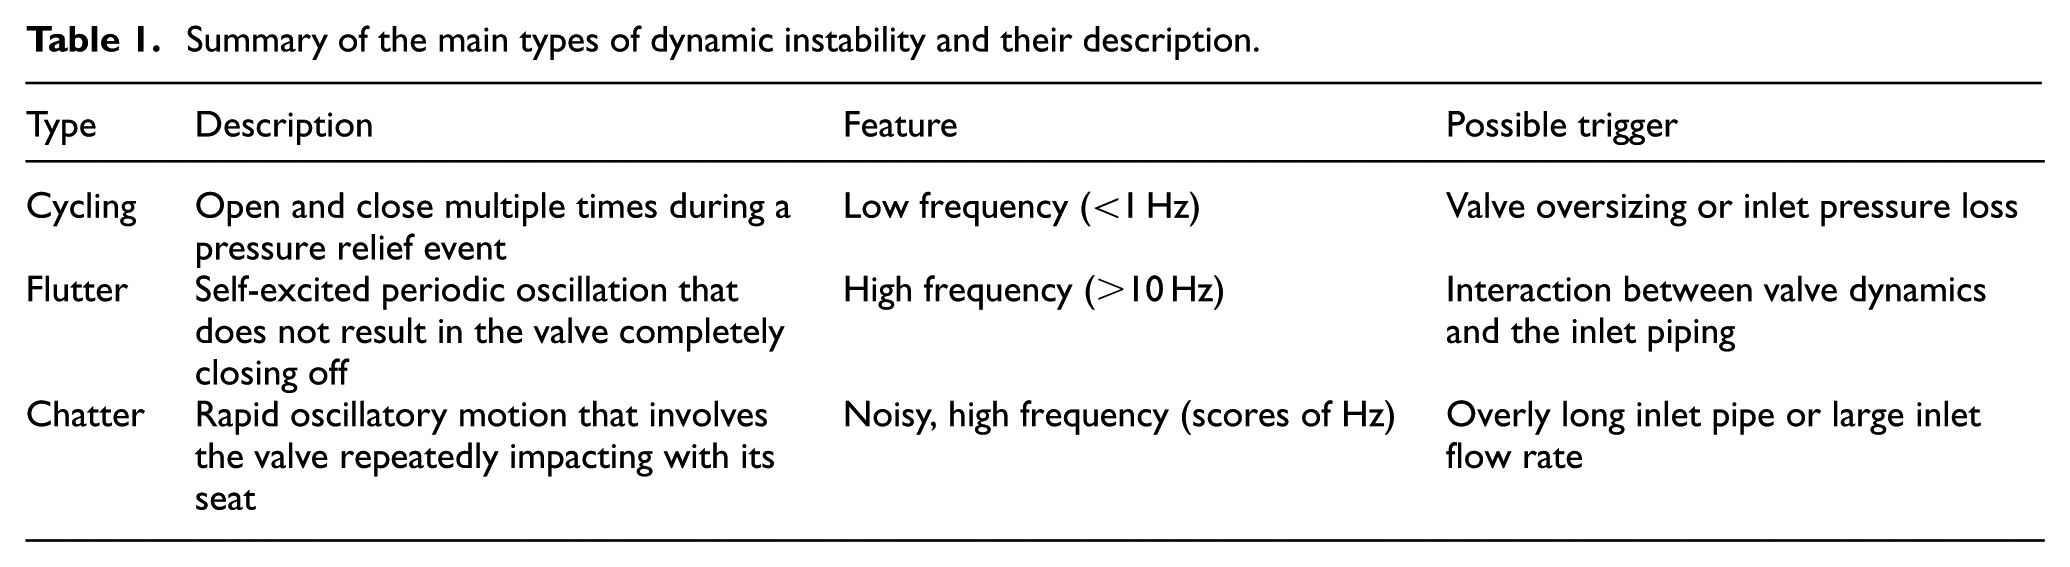
A certain pressure value between the set and closing pressure of PRV may not necessarily correspond to the stable equilibrium point between the spring force and the elevating force. A small change in disk position may lead to a change in the resultant force, resulting in the disk tending to the full opening or closing position. Such effect can be classified as “static instability.” 16 As shown in Figure 6, static instabilities can be observed at t = 5, 9.7, 48.6, and 61.3 s, while “dynamic instability” refers to the abnormal self-excited oscillation of the disk. As shown in Figure 7, the PRV has three different forms of dynamic instability: cycling, flutter, and chatter.17–19 The main types of dynamic instability are summarized in Table 1.

The forms of static instability.

The forms of dynamic instability.
Summary of the main types of dynamic instability and their description.
In order to analyze the influence of different flow rates on the instability characteristics of PRV, multi-stage output of pump flow is realized using the programmable multi-stage speed function of the frequency converter, which is 20, 30, 40, 50, and 60 L/min. Figure 8 illustrates the curve of pump outlet flow rate and pressure, indicating that the flow rate and pressure gradually increase.

The pump outlet flow rate and pressure.
Table 2 shows the instability characteristics of PRV at different set pressures and inlet pipe lengths summarized in the experiment.
The instability characteristics of PRV at different set pressures and inlet pipe lengths.

PRV: pressure relief valve.
No flutter instability was found in the experiment according to Table 2. Indeed, the flutter instabilities are virtually existent in the actual system. Although we have artificially separated three instability mechanisms, in an actual system they probably co-exist. For example, pressure and velocity oscillations during flutter might reach such large amplitudes that the valve pressure reaches blowdown pressure and cycling will also occur. Flutter may also rapidly translate into chatter. Such transitions can exhibit hysteresis.
Data analysis for typical stable conditions
The experimental data at the set pressure of 0.5 MPa and the inlet pipe length of 0 m are selected. Figure 9 illustrates the valve lift, velocity, and acceleration curves of PRV core in the stable condition. As one of the most important parameters to characterize the movement of the moving parts in the PRV opening process, the change of the valve lift can directly reflect whether the PRV is stable or not. It is shown that when the flow rate (see Figure 8) is low, the lift of disk is very small, and with the increase of the flow rate, the valve lift rises steadily and finally stabilizes at 5 mm. The velocity and acceleration of the disk are in the ranges of ±0.18 m/s and ±1.2 m/s2, respectively. It is shown that the PRV is basically in the stable discharge stage.

The valve lift, velocity, and acceleration of PRV in the stable condition.
Figure 10 illustrates the valve primary pressure curve of PRV in the stable condition. At low flow rates (see Figure 8), the PRV valve primary pressure of 0.5 MPa is quickly established, and the set pressure increases slightly with the increase of flow rate. In the steady flow stage, the valve primary pressure is basically stable and the pressure fluctuation only occurs in the flow transition stage.
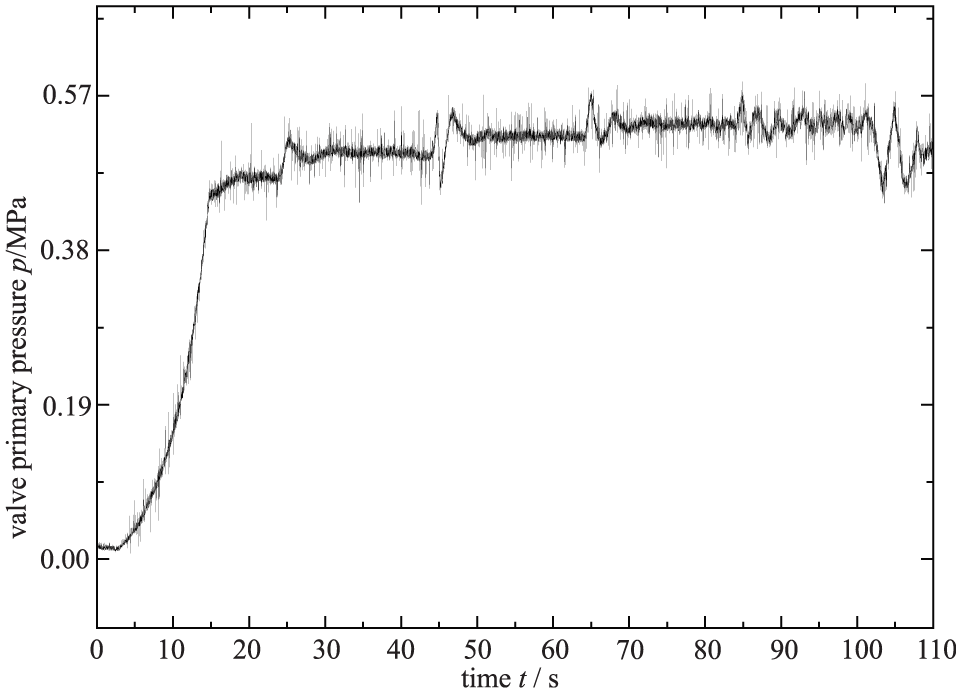
The valve primary pressure of PRV in the stable condition.
Data analysis for typical cycling instability
The experimental data at the set pressure of 0.1 MPa and the inlet pipe length of 0 m are selected. Figure 11 illustrates the valve lift, velocity, and acceleration curves of PRV under cycling instability. It is shown that when the flow rate is 40 L/min (see Figure 8), the lift of the disk oscillates during the overflow process, but the disk is not in contact with the valve seat, the oscillation frequency is 0.3 Hz, and the rest stage is the stable discharge stage. The velocity and acceleration of the disk are in the ranges of ±0.15 m/s and ±1.2 m/s2, respectively.

The valve lift, velocity, and acceleration of PRV with cycling instability characteristic.
Figure 12 illustrates the valve primary pressure curve of PRV in cycling instability condition. At low flow rates (see Figure 8), the valve primary pressure of 0.1 MPa is quickly established. When the flow rate is 40 L/min (see Figure 8), the oscillation of the disk at lift causes the fluctuation of valve primary pressure, and the oscillation frequency is 0.3 Hz.

The valve primary pressure of PRV with cycling instability characteristic.
Data analysis for typical chatter instability
The experimental data at the set pressure of 0.5 MPa and the inlet pipe length of 4 m are selected. Figure 13(a) illustrates the valve lift, velocity, and acceleration of PRV in the time domain during chatter instability. It is shown that the fluctuation of the displacement curve increases significantly, showing a wave-like oscillation. The disk hits the valve seat with a high frequency, which is extremely unfavorable to the sealing surface of PRV, easily causes damage to the sealing surface, and produces great noise. The valve lift, velocity, and acceleration of the disk increase with the increase of flow rate (see Figure 8) and finally reach 2.5 mm, 0.54 m/s, and 890 m/s2, respectively. The curve has obvious periodic features. Figure 13(b) shows the spectrogram of the measured signal. It is shown that the spectrum is characterized by a peak spectral curve with a uniform distribution, in which the fundamental frequency is 58.2 Hz.

The valve lift, velocity, and acceleration of PRV with chatter instability characteristic: (a) time domain and (b) frequency domain.
Figure 14(a) illustrates the valve primary pressure of PRV with chatter instability characteristic in the time domain. Figure 14(b) shows the spectrogram of the measured signal. It is shown that the spectrum is characterized by a peak spectral curve with a uniform distribution, in which the fundamental frequency is 58.2 Hz. There are resonance components at 118 and 176 Hz, and it has two and three times multiple relationships between the corresponding frequency and the fundamental frequency. With the increase of flow rate, pressure amplitude increases. The chatter instability of PRV causes fluid pressure fluctuation in the system and becomes the vibration source of the system. The frequent opening and closing of the disk and seat cause a change in fluid flow momentum, slight compression of the fluid, and deformation of the pipe material. The fluid will undergo significant pressure changes, causing damage to the piping and connecting parts. The additional pressure will be attached to the normal flow pressure in the pipeline, and the high-frequency pressure wave will be generated with the disturbance of pressure and velocity.
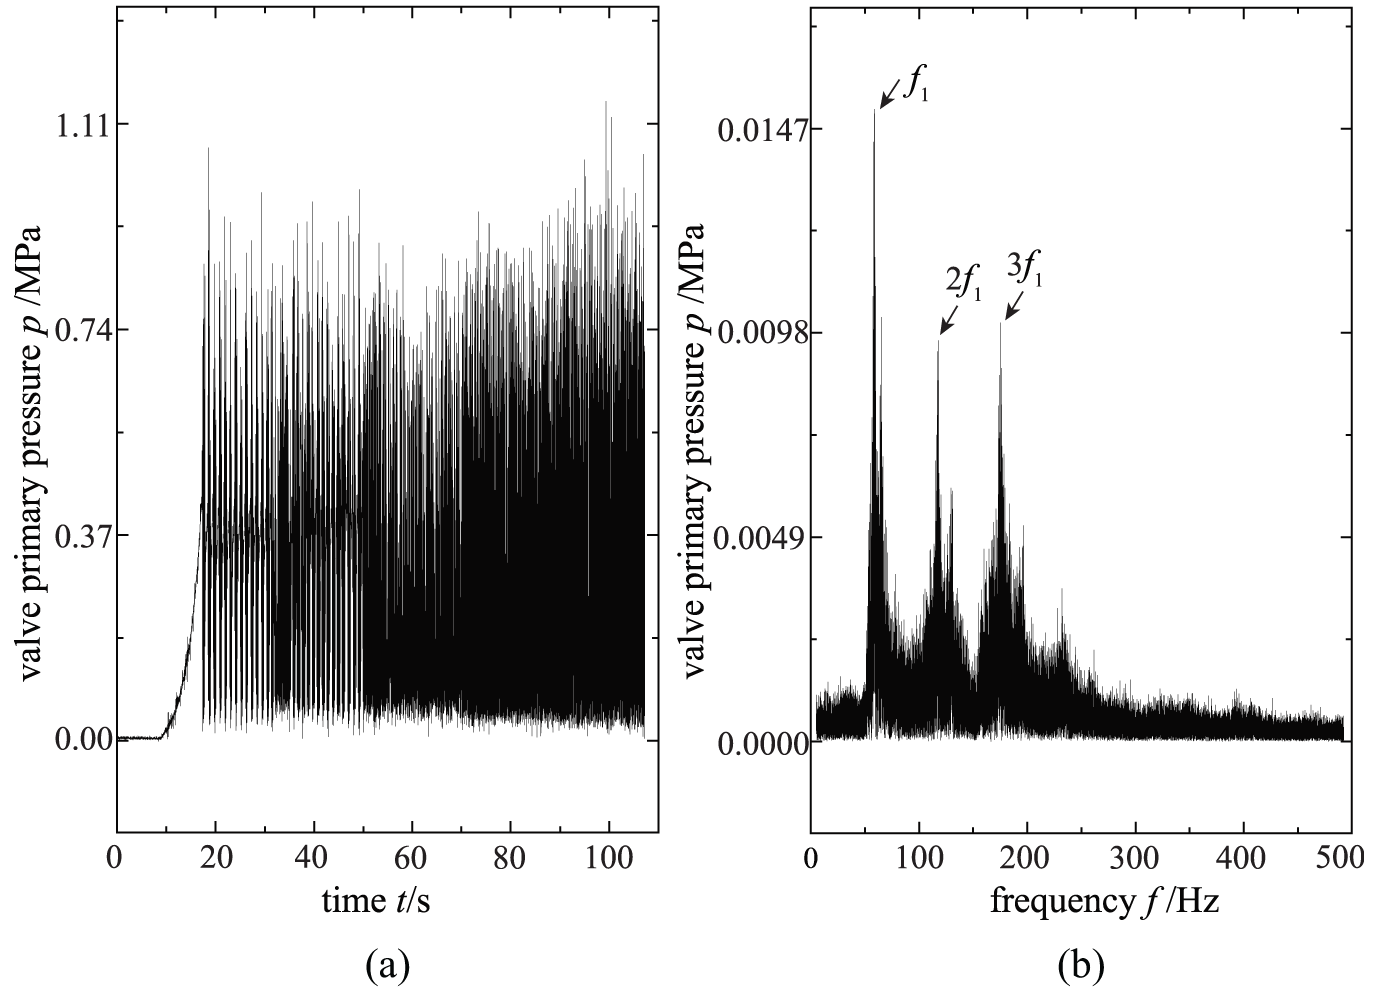
The valve primary pressure of PRV with chatter instability characteristic: (a) time domain and (b) frequency domain.
Stable boundary analysis
The 3% rule boundary
The authors conducted a qualitative analysis on the dynamic instability of PRV and concluded that excessive inlet pipe pressure drop, excessive inlet pipe length, or too small inlet pipe diameter will lead to unstable flow, thus causing chatter or flutter of the PRV.20–23 The PRV is vulnerable to unstable opening in this case. According to the qualitative analysis of the vibration mechanism above, it is assumed that the friction pressure loss of the inlet pipe does not exceed 3% of the set pressure in the stability condition, that is, the “3% rule stable boundary”

where Δpfric is the inlet pipe friction pressure loss and ps is the set pressure.
The pressure loss formula for fluid flow in a circular pipe24,25 is
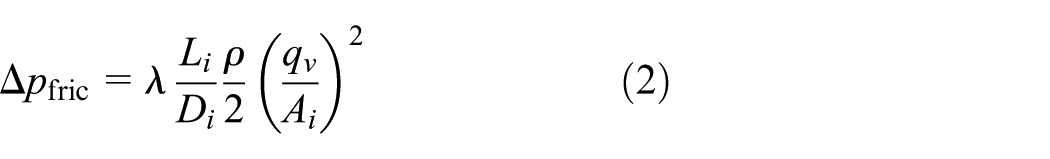
where λ is the Fanning friction factor, Li is the inlet pipe length, Di is the inlet pipe internal diameter, Ai is the inlet pipe area, ρ is the fluid density, and qv is the volume flow rate.
Then, the 3% rule stable boundary is

Figure 15 illustrates the stable boundary of the 3% rule at different set pressures.

The stable boundary of the 3% rule at different set pressures.
It is shown that the stable boundary of inlet pipe pressure drop is the function of inlet pipe length and volume flow rate. The larger the set pressure of PRV is, the larger the stable range is, that is, the critical inlet pipe length and critical volume flow rate increase with the increase of set pressure.
Quarter-wave model boundary
The presence of inlet pipe gives rise to the formation of acoustic standing waves, which can couple with the valve dynamics and result in dynamic instability. Typically, one encounters the first, quarter-wave, harmonic of the pipe, that is, a standing wave of wavelength that is four times the pipe length. The valve acts as a damper on the pipeline acoustic dynamics and the phase shift between the valve and the pipeline motion determines whether this damping is positive or negative. It is then possible to derive an approximate analytical expression for the flow rate at which this negative damping first arises.
The stable boundary was obtained as 26

where q is the driving mass flow rate, q = qm/qm,cap, δ is the spring pre-compression parameter,
The stable boundary can also be expressed as


The capacity mass flow rate qm,cap is defined as the mass flow rate qm passing through the valve at the pressure exceeding 10% of set pressure and the maximum disk lift

where p0 is the design pressure, p0 = 1.1ps, γ is the inlet pipe length parameter,
Table 3 shows the variable parameter values (see Appendix 1 for details) in the stable boundary condition of the quarter-wave model.
Dimensionless parameters for several set pressures.

Figure 16 illustrates the stable boundary of the quarter-wave model at different set pressures.

The stable boundary of the quarter-wave model at different set pressures.
It is shown that the stable boundary of the quarter-wave model is a function between the inlet pipe length and the volume flow rate. The greater the set pressure of the PRV is, the smaller the stable range is. When the volume flow rate is the same, for the PRV with fixed set pressure, the shorter the inlet pipe is, the more stable the PRV is. When the inlet pipe length is the same, the greater the volume flow rate is, the more stable the PRV is.
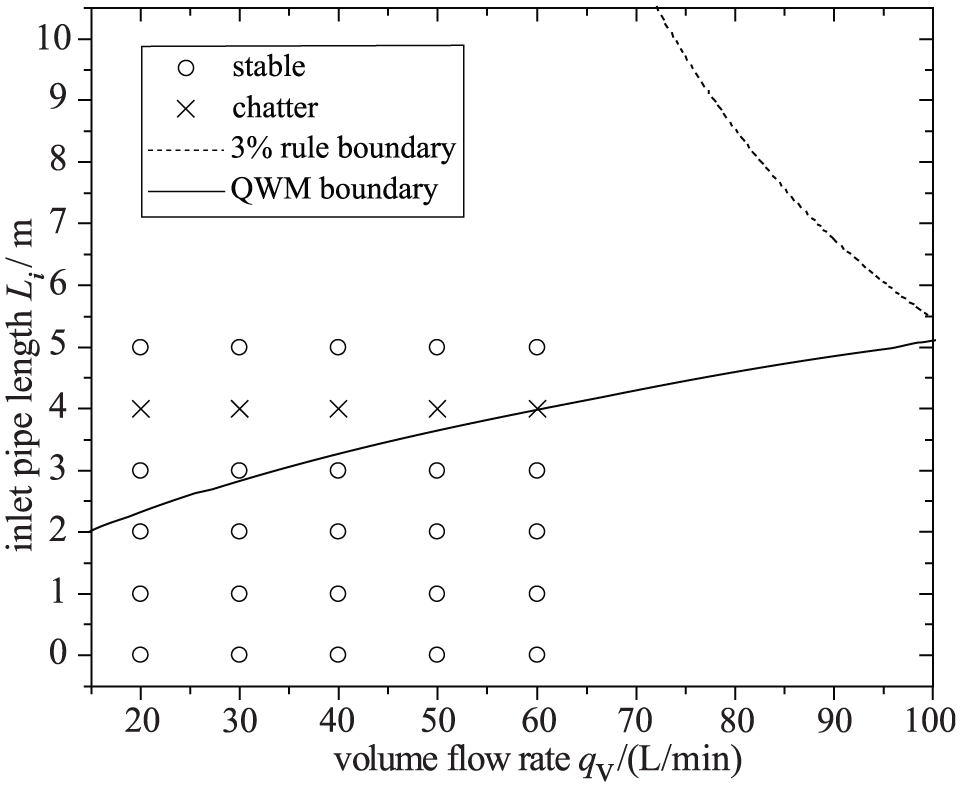
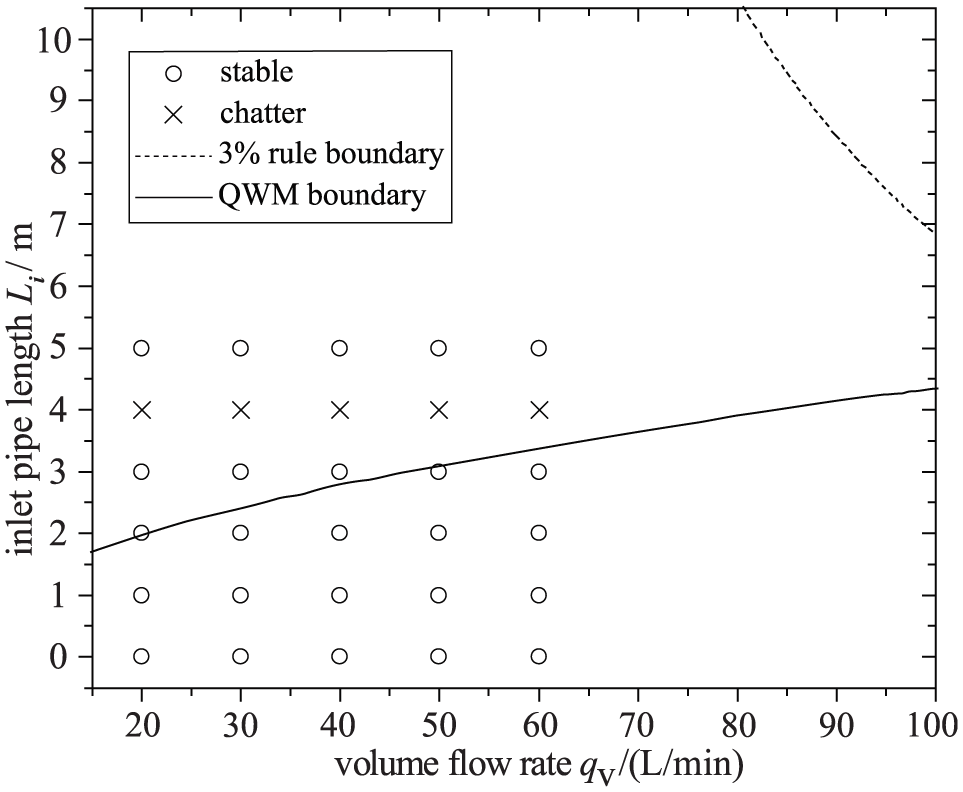
According to different set pressures, the dynamic instability characteristic and stable boundary of PRV are shown in Figures 17–21. Different symbols represent the measurement points: circles show test runs that are fully stable, plus signs are unstable (cycling), and x-type signs are unstable (chatter). Two theoretical predictions are presented for completeness, the dashed line shows the critical inlet pipe length corresponding to the 3% rule, and the solid line is the analytical boundary for the quarter-wave model. In both cases, the stability criterion is that the measurements should lie beneath these curves.

The dynamic instability characteristic and stable boundary at the set pressure of 0.1 MPa.

The dynamic instability characteristic and stable boundary at the set pressure of 0.2 MPa.

The dynamic instability characteristic and stable boundary at the set pressure of 0.3 MPa.
The dynamic instability characteristic and stable boundary at the set pressure of 0.4 MPa.
The dynamic instability characteristic and stable boundary at the set pressure of 0.5 MPa.
Figure 15 shows the trend of the critical pipe lengths computed according to the 3% rule stable boundary. It is important to note that the 3% rule stable boundary predicts that the critical pipe length should increase with set pressure, whereas the real tendency is just the opposite. The 3% rule stable boundary is designed to avoid instability due to inlet pressure drop, but it is unsuitable to predict any other instability type. As an example, change in inlet pipe diameter plays only a marginal role in the quarter-wave instability as it does not affect the wavelength of the quarter wave. Yet, the allowable pipe length according to the 3% rule changes heavily with the pipe diameter (for constant flow rate). Nevertheless, the 3% rule limits the inlet piping length, so its application might result in pipe lengths that are short enough to avoid quarter-wave coupling, but such cases are merely coincident. Indeed, the 3% rule is sufficient to avoid severe valve oscillations in the case of an inlet pipe diameter equal to that of the PRV inlet, but it is not sufficient.
We also depict the trend of the quarter-wave model stable boundary upon varying set pressure as shown in Figure 16. We found that, the higher the set pressure, the lower the critical pipe length for stability. This trend was also found in experimental tests. The quarter-wave model boundary provides a good explanation of the trends in the experimental data.
In our previous work, 27 we reported that, for high flow rates, the valve is stable, which, upon decreasing the flow rate, loses its stability via a Hopf bifurcation. A non-impacting oscillation occurs, the amplitude of which increases with decreasing the flow rate, and once the valve disk reaches the seat impacting periodic orbit occurs, the amplitude of which decreases with decreasing flow rate. Finally, for very low flow rates, chaos-like impacting motions were observed. Our future plan is to analyze hybrid motion consisting of flow rate, impacting, set pressure, inlet pipe, and outlet pipe. Obviously, laboratory measurements are also needed to verify the theoretical and numerical results.
Conclusion
This article places emphasis on the dynamic instability of PRV. The experimental platform for instability characteristics is designed. The experimental scheme of instability characteristics is formulated to obtain the characteristic curve of the measured elevating force and differential pressures between the valve inlet and outlet. The programmable multi-stage speed function of a frequency converter is used to realize the multi-stage output of pump flow and study the influence of flow rate, set pressure, and inlet pipe length on the instability characteristic of PRV. Through the analysis and comparison of the lift characteristic experimental results of PRV, the following conclusions are drawn:
In the stable condition, the lift of the disk increases steadily with the increase of flow rate. In cycling instability, low-frequency oscillation occurs in the overflow process of the disk, but the disk does not come into contact with the valve seat. The oscillation frequency f < 1 Hz, the velocity of the disk is in the range of ±0.15 m/s, and the acceleration is in the range of ±1.2 m/s2. In chatter instability, the disk hits the seat with high frequency and produces great noise. The lift, velocity, and acceleration of the disk increase with the increase of flow rate, which finally reach 2.5 mm, 0.54 m/s, and 890 m/s2, respectively.
The stable boundary of the 3% rule is the function between inlet pipe length and volume flow rate. The critical inlet pipe length and critical volume flow rate increase with the increase of set pressure. The stable boundary of the quarter-wave model is a function of inlet pipe length and volume flow rate, and the greater the set pressure of the PRV is, the smaller the stability range is. For the PRV with fixed set pressure, the shorter the inlet pipe is, the more stable the PRV is when the volume flow rate is the same, and the greater the volume flow rate is, the more stable the PRV is when the inlet pipe length is the same.
Footnotes
Appendix
Operational characteristics.

| Name | Description |
|---|---|
| Set pressure (or called opening pressure) | The inlet pressure at which the valve begins to open. For liquid service, set pressure is defined as the pressure at which the first vertical steady stream of liquid appears |
| Back pressure | The static pressure existing at the outlet of a PRV due to pressure in the discharge system |
| Closing pressure | The value of decreasing inlet static pressure at which the valve disk re-establishes contact with the seat or at which lift becomes zero |
| Primary pressure | The pressure at the inlet in a PRV |
| Relieving pressure | Set pressure plus overpressure |
| Blowdown | The difference between the actual set pressure of a PRV and the actual closing pressure |
| Overpressure | A pressure increase over the set pressure of a PRV |
Handling Editor: Xiaoxiao Han
Declaration of conflicting interests
The author(s) declared no potential conflicts of interest with respect to the research, authorship, and/or publication of this article.
Funding
The author(s) disclosed receipt of the following financial support for the research, authorship, and/or publication of this article: This work was supported by the Fundamental Research Funds for the Central Universities of China (No. FRF-TP-17-026A1), the General Financial Grant from the China Postdoctoral Science Foundation (No. 2017M620621), and the National Natural Science Foundation of China (No. 51774019).