
Abstract
A 203 m-high concrete gravity dam is a huge structure for which the dynamic responses, damage mechanism, and safety evaluation under an intense earthquake need to be investigated carefully and in detail. This article presents the results of the dynamic failure model test on the overflow section of the aforementioned dam. It presents the seismic characteristics, failure mode, and safety evaluation for the overflow section during a strong earthquake. Two models of the dam section have been tested on the shaking table to simulate earthquake effects in a laboratory. The first model considers the Chinese code seismic wave, while the second model considers the Wenchuan seismic wave, a natural wave. The peak ground acceleration (PGA) of the first crack during testing determines the seismic safety level of the dam, and the locations and forms of cracks at the end of testing indicate the vulnerable areas of the dam under two kinds of earthquake inputting. After the final analysis, the results of the experimental works for the overflow during an earthquake offer an important reference for engineering designers working on anti-seismic design.
Keywords
Introduction
It is well known that China is one of the biggest energy consumers in the world and is also leading the production of energy. Many dams have been built in order to provide hydroelectric energy. It is also known that dam concrete is a material with low tensile strength, and concrete structures are prone to cracks easily. The cracks in concrete structures usually result from microcracks and from crack propagation to extensional cracks. Thus, studying the damage behavior of a concrete gravity dam is imperative for monitoring a concrete dam’s safety and stability.
Based on the Wenchuan earthquake in China and the Fukushima earthquake in Japan, both of which occurred in recent years, we have learned that major civil structures located in seismic zones must be subjected to seismic investigations. As it is well recognized that strong earthquakes cause catastrophic damages, preventing the occurrence of such earthquake hazards by analyzing the seismic performance of civil structures such as dams is necessary.1–4 Moreover, dams are naturally critical structures that should be made earthquake-resistant, given that earthquakes cause severe damages and consequently enormous losses to life and the economy.1,5
Historically, high concrete dam accidents are rare, but their failure may cause severe economic problems and are harmful to human safety. Therefore, it is important to evaluate the safety and stability of high concrete dams under earthquakes, which are one of the major causes of a dam failure. Examples of dam accidents in history are the accidents at the Koyna dam in India, Malpasset dam in France, Pacoima dam in the United States, Tamworth dam in Australia, Kolnbrein dam in Austria, and Hsinfengkiang dam in China.3,6
At present, there are three methods to study the effects of earthquakes on the concrete dam, namely, on-site observation, numerical simulation analysis, and model test research. As on-site observation is difficult, there are few reports on this method. Fu et al. 7 performed borehole video tests on the Huaguangtan dam and its foundations to research the diosmosis of self-contained cracks under different working cases. The results from the prototype observation showed that high uplift pressure did not constitute a direct threat to the dam’s safety.
With the development of the finite element method (FEM), numerous researchers have used the FEM to simulate a concrete dam’s behavior under strong ground motion.8–18 Because different studies adopt different finite element models, material constitutions, seismic input, and unavoidable simplifications in the numerical analyses for the dynamic characteristics of concrete dams, the research results vary widely. Therefore, model test research must be carried out to verify and supplement the numerical analysis method. Many experimental works on seismic damage behavior of concrete dams have been conducted in China and other countries over several decades.19–31 It is worth mentioning that Y Chen et al. 32 carried out the model failure test of the Shapai roller compacted concrete (RRC) arch in China and obtained the anticipated effect of induced joints to reduce tensile stress, cracking process, failure pattern, and mechanism of the arch dam, and confirmed the engineering design and construction of the arch dam, which survived the Wenchuan earthquake without suffering any damage.
The concrete gravity dam, that is the subject of our study, is located in the Southwest of China in Yunnan Province. This area is claimed to be an active seismic zone where earthquakes of high intensities are frequent. Thus, a dam designed or constructed in this area must be submitted to seismic investigations in order to determine its seismic behavior and consequently evaluate its safety.
In this article, we present all the steps for the experimental study of seismic damage behavior of the overflow section for a 203-m high concrete gravity dam. The dynamic characteristics, seismic responses, and failure mechanism have been reported for the overflow of the gravity dam. The seismic input waves involved here are the Chinese code wave and Wenchuan wave. This article begins with a short description of the dam structure, and then the model dam’s material properties and similitude rules are exposed. Finally, the analyses of the dynamic failure model tests are presented for the overflow section of the high gravity dam.
Description of the dam structure
The hydropower station is designed to be located on the main stream of Lancang River (also known as Mekong River) in Lanping county, Yunnan province. The dam’s base will be lying on the Lancang River upstream of Panying Town to Miaowei River. The project connects two hydropower stations on the Lancang River: the Tuoba hydropower station and the Dahuaqiao hydropower station. It is approximately 14 and 631 km away from Yingpan Town and Kunming Town, respectively.
The main function of this water conservancy and hydropower project is to produce electricity. In addition, it provides flood control and irrigation. The key project consists of a concrete gravity dam, surface outlets on the dam for flood discharging and vent clamping, left bank line including inlet, and an underground water power generation system. The reservoir’s normal pool level is 1619 m and its corresponding capacity is 1.418 × 10⁹ m3. The exceptional flood level is designed to be 1622.72 m with a total reservoir storage of 1.500 × 10⁹ m3. The installed capacity of the power station is 1900 MW and the guaranteed output is 507.95 MW with an annual energy output of 8.629 × 10⁹ kW h.
The elevations of the dam crest and base are 1625 and 1422 m, respectively. The highest length of the dam is 203 m, and the crest length is 464 m. The dam is divided into 20 monoliths. The design peak ground accelerations (DPGA) in the horizontal and vertical directions are 0.251g and 0.160g for earthquakes, respectively.
To investigate the dynamic characteristics, seismic responses, and failure mode of the overflow section with dynamic failure model test, only the 10# section, which is one of the highest parts of the dam, is considered, as shown in Figure 1.

Sketch of scaled model dam for the overflow section (unit: m for prototype, cm for model).
Similitude rules and model material
Similar scale requirement
For limitation of the bearing capacity and size of a shaking table, the model dam is designed by scaling down the geometric and material properties from the prototype structure. Based on the similarity theory, the basic model similitude rules that are generally known were established. The dynamic behavior of a structure can be described by three basic quantities, that is, the geometrical scaling parameter Sl, the scaling parameter of the elastic modulus SE, and the acceleration scaling parameter Sa. As the two models are in the same gravity field, the three well-known basic similarity laws can be given in the following equations


where St, SS, and Sρ represent the time scaling parameter, the stress scaling parameter, and the density scaling parameter, respectively.
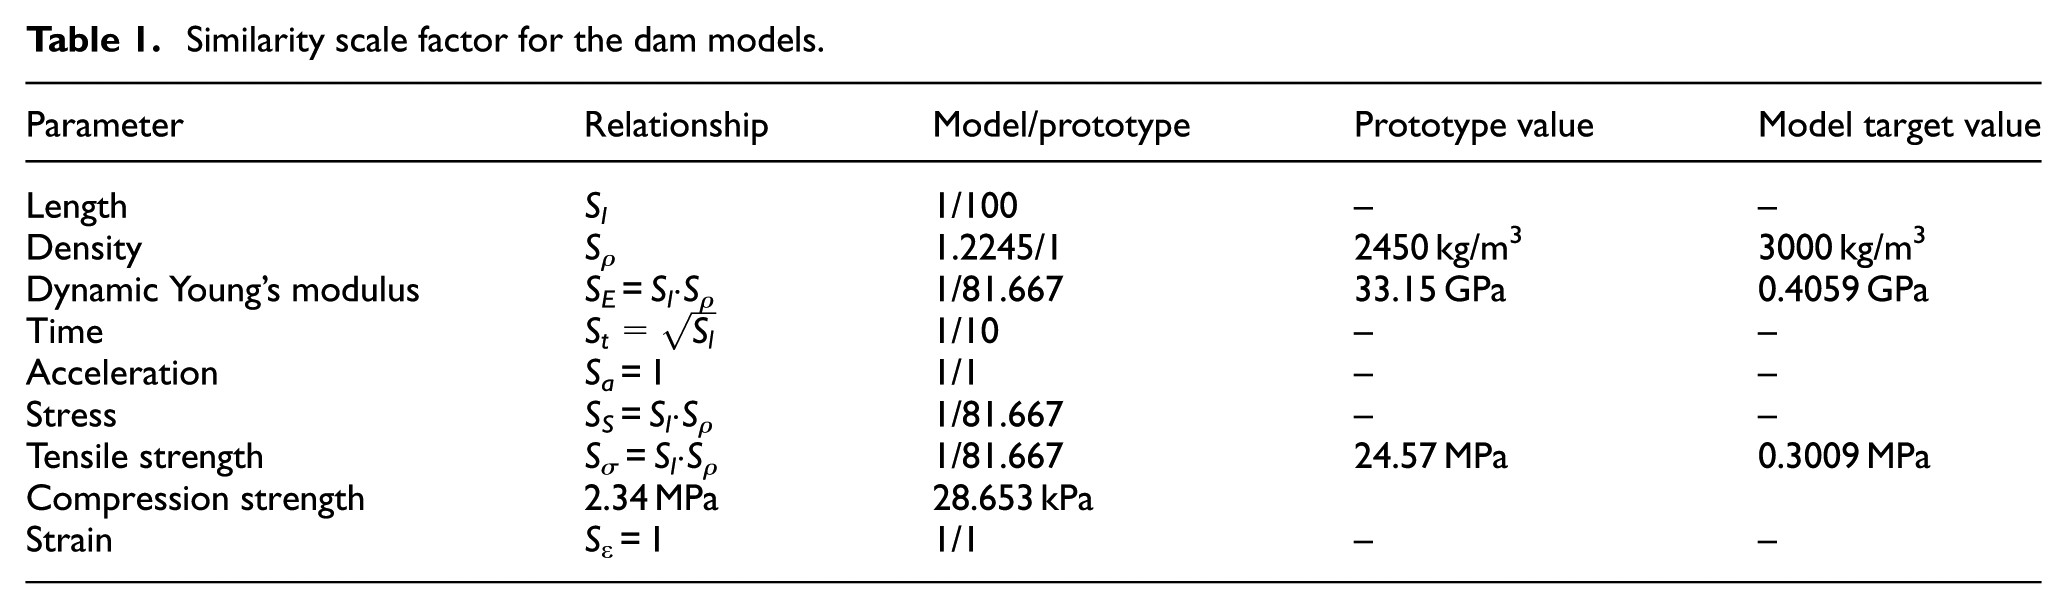
According to the bearing capacity and size of the shaking table in State Key Laboratory of Coastal and Offshore Engineering at Dalian University of Technology, China, the geometrical scaling parameter Sl is chosen as 1/100, and the SE parameter was obtained from the density scaling parameters Sρ and Sl. The acceleration parameter Sa is selected to be 1. It is clear that the previous parameters are completely justified only if the model works in the elastic state, which may be considered as exhausted when the first cracks appear. 5 In this case, the nonlinear properties of the materials and structural discontinuities of the concrete dam must be considered.5,22 On this basis, Table 1 presents the main scaling parameters and physical and mechanical parameters required for the model material.
Similarity scale factor for the dam models.
Model material requirement for test
According to the main scaling parameters in Table 1, a fine aggregate model material containing a small amount of cement is used in the test. Then, the concrete elements were modeled with fine aggregates. The material proportions of the fine aggregate model material are listed in Table 2. The material tests are carried out for mechanical parameters of the fine aggregate concrete, as shown in Figure 2. The dynamic elasticity modulus of the fine aggregate model material is 0.4 GPa based on the knocking cantilever beam test; its compressive strength is 0.3 MPa based on the uniaxial compression test; its tensile strength is 0.029 kPa based on the four-point bending test; and its density is 3000 kg/m3.
Proportions of ingredients used for the fine aggregate model material.

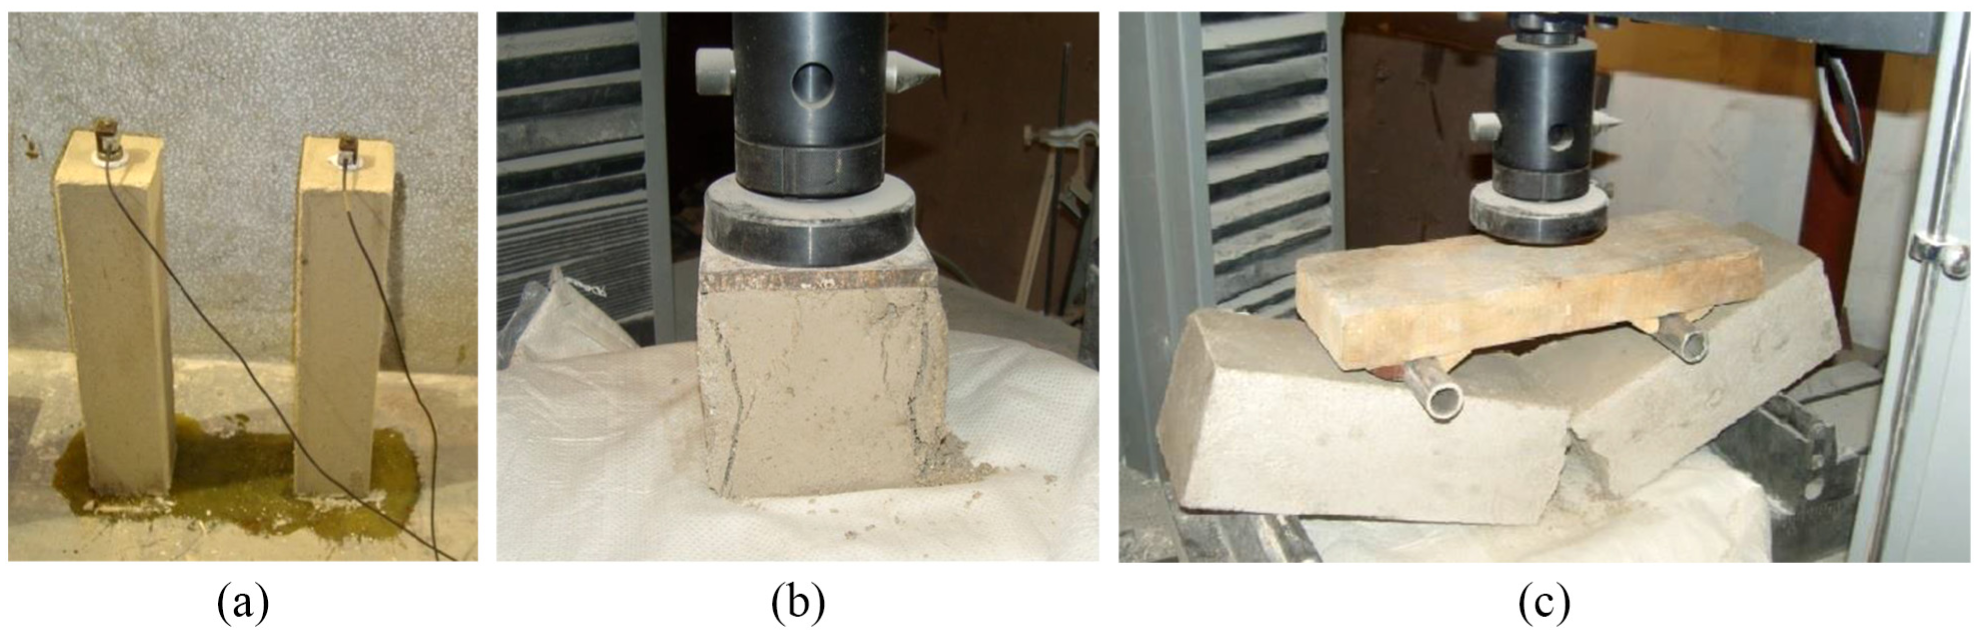
The model material tests for mechanical proportions. (a) knocking cantilever beam test for the dynamic elastic modulus of model material, (b) uniaxial compression test for the compressive strength of model material, and (c) four-point bending test for the tensile strength of model material.
Dam model experiment
Test equipment, model production, and instrumentation
Shaking table test has been widely used to investigate the dynamic behaviors of structures under earthquake excitations. The dynamic dam model test was conducted by using the shaking table facility at the State Key Laboratory of Coastal and Offshore Engineering at Dalian University of Technology, China. The shaking table with a digital control can input three-dimensional (horizontal + vertical + pitch) and six degree-of-freedom (DOF) motion. Its drive mode is electric–hydraulic servo mode. The dimension of the working area of the shaking table is 3 m × 3 m, and the maximun load capacity is 10 t. The maximum horizontal displacement, velocity, and acceleration are ±75 mm, 50 cm/s, and 1.0g, respectively, while the maximum vertical displacement, velocity, and acceleration are ±50 mm, 35 cm/s, and 0.7g, respectively. The shaking table is able to vibrate with frequency ranges from 0.1 to 50 Hz. Its maximum center distance and eccentricity are 1.0 m and 0.5 m, respectively.
According to the structural drawing of the overflow section of the gravity dam in Figure 1, the model structure is designed to meet the geometric scale of 1/100. The mass of the model is 3000 kg. Figure 3 shows the model installation on the shaking table. The overview of the dam model after the fabrication of the model for the overflow section is shown in Figure 4. The dam model is firmly mounted on the shaking table through bolt connections in order to ensure an effective transmission of the input motion to the base of the model structure.

Model installation.

The overflow section model after the fabrication.
This study mostly focused on the dynamic responses, damage mechanism, and safety evaluation for overflow section of the dam under the action of two seismic waves. Therefore, two sets of the model for overflow sections are tested on the shaking table for 10 days.
To simulate the effect of reservoir water on the dam section under the earthquake, a tank with a size of 6.0 × 0.8 × 2.2 m3 is installed on the water side of the dam section model. The tank is filled with water till the designed height, and the water body vibrates together with the model dam to simulate the dam–reservoir interaction in the testing. The complete set of models for the overflow section and reservoir coupling system is shown in Figure 5.

Overview of the model dam.
The accelerations are measured by accelerometers, and the strains are measured by strain gauges. There are no direct sensors for displacement measurement. The displacements will be obtained by integrating twice the accelerations. The arrangement of the accelerometers is presented in Table 3 and Figure 6. For the two model tests, eight accelerometers are used. Among them, six measure the horizontal acceleration and two measure the vertical acceleration. For strain gauges, there are 10 for each model, among which the strain rosette is used to measure the maximum tensile strain of No. 5 position. The arrangement of the strain gauges is shown in Figure 6. For data acquisition, a computer-controlled data acquisition system named digital signal processor system (DSPS) has been used. For further analysis and data treatment, the test data are transferred to other computers. The data acquisition system is presented in Figure 7.
Arrangement of the accelerometers for the two model tests.

AC: accelerations at crests.

Arrangement of the sensors for models 1# and 2#.
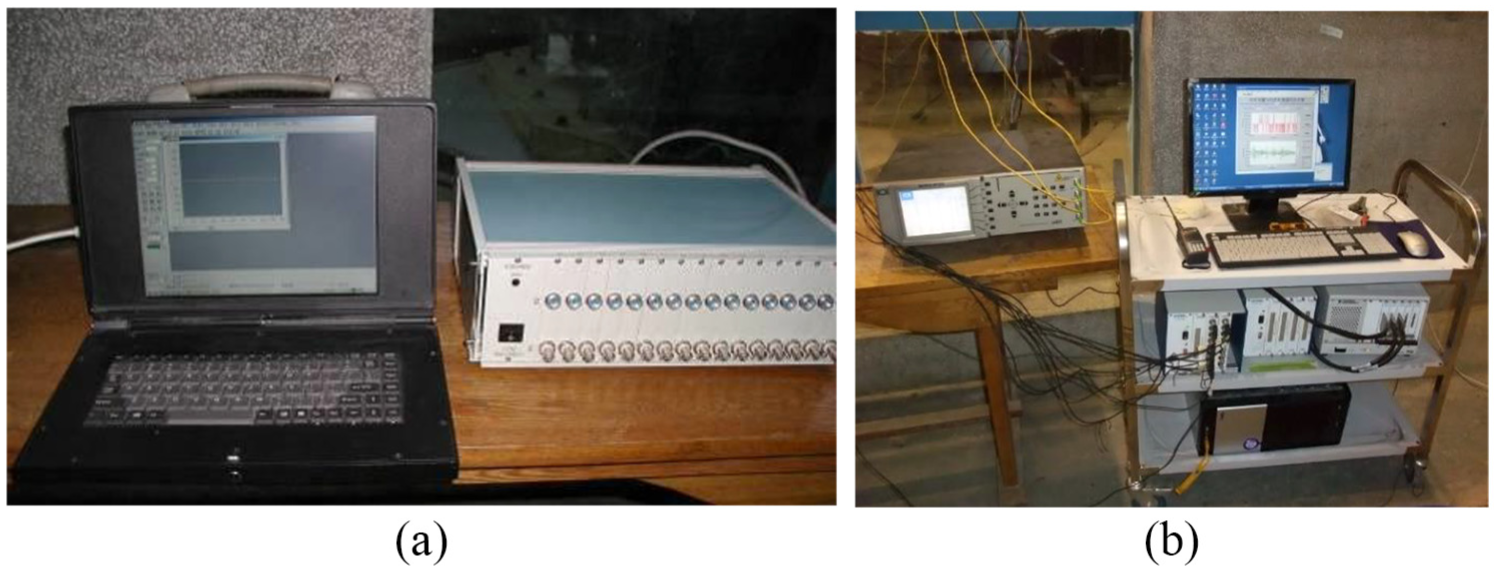
Data acquisition system: (a) data acquisition and processing system, and (b) strain data collecting instrument.
Test program
To decide the earthquake inputs for a dynamic test, the nature of the site soil is one of the most important factors. According to the spectral density properties of type-a site soil, the earthquake wave in Code for Seismic Design of Hydraulic Structure in China 33 is adopted to excite model 1# for the first test, while the Wenchuan wave is chosen to excite model 2# for the second test. The Chinese code earthquake wave is an artificial wave and the Wenchuan wave is a natural one. Figures 8(a) and 8(b) shows the Chinese code seismic wave and Wenchuan seismic wave, respectively. The response spectra of Chinese code seismic wave and Wenchuan seismic wave are drawn in Figure 9.

Inputting seismic waves: (a) Chinese code seismic wave and (b) Wenchuan seismic wave.
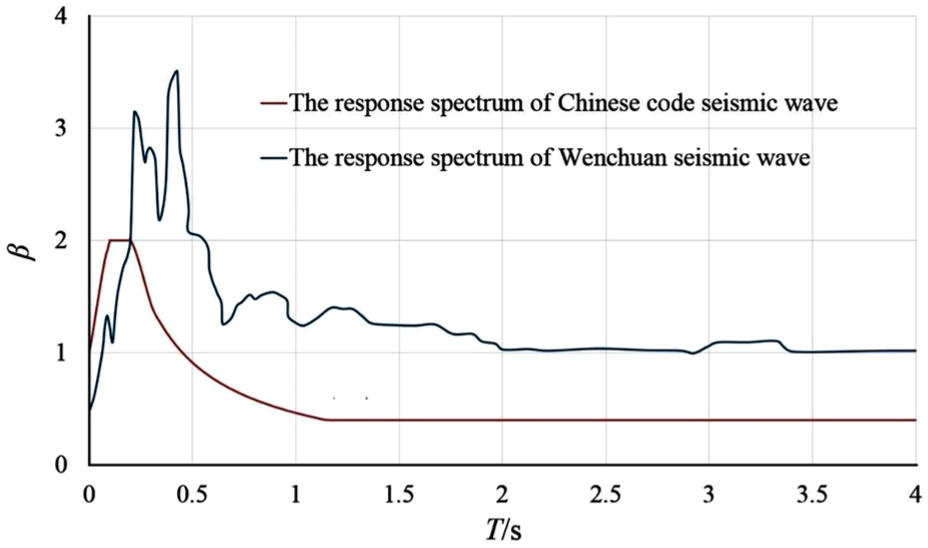
The response spectrum of Chinese code seismic wave and Wenchuan Seismic wave.
The integrity of the dam is examined through the responses excited with a white noise input of 0.05g at the beginning of both tests. The white noise input wave also allows us to determine the natural frequencies of the model dams. Then, the seismic waves of gradually increasing amplitudes are inputted successively in the manner of a time-scaled earthquake wave into the shaking table system. From the scaling factors in Table 1, where the time scaling factor is 1/10, the frequency scaling factor is 10. A series of tests is adopted for models 1# and 2#, as presented in Table 4. The shaking table is used to excite the models in horizontal stream and vertical directions. The peak ground acceleration (PGA) of vertical direction is 2/3 that of horizontal stream direction.
The series of tests for models 1# and 2#.

PGA: peak ground acceleration; AC: accelerations at crests; DPGA: design peak ground accelerations; WN: white noise; SW: seismic wave.
Experimental results and analysis
Frequency analysis
The fundamental/natural frequency of large hydraulic structure has a significant effect on its dynamic response. The natural frequencies of the models under various levels of earthquake inputting are obtained according to the Transfer Function (TF), which is obtained by dividing the Fourier amplitude response spectrum of the acceleration history of the model crest by that of the motion inputting from platform.
The white noise input of 0.05g has been used in the two tests in order to obtain the natural frequencies of the overflow section models under empty and full reservoir conditions. The natural frequencies are 27.1/26.0 and 27.6/26.2 Hz for models 1# and 2#, respectively, which are excited by the white noise input with the PGA of 0.0568/0.0574g and 0.0647/0.0748g under empty/full reservoir conditions, respectively.
In the course of the two tests, the natural frequency changes of models 1# and 2# under earthquake input are shown in Figure 10, respectively. The natural frequency changes of both models are very small under the excitation of their respective first four levels of earthquake input. That is, there is no obvious damage to models 1# and 2# under the earthquake input with the PGA of 0.334g and 0.306g, respectively. The natural frequencies of models 1# and 2# are obviously reduced under 1#SW5 and 2#SW4, respectively. This means that models 1# and 2# have been significantly damaged under the earthquake input with the PGA greater than 0.343g and 0.316g, respectively. Although the damage is barely visible, both models have received cracks. After the earthquake inputs for the first and second tests reach 0.371g and 0.342g, respectively, the natural frequencies of both models decline rapidly.
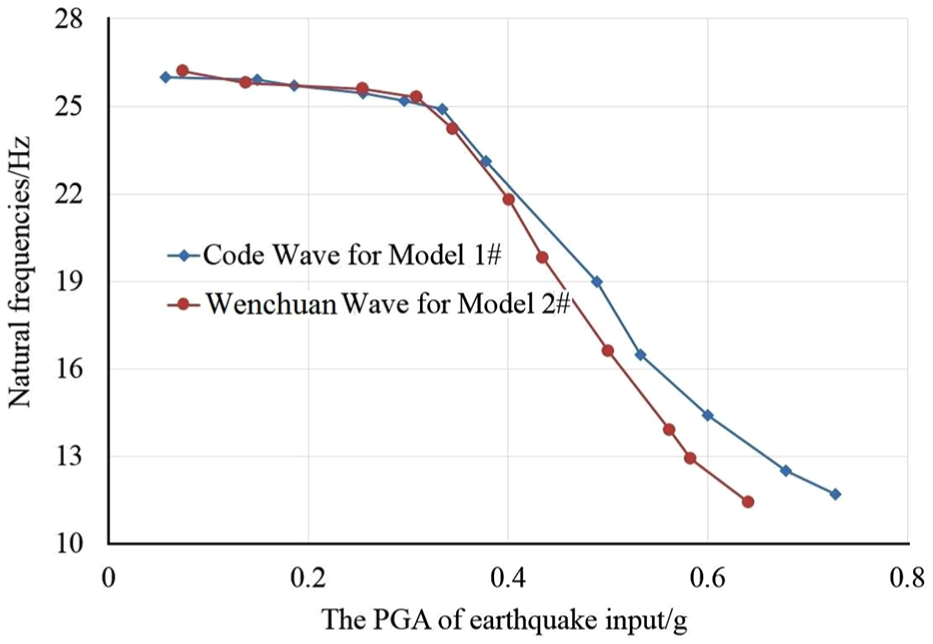
Variation of the natural frequencies of the models 1# and 2#.
As the seismic level increases, the frequency reduction of model 2# is earlier than that of model 1# under seismic input. This indicates that the Wenchuan earthquake wave is more likely to damage the dam than the code earthquake wave in China. At the end of the two tests, the natural frequencies dropped considerably as the models are completely damaged and are 11.7 and 11.4 Hz for models 1# and 2#, respectively. It can be seen that the Wenchuan seismic wave, a natural seismic wave, is more likely to damage the gravity dam than the Chinese code seismic wave. Therefore, more attention should be paid to the damage of dam caused by earthquake at the dam site.
Responses of acceleration
For concrete gravity dam, the acceleration along dam height from the bottom to top is amplified during earthquakes. The acceleration magnifications along the heights of both models under each load case are shown in Figures 11 and 12, respectively.

The acceleration magnifications along the height of model 1# during testing.
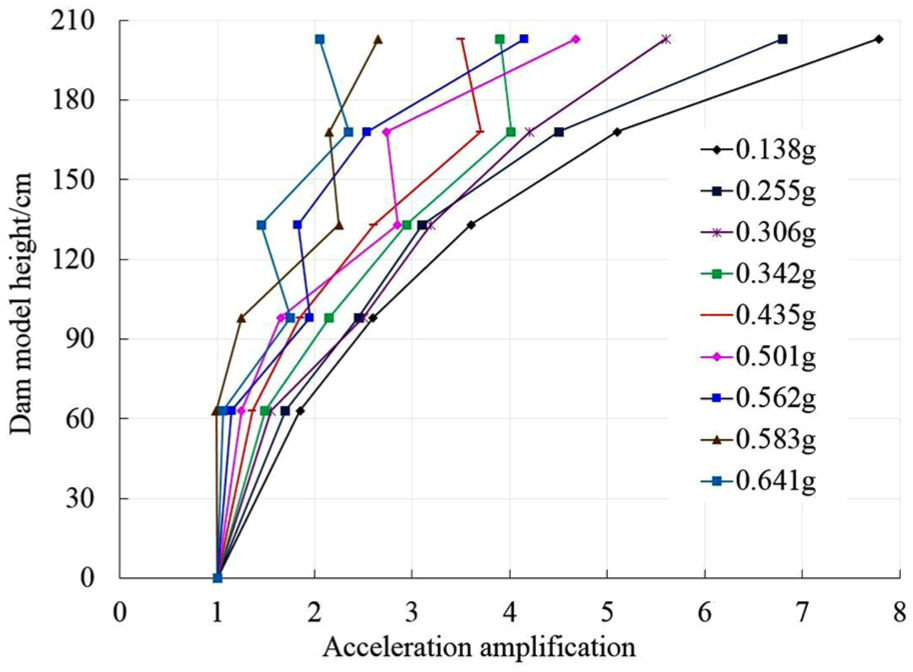
The acceleration magnifications along the height of model 2# during testing.
According to Figure 9, the representative value of response of the Wenchuan earthquake response spectrum is larger than that of the response spectrum of code earthquake wave. Therefore, the acceleration magnification on model 2# is generally larger than those on model 1# in the two tests in Figures 11 and 12.
As shown in Figures 11 and 12, with the increase of levels of earthquake inputs, the responses of accelerometers on each dam model for overflow section can be seen in the linear and nonlinear levels. Under the earthquake inputs of the first four levels in Table 4, the acceleration magnifications on both models increase linearly along the heights of the models and decrease with the enhancement of earthquake inputs. When the PGA of input earthquake for models 1# and 2# reach respectively 0371g (1#SW6) and 0.342g (2#SW5) in Table 4, the PGAs at crests (AC7) of both models are less than those at the necks (AC6) of both models due to the positions of changed slope of downstream surfaces (Strain gauge 7) or the bottoms of upstream surfaces of sluice piers (Strain gauge 4) cracking. The models step into the experimental stage of nonlinear vibration at this time.
During the testing of load cases from 1#SW6/2#SW5 to 1#SW7/2#SW7 for the two models, respectively, the PGAs recorded by four accelerometers (from AC2 to AC6) at the lower part of both models increase along the heights of both models, but the PGAs recorded by accelerometers (AC7) on the top of both models are decreased suddenly. This indicates that there are cracks in the necks of both models (the positions of changed slope of downstream surfaces or the bottoms of upstream surfaces of sluice piers) and the cracked area is just above AC6.
The PGAs recorded by two accelerometers (AC6 and AC7) on the upper part of both models are abrupt changes under load cases 1#SW8-11/2#SW9-11, respectively, and there are no change laws to follow. This indicates that there are penetrating cracks above AC6s of both models, where is weak part of the overflow section for earthquake.
Cracking responses and failure mode
Before the appearance of a visible crack, the plastic deformation of the models is indicated by changes of natural frequencies, accelerations along the models’ heights, and tensile strains; however, this is not obvious. Some cumulative damage occurs in the model before first cracking acceleration.
The damage developing patterns of both models during the two tests are listed in Table 5. For both models of the overflow section, the most vulnerable part is the position of changed slope of downstream surfaces or the bottoms of upstream surfaces of sluice piers. This is consistent with the research conclusion given in Figures 11 and 12 in the Responses of acceleration of this paper.
Cracking responses of the two models under each level of earthquake input.


Failure modes of model 1# while inputting Chinese code seismic wave: (a) PGA of earthquake input is 0.37g, (b) PGA of earthquake input is 0.489g, (c) PGA of earthquake input is 0.533g, and (d) PGA of earthquake input is 0.600g.

Failure modes of model 2# during inputting Wenchuan seismic wave: (a) PGA of earthquake input is approximately 0.4g, (b) PGA of earthquake input is 0.435g, (c) PGA of earthquake input is 0.501g, and (d) PGA of earthquake input is 0.562g.
According to Table 5, there are no visible cracks in models 1# and 2# under the action of the earthquake input with the PGA of 0.149 ∼ 0.334g and 0.138 ∼ 0.306g, respectively. As the PGA of earthquake input reached 0.371g/0.342g, the first crack for both models appeared at the bottoms of upstream surfaces of sluice piers. The dynamic response of the prototype can be obtained by using the scaled parameters listed in Table 1.
The level of the PGA is an important index for assessing the safety of overflow section subject to earthquakes. The DPGA of the gravity dam is 0.251g, so the overload acceleration coefficients of overflow section of the dam are, respectively, 1.45 times and 1.33 times under the Chinese code seismic wave and the Wenchuan seismic wave. This indicates that the overflow section is safe enough under a strong earthquake wave, and the overflow section is more dangerous under the action of the Wenchuan seismic wave.
Responses of the strains and displacements
The maximum tensile strains and damage descriptions at different locations of the two models during the testing are listed in Table 6. It can be seen that the larger values of maximum tensile strains are measured by the strain gauge Nos 4, 5, 7, and 9. According to the maximum strains of gauge No. 5 of the two models, the penetrating crack passes near the location of gauge No. 5 (strain rosette). The positions of 4, 5, and 7 form the path of seismic damage of the overflow section. It is known that the positions of the gate pier linking on the upper overflow surface comprise the vulnerable area of the overflow dam under an earthquake.
Maximum tensile strains and damage descriptions at different locations of the models.

Figure 15 shows the maximum strains of the key positions of both models under various levels of inputting PGA during testing. For model 1#, the maximum strains of gauge No. 4 at the upstream surface and gauge No. 7 at the downstream surface are, respectively, 1254 µε and 1126 µε, indicating that the cracks in the positions of the sluice pier of the overflow section will be completely opened under the strong Chinese code earthquake wave. It is very similar to model 1#, and gauge No. 4 and No. 7 of model 2# have the maximum tensile strain values of 1168 µε and 1013 µε. It is possible to draw the same damage conclusion as model 1#.

The maximum strains of gauge Nos 1, 4, 7, and 9 on the both models: (a) the locations of dam heels, (b) the sluice pier bottoms of upstream surface, (c) changed slope of upper downstream, and (d) changed slope of lower guide wall.
As shown in Figure 15(d), under the seismic action of the PGA with 0.5 ∼ 0.6g, the cracks appeared at positions of changed slopes of lower guide walls for both models, indicating that the positions are also vulnerable. The maximum tensile strains of gauge No. 1 of both models exceed the tensile strain threshold of the model material, but the visible cracks are not observed at the positions (dam heels) of the both models. Combined with the previous engineering experience,9,10,11,28 the dam heel is also prone to tensile damage.
Conclusion
To study the seismic response, damage mechanism, and safety for an overflow section of a high gravity dam under two types of seismic waves, namely, Chinese code seismic wave and a natural seismic wave, a series of complete tests is performed on a shaking table. The conclusions of the experimental study are as follows:
The model material presented in this article can meet the similarity requirements with the prototype concrete. The material is easy to produce and can be used to fabricate the concrete dam model to complete the test well.
The responses to the frequencies and accelerations are derived from the testing. The overflow section of the dam will not be damaged under the Chinese code earthquake wave, for which the PGA is 0.334g, and the Wenchuan earthquake wave, for which the PGA is 0.306g. The same conclusion can be obtained according to the damages, evolution processes, and strain responses of the two models under the two seismic waves during the testing.
The PGA that produces the initial crack at the model can be used as an important index to measure the safety of the overflow section under a strong earthquake. The PGA for the initial cracks of model 1# under the Chinese code earthquake wave and model 2# under the Wenchuan earthquake wave in the testing are 0.371g and 0.345g, and are almost 1.45 and 1.33 times of the DPGA, respectively. The PGA at which models 1# and 2# completely failed are 0.728g and 0.641g, respectively, and reflect 2.901 and 2.564 times the overload capacity of the dam.
We can affirm that the overflow section of the 203-m high gravity dam is well designed to resist against seismic effects in that area. However, an earthquake of PGA beyond 0.501g may be catastrophic for the overflow section. At present, the dam section is designed to resist an earthquake with a DPGA under 0.251g. All the above points indicate that the dam section has good seismic performance.
Footnotes
Acknowledgements
The authors are grateful to the reviewers for their very useful comments and suggestions.
Handling Editor: Elsa de Sa Caetano
Declaration of conflicting interests
The author(s) declared no potential conflicts of interest with respect to the research, authorship, and/or publication of this article.
Funding
The author(s) disclosed receipt of the following financial support for the research, authorship, and/or publication of this article: The study is fully supported by the National Natural Science Foundation of China through Grant Nos 51669008, 51679030, and 51779032, and the project is also supported by the State Key Development Program for Basic Research of China through Grant Nos 2017YFC0404903 and 2017YFC0404900.