
Abstract
This paper employs Bayesian negative binomial and Poisson models to examine the effectiveness of speed cameras at reducing crashes, injuries, and fatalities on and immediately around Roosevelt Boulevard, a particularly dangerous urban arterial in Philadelphia, PA. Camera installation also coincided with rapidly changing traffic safety outcomes throughout the summer after COVID-19 lockdowns and protests against police violence. To find the most appropriate control segments for our analysis, we use k-means clustering to identify the five most similar roadways. Compared with these roadways and other geographic controls, the treated sections of Roosevelt Boulevard experienced decreased crashes, injuries, and fatalities after camera installation. These decreases are on the high end of what is found in the academic literature on speed cameras. The findings for total crashes, traffic injuries, fatalities, and pedestrian injuries are statistically different from zero with a high degree of confidence. Differences in pedestrian fatalities are statistically different from zero with 90% confidence. Based on our findings, we recommend that the Commonwealth of Pennsylvania and City of Philadelphia extend and expand the automated speed enforcement pilot. Estimates of the economic benefits of reduced crashes substantially exceed the total fines paid by violators. Despite this positive safety effect, additional treatments will be required to make Roosevelt Boulevard substantially safer. The roadway still accounts for around 8% of all traffic fatalities in Philadelphia.
Roosevelt Boulevard in Philadelphia frequently makes lists of the most dangerous US roadways. In a 2001 report, State Farm Insurance listed two intersections of Roosevelt Boulevard as the second and third most dangerous intersections in the country ( 1 ). For the last several decades, the Boulevard has consistently accounted for a disproportionate share of fatalities. Between 2016 and 2022, 100 people died in car crashes on Roosevelt Boulevard ( 2 ). Another 17 people died on the local roads immediately surrounding Roosevelt Boulevard. In total, around 12% of total traffic fatalities and around 6% of crashes involving injury, property damage, or a towed vehicle in Philadelphia occurred on Roosevelt Boulevard.
Several factors make Roosevelt Boulevard so deadly. The arterial consists of 12 lanes with posted speed limits of 40 mph and 45 mph and passes through densely populated neighborhoods in North Philadelphia with relatively low car-ownership rates and relatively large shares of immigrants, Black households, Hispanic households, and children. The road also has numerous at-grade intersections with local streets and connects to major high-speed highways and arterials throughout Philadelphia. Built in the early 20th century, Roosevelt Boulevard has design features that are something between a modern expressway and an urban parkway. The Federal Bureau of Public Roads, the Federal Highway Administration’s predecessor, (
3
) noted Roosevelt Boulevard as an early example of an urban highway that could be easily converted into a modern facility: “…and remarkable as an earlier, less daring venture, that can be converted with relative ease into a highly modern efficient modern facility—the Roosevelt Boulevard in Philadelphia. In its present form …a central artery for through traffic, bordered at each side by local service lanes, all set within a wide right-of-way. Depression of the central artery to separate its grade from that of the intersecting streets will be only a matter of construction, and is desirable.”
Instead, highway planners and engineers used federal interstate funds to build additional highways and connect them to Roosevelt Boulevard. The roadway has long moved highway levels of traffic at grade through densely populated neighborhoods at high speeds and taken a steep toll in crashes, injuries, and traffic fatalities.
In 2016, the City of Philadelphia, Pennsylvania Department of Transportation (DOT), and regional transit agency SEPTA partnered to develop a plan to improve safety, accessibility, and reliability for all users ( 4 ). This ongoing program led to the Pennsylvania legislature authorizing a five-year pilot project to use automated speed enforcement on the Boulevard in 2018. Automated speed enforcement is not legal in Pennsylvania without explicit approval from the state legislature. The Philadelphia City Council approved the automated enforcement program in 2019 and cameras began operating in June 2020. Cameras were installed at eight locations initially based on existing crash locations and a desire to provide spacing of 1-to-1.5 mi between cameras. Two additional locations were installed in 2022 based on speed data. For two months, drivers going at or above 11 mph over the speed limit received a warning in the mail. Beginning on August 1, 2020, drivers began receiving formal civil citations for $100 to $150, depending on speed. Speeding infractions decreased by over 90% with camera enforcement.
Automated speed enforcement on the Boulevard also coincided with major shifts in travel behavior, traffic enforcement, and traffic safety throughout Philadelphia. Despite decreased driving in the months following the City of Philadelphia’s COVID-19 stay-at-home order in March 2020, traffic fatalities more than doubled from 22 in the summer of 2019 to 55 in the summer of 2020 ( 2 ). Just three months earlier, COVID-19-related shutdowns dramatically influenced the geography of travel and traffic safety. Collision rates and traffic fatalities skyrocketed throughout the city, likely a result of a combination of decreased congestion, increased drunk driving, reduced adherence to social norms, and decreased traffic enforcement in the wake of protests for police reform after the murder of George Floyd.
This paper examines the effectiveness of speed cameras at reducing crashes, injuries, and fatalities on and immediately around Roosevelt Boulevard. In addition to providing guidance for policymakers, this analysis makes several broader contributions to the academic literature on speed camera effectiveness. First, the paper provides another example of the effects of speed cameras in a US context. Of the papers reviewed for this analysis, just four are from a US context, with two evaluating the same program in Charlotte, NC ( 5 – 8 ). The US has unusually high traffic fatality rates for a high-income country and automated enforcement presents one opportunity to reduce traffic deaths. Second, the paper also focuses on a particularly dangerous type of roadway, an urban arterial with 40-to-45 mph speed limit. Merlin et al. ( 9 ) identified arterials as one of the only feature of the built environment consistently associated with worse traffic safety outcomes across 54 studies examining linkages between the built environment and traffic collisions and injuries. Most studies of speed camera effects examine placements along highways or on urban streets with lower speed limits. Third, our study also offers insight into the effects of speed cameras during a period of rapid changes in travel behavior, enforcement, and safety. Finally, we provide an example of using an unsupervised learning approach, k-means clustering, to identify control segments in an instance where the small number of treated cases does not allow for a wide enough array of predictors to effectively apply a more commonly used supervised learning approach, such as propensity score matching.
The remainder of this paper is structured as follows. We examine the related literature on the effects of speed cameras on speeding, crashes, and injuries. We then describe our research approach, data, and models. A presentation of our statistical findings is followed by our conclusions and a summary, an overview of limitations, and takeaways for public policy.
Effects of Speed Cameras on Crashes
Existing studies generally find that automated speed enforcement reduces traffic speeds, crashes, injuries, and fatalities ( 5 , 7 , 8 , 10–28). Across studies, effect sizes vary from around 5% to 70% reductions in speeding, crashes, and injuries ( 29 – 32 ). Most effects are statistically significantly different from zero with 95% confidence, although this is not always the case ( 18 , 19 , 33 ). Differences in effects sizes may relate to differences in research design (statistical method, controls, distance from camera considered, direction of traffic considered, time span of program, etc.) and context (road type, camera type, enforcement policies, etc.) ( 13 , 34 ).
The majority of studies examine the effects of speed cameras over time relative to other control locations (5–8, 18 , 21 , 26 , 28 , 33 , 35–37). Some studies also control for time-related trends (11–13, 24 , 38 ). The Empirical Bayes method is one commonly applied method ( 8 , 11 , 17 , 19 , 23 , 27 , 38 ). Control segment selection is particularly important to avoid issues with regression to the mean, as well as systematic differences between treated and control segments that may not be consistent over time. Li et al. ( 17 , 39 ), for example, use propensity score matching to determine the most similar controls that would have been likeliest to also have speed cameras installed. Some research designs look only at before-and-after effects or do not carefully justify or estimate control segments ( 30 ).
The location and spacing of speed camera also appear to matter. Camera effectiveness is highest within 200 to 300 m and dissipates after 1,000 m ( 13 , 17 , 19 , 20 , 32 , 38 , 40 , 41 ). Li et al. ( 39 ) found that sites with multiple cameras may be more effective than sites with single cameras. Sites with multiple cameras within 200 to 300 m saw greater decreases in crashes than sites with only a single camera. Researchers have hypothesized that speed cameras might decrease safety by causing drivers to brake hard or accelerate after passing through camera locations but have generally not found a negative effect on safety directly upstream or downstream of camera locations ( 17 , 19 , 32 ). If anything, speed cameras appear to have a halo effect with reduced collisions in the areas surrounding camera sites ( 18 , 22 , 26 ).
Finally, the presence of vulnerable road users also likely influences the effectiveness of automated speed enforcement. Several studies suggest that pedestrians and motorcyclists may benefit most from speed cameras ( 13 , 24 , 42 ). Blais and Carnis ( 43 ), by contrast, found that France’s automated speed enforcement program was particularly beneficial for passenger vehicle occupants. Context likely plays a role, with speed cameras having variable effects depending on speeds, traffic mix, and roadway type. Automated enforcement of limited access highways, for example, would likely do little to improve pedestrian or bicyclist safety.
As outlined in the introduction, there are no existing studies examining the effects of speed cameras on major arterials in the US. Most global studies, moreover, focus on either highways or local roads despite the disproportionate number of fatalities and serious injuries that occur on arterials.
Research Design
Our final reported models examine whether traffic crashes and injuries on Roosevelt Boulevard decreased after camera installation relative to crashes on the five most similar roadway segments in Philadelphia from 2018 to 2022. We also test findings against all other arterials, untreated sections of Roosevelt Boulevard, and remaining road segments in Philadelphia. The reported models employ Bayesian negative binomial and Poisson models with non-informed priors ( 44 ) using the rstanarm package ( 45 ) in R version 4.3.2 ( 46 ). We tested which estimator worked best using an overdispersion test, a likelihood ratio test, and visualizations of which models predicted zero occurrences more effectively. Setting the program start date to June 1, 2020, when the system began issuing warnings, or August 1, 2020, when the system began issuing citations, produced similar results. The reported models predict the estimated crashes as follows:

where
μ i is the estimated number of crashes or injuries at street segment i during time period t,
t i is the monthly time period of exposure,
βkχ ki is the vector of parameter estimates βk for each geographic control unit χ ki ,
βD k χ ki is the vector of parameter estimates βχ ki interacted with Dk which is an indicator variable for time periods after camera installation, and
β j χ ji is the vector of indicator variables representing the month of the year.
Traffic crashes, injuries, and fatalities are reported by Pennsylvania DOT’s online crash reporting system ( 47 ). A reported crash involves an injury, fatality, or the towing of a vehicle and therefore excludes minor collisions or unreported incidents. A traffic fatality is reported if someone involved in the crash dies from injuries within 30 days. Serious injury involves “severe laceration, significant loss of blood, broken or distorted extremity, crush injuries, suspected skull, chest, or abdominal injury, significant burns, unconsciousness, or paralysis” ( 48 ).
Treatment and Controls
Figure 1 maps the speed camera locations, treated roadway segments, control segments identified through k-means clustering, and other roadway segments throughout Philadelphia. We consider all segments along the main segment with speed cameras as treated. This includes roughly 1 km southwest and northwest of the last cameras on the Boulevard. We also extended the treated area to side streets within 200 m of the treated segments of the Boulevard. These nearby streets account for 20% to 30% of all traffic fatalities and crashes, but more than 50% of pedestrian injuries in the geography that we consider the treated section of Roosevelt Boulevard.
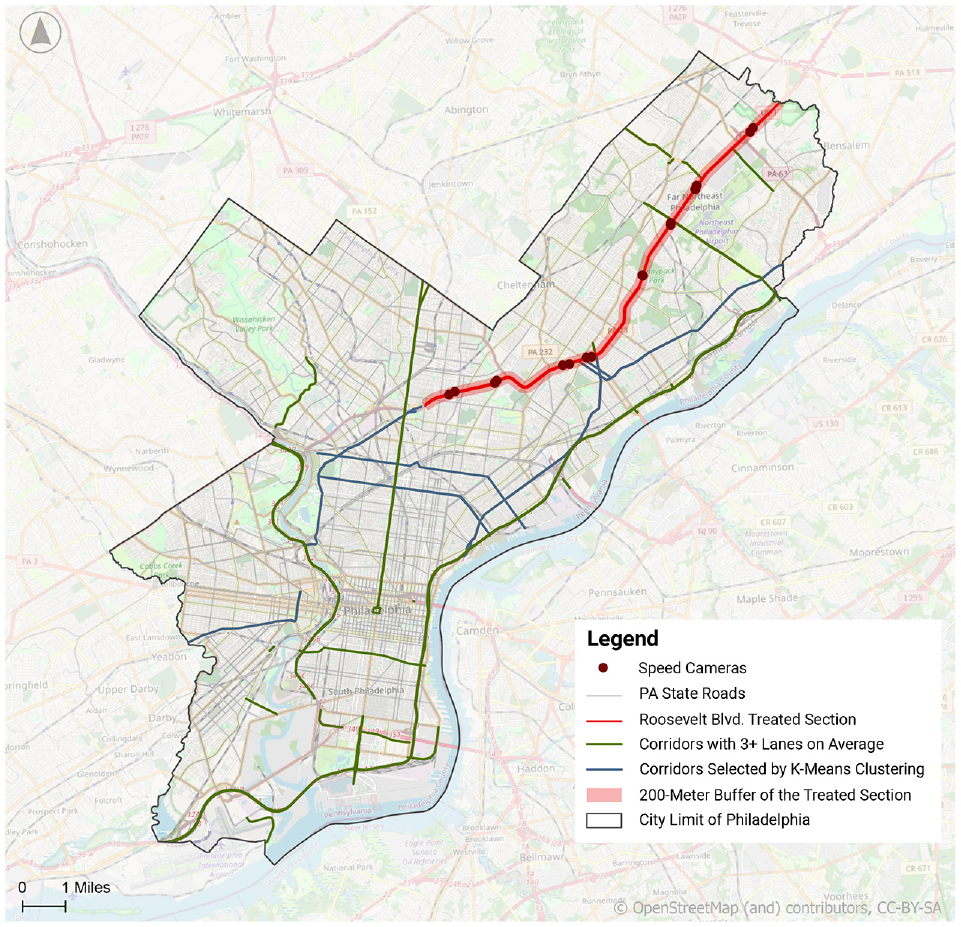
Location of Roosevelt Boulevard speed cameras and control segments in Philadelphia.
To identify the five most similar roadway segments, we applied a k-means clustering approach to data on traffic volumes, roadway characteristics, and crashes and injuries from 2016 to 2017. To facilitate selecting similar roadway segments, we merged crash and road network data by state route number. This broke Roosevelt Boulevard into two main sections, each with four parallel three-lane roadway segments, which we included in the clustering algorithm. Thus, the average roadway width is reported as three instead of 12. Similarly, average annual daily traffic (AADT) on the corridor is roughly four times the listed numbers. The other selected roadways tend to have two parallel segments. The selected section of N. Broadway, for example, has seven lanes on average and 28,000 AADT.
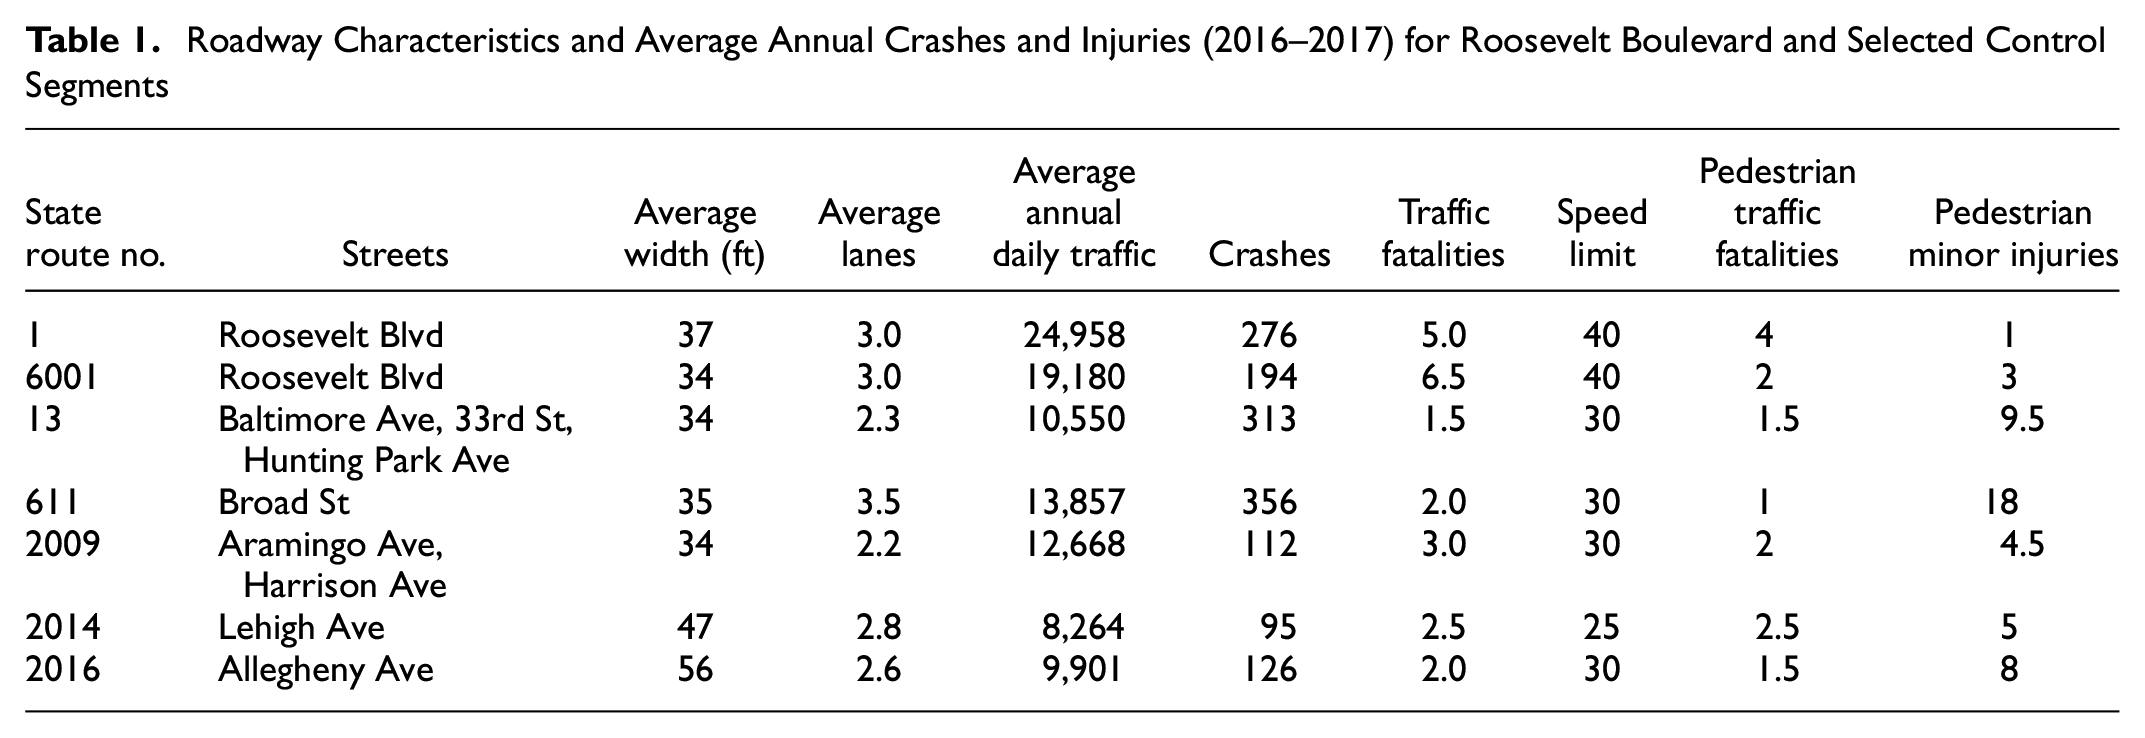
The final clustering approach divides Philadelphia’s roadways into 10 different classes. One of the smallest classes includes the two sections of Roosevelt Boulevard and five additional state routes. Table 1 presents data on traffic volumes, roadway characteristics, and average annual crashes and injuries (2016–2017) for the treated sections of Roosevelt Boulevard and five control segments. Controls segments tend to have lower speed limits, lower AADT, fewer fatal crashes, and much lower fatality-per-crash rates. By contrast, the control segments have more minor pedestrian injuries, though the lower-speed local roads within 200 m of the Boulevard have similarly elevated rates of minor pedestrian injuries.
Roadway Characteristics and Average Annual Crashes and Injuries (2016–2017) for Roosevelt Boulevard and Selected Control Segments
We also identified controls using propensity score matching and a qualitative approach of selecting the most similar roadways by name. All three approaches produced similar results. We report the k-means approach over the propensity score matching approach because it did a better job of selecting the kinds of non-highway arterials with high injury rates that are the likeliest candidates to receive automated speed enforcement if state legislation allows it. Propensity score matching allowed for fewer inputs and tended to select roadways with higher traffic volumes and crashes, such as interstate highways, but to ignore segments with high injury rates and pedestrian-involved collisions. Interstates tend to have lower injury rates and are among the least likely roadway segments to receive automated enforcement. The City of Philadelphia, for example, does not include crashes on Interstates in its traffic safety reporting and evaluation efforts ( 49 ).
Our final model specifications also separate arterials with three or more lanes, untreated sections of Roosevelt Boulevard, and remaining local roads in Philadelphia. Other model controls include categorical variables for the month to account for changing seasonal trends. We do not include roadway features as predictors because these are constant across the time periods examined and there is only one treated roadway segment. Finally, we do not include measures of monthly traffic. These are not available for most roadway segments. Moreover, annual estimates are based on modeling from a sample of roadways. Many segments have the same estimated traffic volumes from year to year or change proportionally based on changes to traffic on other corridors. The traffic volume data are thus incomplete and artificially correlated across observations.
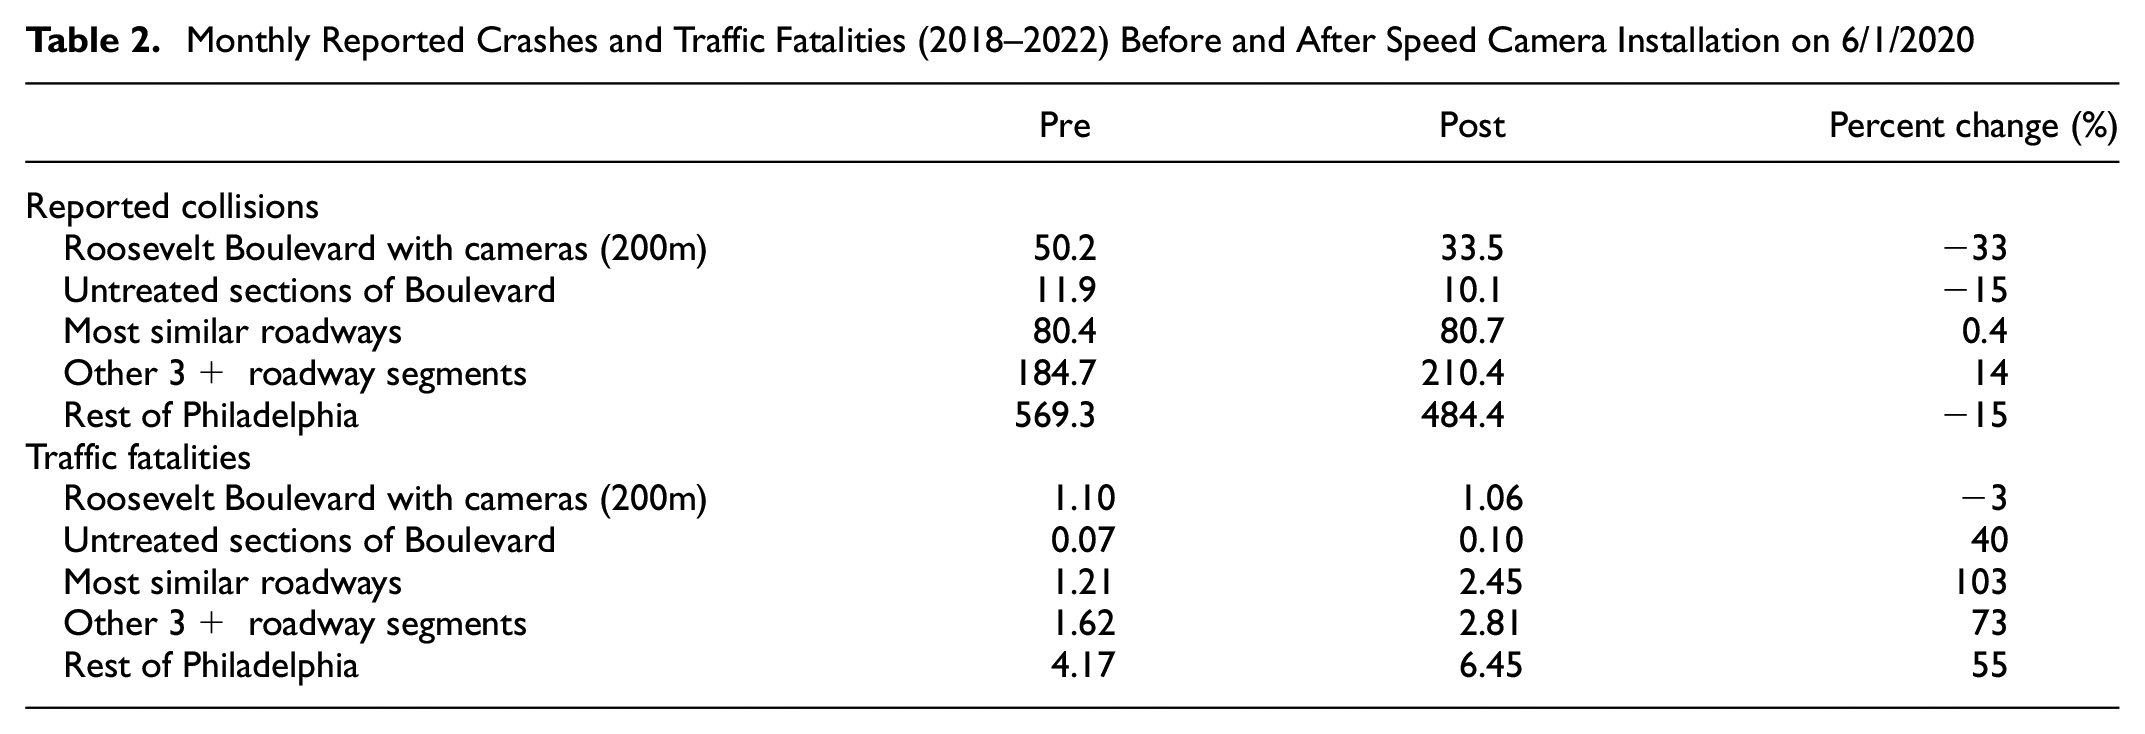
Table 2 presents the average monthly crashes and fatalities (2018–2022) before and after installation in each of the geographies modeled. Reported crashes on the treated section of the Boulevard decreased by 33% compared with an increase of 0.4% on the most similar roadways and 14% on other arterials. Monthly traffic fatalities increased across all geographies except for the Boulevard which saw a 3% decrease. These increases were substantial (between 40% and 103%) and traffic fatalities doubled on the five roadways that are most similar to Roosevelt Boulevard as described in Table 1.
Monthly Reported Crashes and Traffic Fatalities (2018–2022) Before and After Speed Camera Installation on 6/1/2020
Findings
Table 3 presents estimates of the differences in crashes and injuries on control geographies relative to differences on treated sections of Roosevelt Boulevard after camera installation on June 1, 2020. The models leave the treated sections of Roosevelt Boulevard out of the model to facilitate simultaneous comparisons with all other geographies. Thus, parameter estimates indicate the change in crashes and injuries relative to the treated sections of the Boulevard. After camera operations began, all measures of traffic crashes and injuries increased on the five most similar roadways, untreated sections of the Boulevard, other arterials with three or more lanes, and other local roads. We report leave-one-out cross validation information criterion (LOOIC) and provide visualizations of model fit by plotting Bayesian posterior predictions against measured crashes and injuries in Appendix A. These plots compare one hundred simulated predictions (y rep) of monthly incidents against the distribution of actual incidents (y) and show where predictions are most similar and different to actual crashes, injuries, and fatalities.
Estimated Differences in Crashes and Injuries Relative to Treated Sections of Roosevelt Boulevard After Installation of Speed Cameras using Bayesian Poisson and Negative Binomial Models
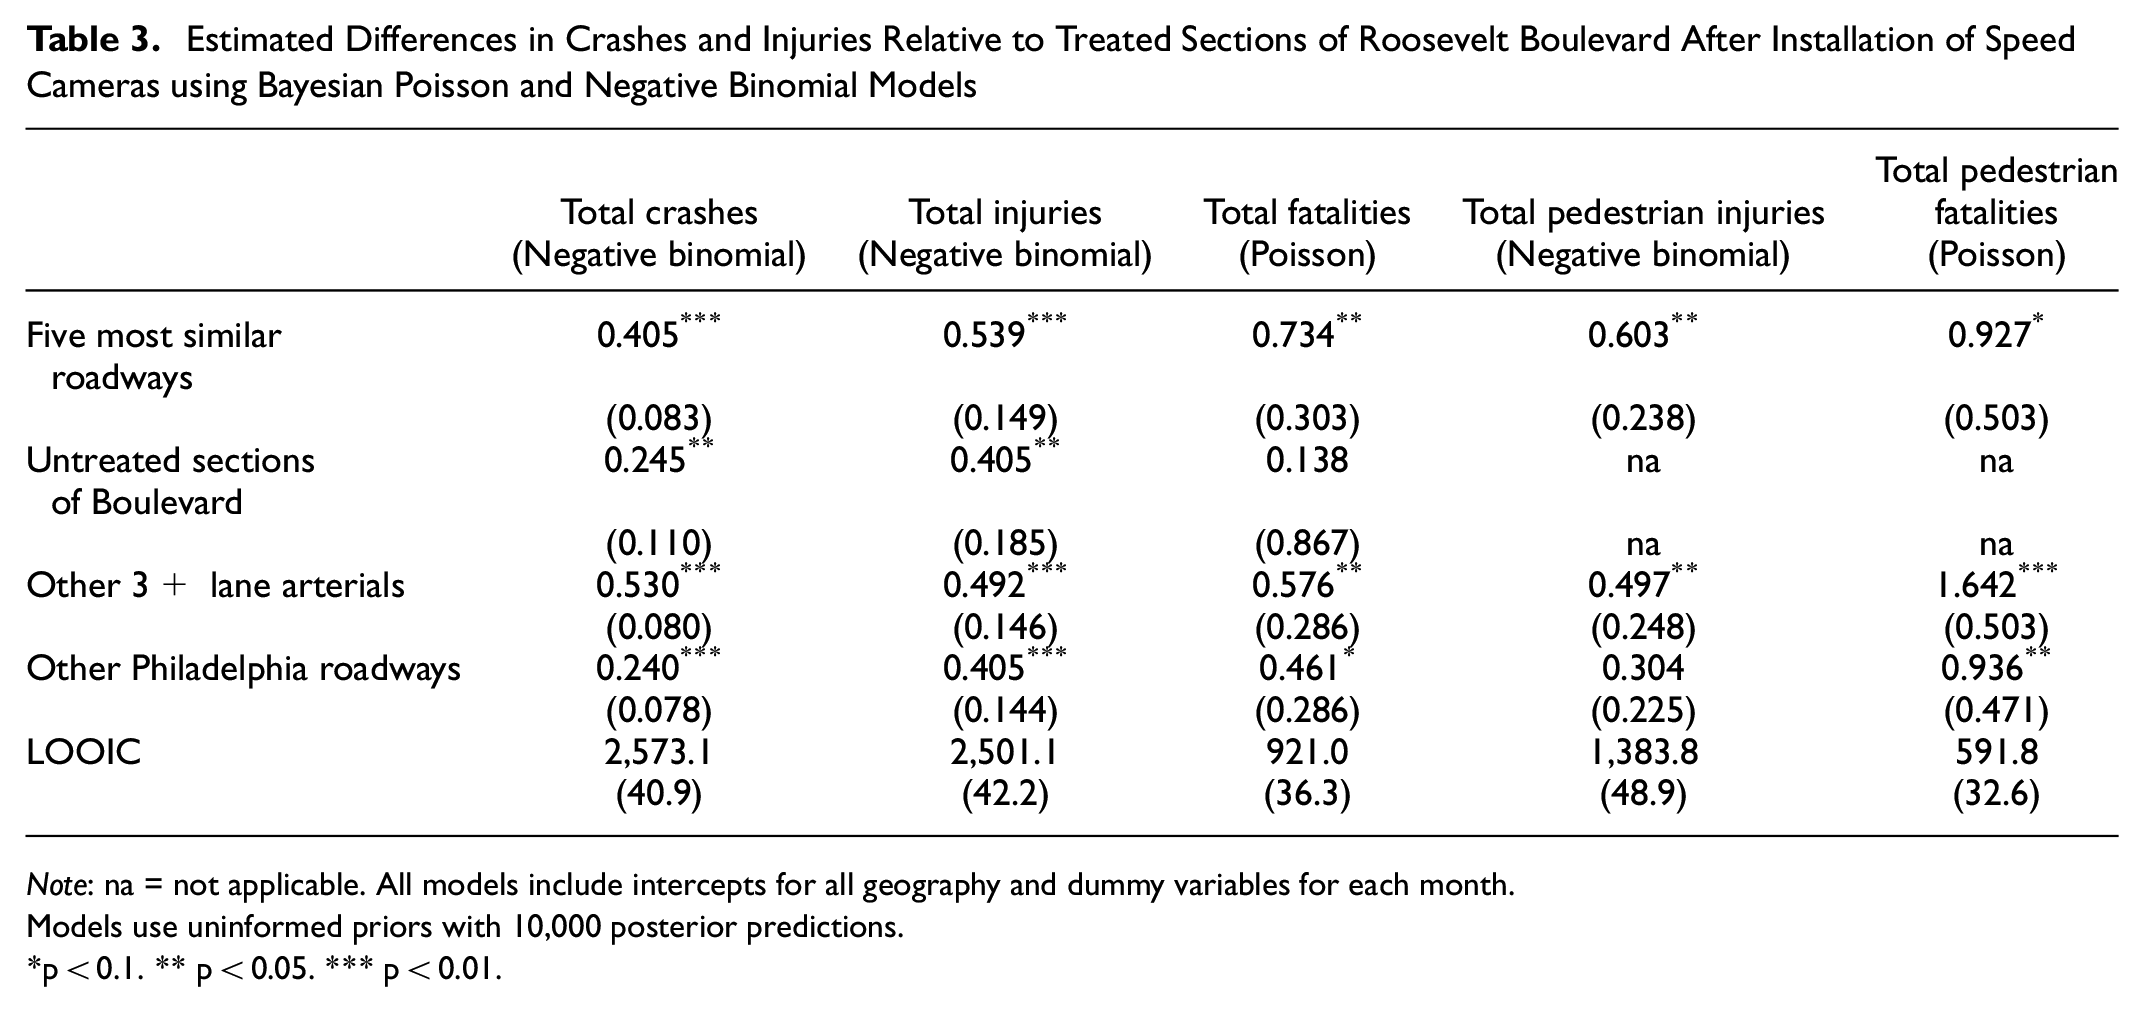
Note: na = not applicable. All models include intercepts for all geography and dummy variables for each month.
Models use uninformed priors with 10,000 posterior predictions.
p < 0.1. ** p < 0.05. *** p < 0.01.
Increases in crashes, injuries, and fatalities are statistically significant across most of the control geographies. After camera installation, the five most similar roadways experienced a strong and statistically significant increase in crashes relative to Roosevelt Boulevard. The exponent of the parameter estimate (0.405) indicates that the rate of incidents on the five most similar roadways (as defined in Table 1) increased 1.5 times relative to the rate of incidents on the Boulevard after camera installation. The non-fatal traffic injury rate was 1.71 (exponent of 0.539) times higher after camera installation. The strength of these safety effects is at the upper end of findings from the existing literature. This particularly effective speed camera deployment may relate the high numbers of speeding-related crashes and injuries on the Boulevard. Speed cameras are found to be most effective on the most dangerous streets ( 11 , 16 , 38 ). Multiple speed cameras may also be more effective than single speed camera installations ( 39 ). Speed cameras are also likely to be most effective during time periods of worsening driver behavior and reduced police enforcement as occurred in Philadelphia after the COVID-19 lockdown.
The smaller difference in crashes and injuries relative to other untreated sections of the Boulevard suggests that there may be some spillover safety effects outside of the zone that we considered treated. The small sample and single treated segment, however, limited our ability to test for halo safety effects more broadly. The overall results suggest that worsening traffic safety in Philadelphia since the COVID-19 lockdown disproportionately stems from arterial roadways. Nevertheless, even local roads experienced an increase in crashes and injuries relative to the treated sections of the Boulevard.
Total fatalities also increased on all control segments relative to the treated sections of the Boulevard. The effect sizes are slightly larger than those for crashes and injuries. Relative to the treated sections of the Boulevard, the rate of traffic fatalities doubled (exponent of 0.734 is 2.08) on the five most similar roadways after camera instillation. Despite the low total number of fatalities per month (1.08 across all years in the sample) and high variance (1.05), these differences are statistically significant at the 95% confidence level.
Differences in pedestrian injuries and fatalities tend to be slightly larger. The most similar roadways experienced 1.83 higher rates of pedestrian injuries and 2.53 times higher rates of pedestrian fatalities relative to the Boulevard after speed cameras were installed. The difference in pedestrian injuries is different from zero with 95% confidence, while the difference in pedestrian fatalities is statistically significant with 90% confidence. Given the small number of pedestrian fatalities and resulting overfitting of data, we dropped the untreated sections of Roosevelt Boulevard from the pedestrian injury models.
Absolute Changes in Crashes and Fatalities
Figure 2 plots the difference in posterior predicted crashes on Roosevelt Boulevard relative to the five most similar roadways, with and without cameras installed. We also plot one standard deviation above and below the average difference to provide a sense of the underlying data variance and model uncertainty. After the cameras were installed (month 30), the treated sections of the Boulevard had an average of 15 to 20 fewer reported collisions than would have been expected without the cameras. In total, the cameras prevented an estimated 524 reported collisions that involved injury or a vehicle towed in 2022, 2021, and the second half of 2020. While the standard deviation of the differences in crashes does not cross zero, the plot also shows that the random variance in crashes per month is substantial relative to the effect size.
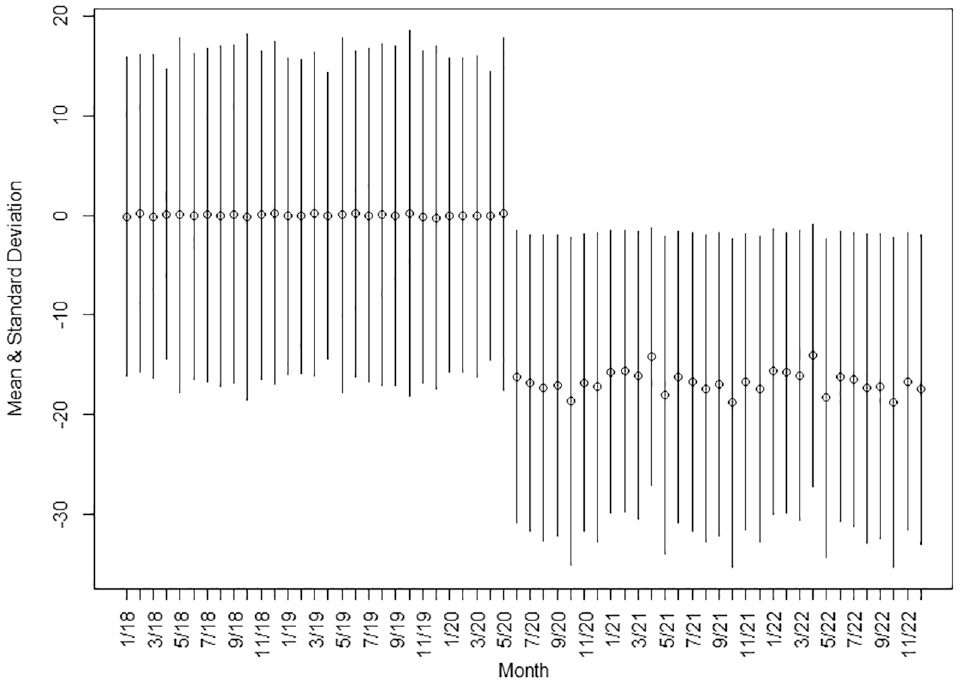
Mean and standard deviation difference in monthly posterior predicted traffic crashes with and without speed camera installation.
Figure 3 shows the same relationship but for total traffic fatalities. The model results suggest that the Boulevard speed cameras saved an average of 0.9 to 1.4 lives per month, a total of around 36 people since cameras were installed. However, the model results also show the wide variance in fatalities relative to this predictive difference. Across 10,000 posterior predictions, the model estimated more fatalities with speed cameras than without about a third of the time. Nevertheless, the predicted reduction in fatalities is high relative to the total observed fatalities on the Boulevard over time. Additional years of crash data will be needed to determine whether and by how much speed cameras reduced traffic fatalities on Roosevelt Boulevard during specific times of day, months, or seasons of the year.
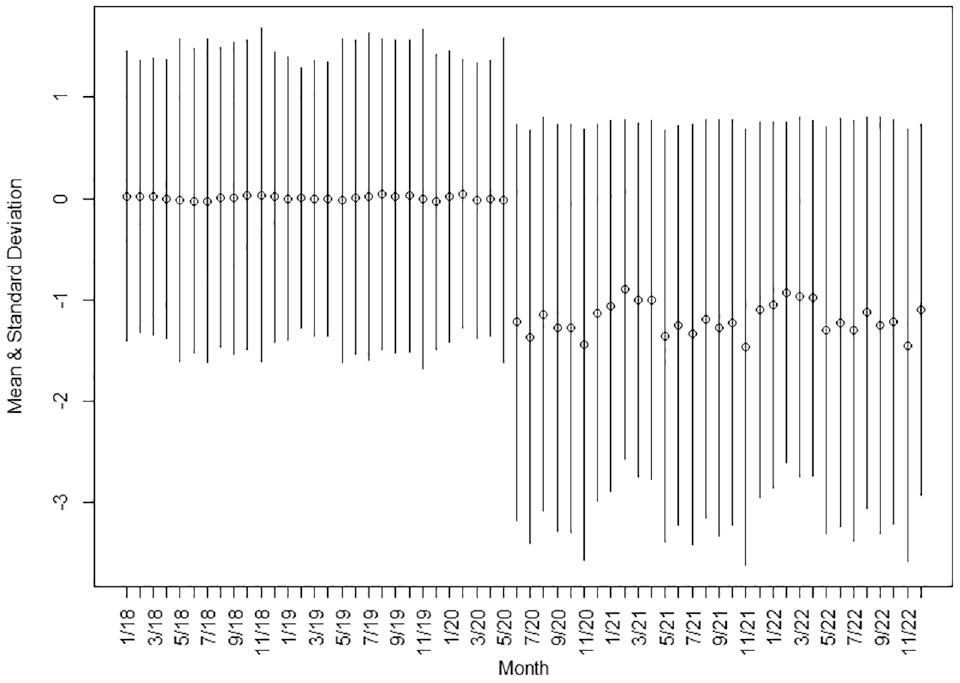
Mean and standard deviation difference in monthly posterior predicted traffic fatalities with and without speed camera installation.
Conclusion
In this paper, we examined the effects of speed cameras on crashes and injuries on Roosevelt Boulevard, a particularly dangerous arterial running through dense neighborhoods in Northeast Philadelphia. After camera installation, crashes and injuries decreased by around 50% relative to the most similar arterials, all arterials, and local roads in Philadelphia. Decreases in crashes, injuries, fatalities, and pedestrian injuries were statistically significant with a high degree of confidence. Pedestrian fatalities also decreased relative to other roadways. These decreases were statistically different with 90% confidence. Additional years of data are likely needed to reject the null hypothesis that cameras had no effect on pedestrian fatalities with greater certainty.
In any case, speed cameras on Roosevelt Boulevard only issue citations at speeds above 50 or 55 mph (depending on the segment), well above speeds where pedestrians have much of a chance of surviving a collision. Given the high share of pedestrian fatalities on the Boulevard (roughly 35% of total fatalities), slower speeds are likely needed for greater safety improvements.
Three main limitations affect interpretations of the effects of Roosevelt Boulevard’s speed cameras on traffic collisions, injuries, and fatalities. First, unlike with most studies of speed cameras, there is only a single treated observation in this analysis: the corridor along which cameras were installed and nearby local streets. With limited observations from just five years of collision data, there is a greater potential for random variance in collisions and injuries to outweigh any speed camera effects and potentially lead to a false rejection of the null hypothesis. Second, Roosevelt Boulevard is a somewhat unique roadway. The most similar highways and arterials all have substantial differences in capacity, infrastructural design, crashes, injuries, traffic volumes, or pedestrian activities as shown in Table 1. The Boulevard looks most like freeways along some dimensions, but most like high injury arterials along other dimensions. Third and finally, the speed cameras were installed in a period of decreased traffic volumes, decreased traffic enforcement, worsening driver behavior, and increased traffic fatalities. Although traffic levels have generally returned to normal, enforcement remains sparse and injury rates high across the City of Philadelphia. Automated enforcement is likely particularly effective in the absence of other types of enforcement.
Nevertheless, several factors support the causal interpretation that speed cameras reduced traffic collisions and injuries on the Boulevard. Estimated effect sizes are large and generally consistent across a range of different controls and effect measures (crash, injury, etc.). Although not always statistically significant, every measure of collision and injury decreased on the Boulevard relative to the most similar arterials, untreated sections of the Boulevard, other arterials, and remaining local roads. Using different approaches to selecting the most similar roadways also produced consistent results. Moreover, findings are generally within the range and statistical significance of findings from other studies on the effects of speed cameras on crashes and injuries.
For public policy, we recommend the reauthorization and expansion of automated enforcement in Philadelphia. Applying Pennsylvania DOT’s ( 50 ) estimates of the economic costs of traffic collisions, injuries, and fatalities, the estimated annual safety benefits of enforcement are around six times higher than the $22 million in revenues generated in fiscal year 2021 ( 51 ). Residents of neighborhoods throughout Philadelphia have seen the results of automated speed enforcement and have requested expansion to other major arterials throughout the city, including Henry Avenue, Lincoln Avenue, Delaware Avenue, Torresdale Avenue, Walnut Street, Chestnut Street, and Cobbs Creek Parkway ( 51 ). Some residents of Northeast Philadelphia have expressed concern that the speed cameras have displaced traffic volume and dangerous driving to parallel corridors such as Buslteton Avenue. Additionally, anecdotal evidence shows some altering or obscuring of license plates as a strategy to avoid automated enforcement. Further study is required to evaluate both factors.
Despite the safety improvements, there remain important limits to the current speed enforcement program. Roosevelt Boulevard remains and will likely continue to remain Philadelphia’s most deadly arterial. In 2021 and 2022, 19 people lost their lives on and around the treated sections of Roosevelt Boulevard. That is just under 7% of the city’s total traffic fatalities. The roadway remains a dangerous combination of high-speed highway that intersects with local streets in densely populated neighborhoods. Further safety improvements will likely require one of three approaches. The first and least costly is to lower speed limits and ramp up enforcement to get traffic speeds closer to 30 mph instead of 50 mph. The second would be to grade separate the Boulevard and turn it into the type of limited access highway envisioned by early federal highway planners ( 3 ). This option would be expensive and is likely a political non-starter given the negative effects of separating communities with highways and contemporary efforts to reconnect and restore highway-affected communities. The third option is to redesign the Boulevard to operate as a lower speed and lower-capacity boulevard that looks and behaves more like Philadelphia’s other urban arterials.
Based in part on the results of this study, the state legislature voted in December 2023 to allow expansion of the automated enforcement program to five additional corridors and five school zones. These additional enforcement zones are likely to reduce crashes, injuries, and fatalities. Additional enforcement areas will also allow the relative effectiveness of speed cameras on different roadway types in different geographies in the city to be studied.
Supplemental Material
sj-docx-1-trr-10.1177_03611981241230320 – Supplemental material for Evaluating the Effectiveness of Speed Cameras on Philadelphia’s Roosevelt Boulevard
Supplemental material, sj-docx-1-trr-10.1177_03611981241230320 for Evaluating the Effectiveness of Speed Cameras on Philadelphia’s Roosevelt Boulevard by Erick Guerra, Christopher Puchalsky, Nata Kovalova, Yihong Hu, Qi Si, Jiamin Tan and Gillian Zhao in Transportation Research Record
Footnotes
Author Contributions
The authors confirm contribution to the paper as follows: study conception and design: Erick Guerra, Christopher Puchalsky; data collection: Erick Guerra, Yihong Hu, Jiamin Tan, Qi Si, Yihong Hu, Gillian Zhao; analysis and interpretation of results: Erick Guerra, Nata Kovalova; draft manuscript preparation: Erick Guerra, Nata Kovalova. All authors reviewed the results and approved the final version of the manuscript.
Declaration of Conflicting Interests
The authors declared no potential conflicts of interest with respect to the research, authorship, and/or publication of this article.
Funding
The authors disclosed receipt of the following financial support for the research, authorship, and/or publication of this article: Funding support was provided by the Safety21 (USDOT Award No. 69A3552344811 and No. 69A3552348316) and Mobility21 National University Transportation Centers (USDOT Award No. 69A3551747111). Marco Gorini (Philadelphia), Kevin Murphy (DVRPC), Adam Smith (Philadelphia), Kelley Yemen (Philadelphia), Jason Duckworth (Arcadia Land Company) and Benjamin Manning (Duckworth Lab) provided data and interpretation support.
Supplemental Material
Supplemental material for this article is available online.
References
Supplementary Material
Please find the following supplemental material available below.
For Open Access articles published under a Creative Commons License, all supplemental material carries the same license as the article it is associated with.
For non-Open Access articles published, all supplemental material carries a non-exclusive license, and permission requests for re-use of supplemental material or any part of supplemental material shall be sent directly to the copyright owner as specified in the copyright notice associated with the article.