
Abstract
The downhole temperature and drilling fluid pressure have a significant influence on the contact pressure and leakage rate of the dynamic seal. This article attempts to improve the seal performance using response surface method and multi-objective optimization. The width of the sealing interface, the pressure difference, the hardness of the O-ring and the hardness of the support ring are defined as independent variables, while the outer contact pressure and the leakage rate of the seal are chosen as objective functions. The response surface method has been employed to construct mathematical models combining both the independent variables and the objective functions, and the accuracy of the mathematical models has been proved. Furthermore, the leakage rate was regarded as a constraint function; hence, the minimum outer contact pressure and corresponding design parameters were obtained. The outer contact pressure of the seal increases with the increase in the drilling pressure difference, but decreases with the width of the sealing interface; the relationships between the leakage rate and the independent variables have also been obtained. According to the multi-objective optimization, the leakage rate of the improved seal decreased by more than 10% compared to the previous seal.
Keywords
Introduction
With the increase in the downhole temperature and drilling fluid pressure, the life of a conventional rubber seal is greatly challenged in abrasive environment. Hence, the metal dynamic seal has been widely applied in the cone bit to prevent the drilling fluid from flowing into lubricant chamber of the cone bit. 1 The double metal floating seal was used in cone bit bearing sealing system. In 1987, Luo et al. 2 designed a single metal floating seal with the characteristics of simple structure, high temperature resistance and high pressure resistance to promote the seal performance, and the seal was widely used in the field of drilling. On this basis, the newest generation bearing seal was improved by Baker Hughes in 2003, as shown in Figure 1. The stator, the rubber support ring and the O-ring are relatively stationary; the rotor rotates together with the shaft. Meanwhile, the O-ring and the rubber support ring supply the axial compressive force for the seal interface between the rotor and the stator. 3

Schematic illustration of the bit seal.
Due to the complex downhole conditions and the non-linear seal force of rubber material, the research on the downhole seal is relatively few. Based on the elasto-hydrodynamic lubrication theory, Xiong and Salant4,5 presented a numerical model of the first-generation metal dynamic seal to predict the contact pressure distributions and the leakage rate. As for the wear of seal interface, the performance of the dynamic seal was improved by Zhang et al.,6,7 and the failure cause of the seal was discussed. As to the reliability and the parameter optimization of the dynamic seal, the influence of the hardness of the support ring and the O-ring on the seal contact pressure was studied using finite element analysis (FEA). 8 Although these scholars have investigated the performance of bit seal, there are few descriptions about the bit seal optimization under drilling condition.
For the seal optimization, conventional experiment optimization and FEA are time-consuming when the experiment involves many parameters. To overcome this limitation, response surface method (RSM) is widely used in the engineering research field for its higher optimization efficiency to evaluate the response of the parameters using fewer FEA results.9–11
Therefore, this article aimed to prolong the seal life through the numerical simulation and the RSM methodology. The article is organized as follows. Section “Problem description” introduces the problem of the seal failure. On the basis of the constitutive parameter of rubber, the distributions of seal contact pressure and the leakage rate were obtained using numerical calculation in section “Methods.” In section “Results and discussions,” the RSM approach was applied to obtain the better parameter combination of the seal, and the results were confirmed by the numerical simulations and experiments.
Problem description
For the cone bit, the bearing life is largely determined by the seal. To increase the seal life and provide a superior performance seal, the seal wear resistance and the rubber part fatigue resistance should be improved as much as possible. The material of the stator and rotor is YG8. The O-ring and rubber support ring are made of hydrogenated nitrile butadiene rubber (HNBR) with a hardness of about 80 international rubber hardness degree (IRHD), a material that ensures high temperature resistance together with high compatibility for lubrication. Figure 2 shows the wear condition of seal components, which clearly demonstrates that only the outer seal surface is worn out. The wear of the O-ring is very serious due to the slippage between the O-ring and the stator. However, the fundamental reason is that the hardness of the rubber is too low.
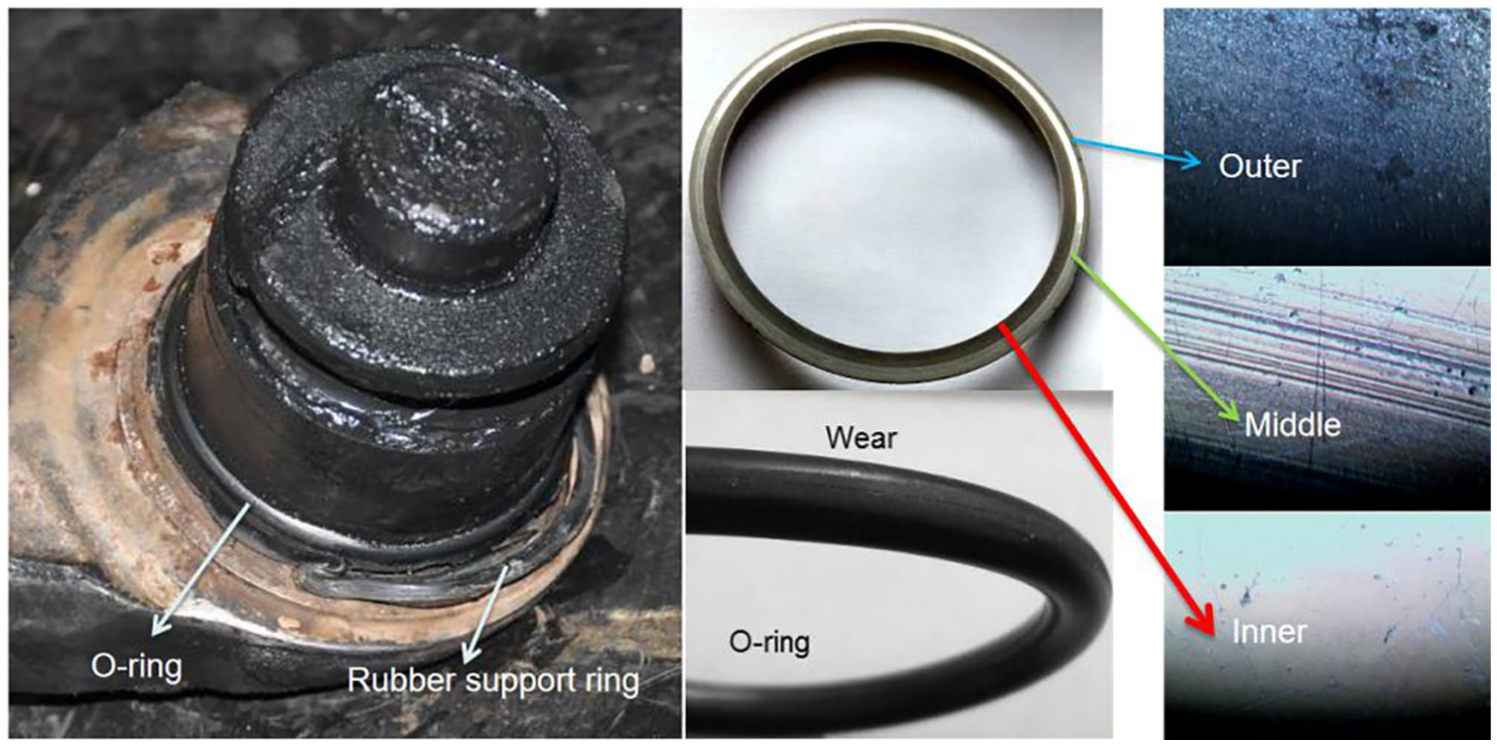
Wear condition of the seal components.
Methods
Material constitutive of rubber
In this study, the material of the O-ring and rubber support ring is NBR with a hardness of 70 shore A, which exhibits high non-linear elasticity and high temperature resistance. There are many constitutive models to describe the mechanical properties of rubber. The Mooney–Rivlin strain energy function was selected to describe the non-linear and incompressible behaviours of rubber, and the stress can be written as the derivative of the energy function to the strain, 12 as given by

The strain energy is expressed by the following formula

where I1, I2 and I3 are the strain invariants; Ckm and K are the constant and bulk modulus of the Mooney–Rivlin model, respectively. I3 is equal to 1 due to the incompressibility of rubber. Thus, only two Mooney–Rivlin parameters C10 and C01 need to be considered when n = 1. As to the incompressible material, the relationship between the elastic modulus E and the shear modulus G of rubber is 13
where

To get the ratio of C1 and C2 for different hardness of rubber, the curves of the rubber characteristics under different hardness can be obtained by changing the value of C1/C2. Numerical simulations indicate that C2/C1 is 0.1, 0.05 and 0.02 when the rubber hardness is 40, 60 and 70, respectively. 14 The relationship between C2/C1 and shore hardness Hr can be obtained by numerical fitting and can be written as

According to equation (5), the rubber constitutive parameters for different hardness are summarized in Table 1.
Parameters of rubber material for different hardness.

Contact pressure
The contact pressure has an important influence on the seal surface wear. For this analysis, the seal structure and load condition can be regarded as an axial symmetry model, so the contact pressure can be obtained using ANSYS based on the two-dimensional finite element model. The seal assembly process with a 4-mm displacement loaded on the stator was completed in the first step, and then the ambient loads, including the inner lubricant pressure and the outer fluid pressure, were applied to the inner and the outer surface of the seal. The pressure difference ΔP between the lubricant and the drilling fluid ranges from 0.3 to 0.7 MPa and has a great impact on the contact pressure of seal interface during drilling. 7 When the drilling fluid pressure is 3 MPa, the distributions of contact pressure under different pressure difference are shown in Figure 3. It can be seen that the maximum contact pressure is located on the outer surface, and the contact pressure distribution on the seal interface is uneven. Meanwhile, the outer contact pressure increases with the increase in drilling pressure difference.

Contact pressure under different drilling pressure difference.
Seal leakage rate analysis
The leakage rate of the seal can be calculated by numerical simulation model. To simplify the numerical computation, the inverse method was used to solve the film thickness of the seal interface. Furthermore, the seal geometry, the loads and the flow field of seal interface were considered to be axisymmetric. Based on these assumptions, the leakage rate can be obtained by the one-dimensional Reynolds equation, which is shown as
The boundary conditions are as follows: P = P1 = 0.7 MPa (lubricant), at r = r0 = 25 mm (inner radius of the seal); P = P2 = 0.3 MPa (drilling fluid), at r = r1 = 28.5 mm (outer radius of the seal); and μ and h are the lubricant dynamic viscosity and film thickness, respectively. The density and viscosity of the lubricant can be expressed as 15

ca and cb are the lubricant constants;

Based on the contact pressure gradient distribution of the seal interface obtained by ANSYS, the film pressure distribution of the seal interface can be calculated according to equations (6)–(8), and the seal leakage rate Q can be calculated from equation (9)

In this article, the environmental temperature is T = 30°C, and the lubricant is lithium complex grease with a kinetic viscosity of 4.071 Pa·s at 30°C. The shaft rotating speed n = 200 r/min, and the pressure difference is 0.5 MPa. The result of leakage per second is presented in Figure 4. It is concluded that the leakage decreased first, and then increased with the increase in the drilling fluid pressure because the maximum contact pressure gradually moves to the inner surface.

Effect of drilling fluid pressure on the leakage.
Results and discussions
Application of RSM
According to the contact pressure distributions and seal failure, the main focus of this section is to reduce the out contact pressure and leakage rate of the seal using multi-objective optimization as much as possible. The width of the sealing interface (W), the pressure difference (ΔP), the hardness of the O-ring (ShA) and the hardness of the support ring (ShB) were selected as four independent design factors that may affect sealing performance of the seal. The outer contact pressure and the seal leakage rate were regarded as the optimization targets. In this article, the RSM was employed to construct regression models for the multi-objective optimization, and the Design-Expert is the most commonly used analysis software for the RSM. The response surface design method in the Design-Expert includes the Box–Behnken and the Central Composite Design. 16 The Central Composite Design method was adopted to obtain the better parameter combination of bit seal.
In this study, a prediction model between the optimization targets and the four individual factors denoted as x1, x2, x3, x4 can be obtained using the design of experiments (DOE) and the regression analysis. 17 Furthermore, the impact of the individual factors and the interactions among these factors on the optimization targets also can be determined by the prediction model. The quality of the prediction model can be judged using the residual analysis and the statistical tests. The procedure of the RSM is shown in Figure 5.

Multi-objective optimization procedure using RSM.
A second-order model was selected as a defined response using the least-squares method in RSM and can be expressed as 17

where a0 is a constant; ai, aii and aij are the coefficients of linear, second degree and mixed terms of the model, respectively; and ϵ is the fitting error. The orthogonal design using Taguchi’s method can improve experimental efficiency and has been successfully used to solve the problem of optimal combination in quality improvement. 18 As to the seal optimization, the three levels of the individual factors denoted as A, B, C and D were generated using an orthogonal array table, as shown in Table 2.
Impact factors and levels of seal.

Meanwhile, the outer contact pressure Pout and the seal leakage rate Q of the seal were used as the optimization targets, and 30-group simulations with different design parameters were conducted by FEA and MATLAB (the 15th–20th experimental simulations were the central experiments and were used to guarantee higher prediction), as seen in Table 3.
Results of the central experiments for the seal.

According to the results of the simulation analysis, a prediction model indicating the relationships between the objective functions and the design variables was established using the least-squares method and is given by


The significance of the terms in the prediction model can be determined by the analysis of variance (ANOVA), and the results of the ANOVA for Pout and Q are shown in Tables 4 and 5, respectively.
ANOVA table for Pout.

ANOVA table for Q.

The confidence analysis of these factors was provided to verify the accuracy of the prediction model, including ‘squares’, ‘mean square’, ‘F–value’ and ‘p-value’. The factors are significant to the responses when the p-values are less than 0.05; hence, the four design parameters of the seal have a significant effect on the Pout and Q. Meanwhile, their interaction effect items AC, AD and BC, as well as the quadratic item A2, are also significant for the Pout. Furthermore, the R2 and the adjusted R2 values are also the statistical criteria to evaluate the significance of the prediction model, and the values of Pout are 94.8% and 93.0%, while the two values of Q are 98.5% and 97.0%, respectively. Since the difference between the R2 and the adjusted R2 for the two optimization targets is very small, the prediction model can represent the relationships between the design parameters and the responses. Furthermore, Figure 6 shows the studentized residual of the outer contact pressure and leakage rate. It can be seen that the distribution of residual points almost along a straight line, which also indicates that the prediction model, can predict the objective functions accurately.
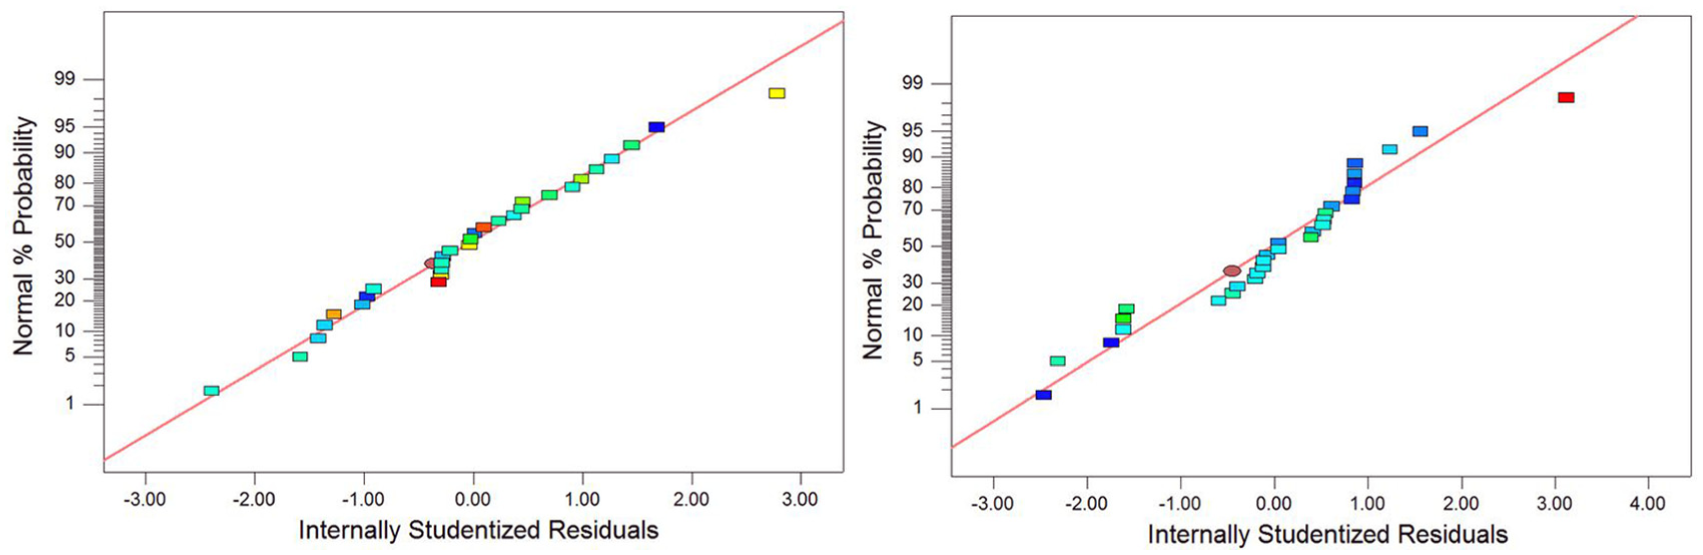
Residual distribution of outer contact pressure and leakage rate.
The impacts of the design variables on the objective functions are shown in Figures 7–10, where each contour represents the gradient value of the optimization targets in the contour diagrams. According to Figures 7 and 8, when the values of A are larger and those of B are smaller, the minimum outer contact pressure can be obtained to reduce the wear of sealing surface, and the outer contact pressure decreases with the decrease in C and D.

Outer contact pressure versus width of the sealing interface and pressure difference.

Outer contact pressure versus hardness of support ring and O-ring.

Leakage rate versus width of the sealing interface and pressure difference.
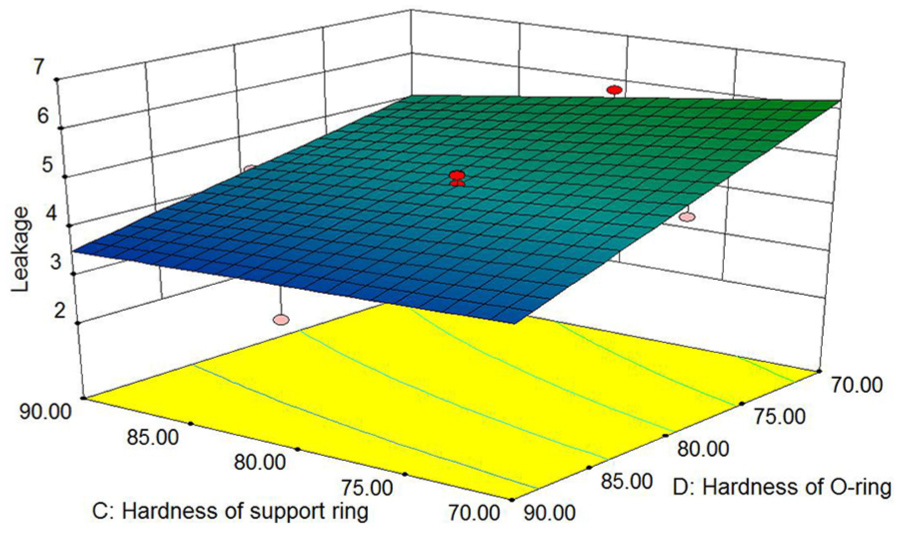
Leakage rate versus hardness of support ring and O-ring.
Moreover, it can be observed that A and D have greater effects on the outer contact pressure than B and C, respectively. For the leakage rate, Figure 9 shows that the leakage rate increases with the increase in the environmental pressure difference B and the width of the sealing interface A. In contrast, Figure 10 shows that the leakage rate is inversely proportional to the hardness of the O-ring and rubber support ring. It can also be seen that A and D have more impact on the leakage rate than B and C, respectively.
Multi-objective optimization
The commonly used multi-objective optimization methods include the linear weighted combination method, the least-squares method and the main target method. In this article, the main objective method was selected to solve the seal optimization, and the outer contact pressure and the leakage rate of the seal were deemed as a major design goal and a constraint function, respectively. 19 For the eight-inch bit seal, the volume of lubricant is approximately 80 cm3. To prolong the life of the seal, the allowable leakage rate of the seal is approximately 0.045 mm3/s under normal working conditions. Therefore, the objective function of the seal can be expressed as

The out contact pressure has been obtained by the RSM in equation (11). Thus, the single-objective function F(X) can be solved by the optimization module in Design-Expert. The optimization values and corresponding design parameters were obtained after 54 iterative computations. For the improved and previous seal parameters, the outer contact pressure and leakage rate of the seal were calculated by the prediction model using the RSM, and the simulation results were calculated by FEA under the same condition as shown in Table 6.
Comparison of the results before and after optimization.

Fortunately, the improved seal has an outer contact pressure of 28.147 MPa and a leakage rate of 0.045 mm3/s, compared to 29.634 MPa and 0.0528 mm3/s, respectively, for the previous seal. Meanwhile, Table 6 also compares the relative error for the outer contact pressure and the leakage rate using RSM and FEA to verify the accuracy of the regression model. For the improved seal, the error of the outer contact pressure is only 2.7%, and the error of leakage rate is 4.93%; thus, the RSM can be applied to the optimization design of the bit seal to extend the life of the seal.
Experimental verification
To verify the analysis results, a seal test rig, shown in Figure 11, was set up to evaluate the performance of the seal. 20 The sealing cavity was filled with lubricant, and the outer drilling fluid was replaced by water. To simulate the pressure difference more accurately, a hydro-cylinder with a spring was used to ensure that the lubricant pressure is higher than that of the water. The seal leakage rate can be calculated using the piston area and the piston displacement. It is difficult to obtain the seal contact pressure through experiments. However, a higher contact pressure results in more friction heat, and thus, the contact pressure distribution follows the same trend as the temperature distributions. The outer surface temperature of the stator can be measured using a thermocouple.
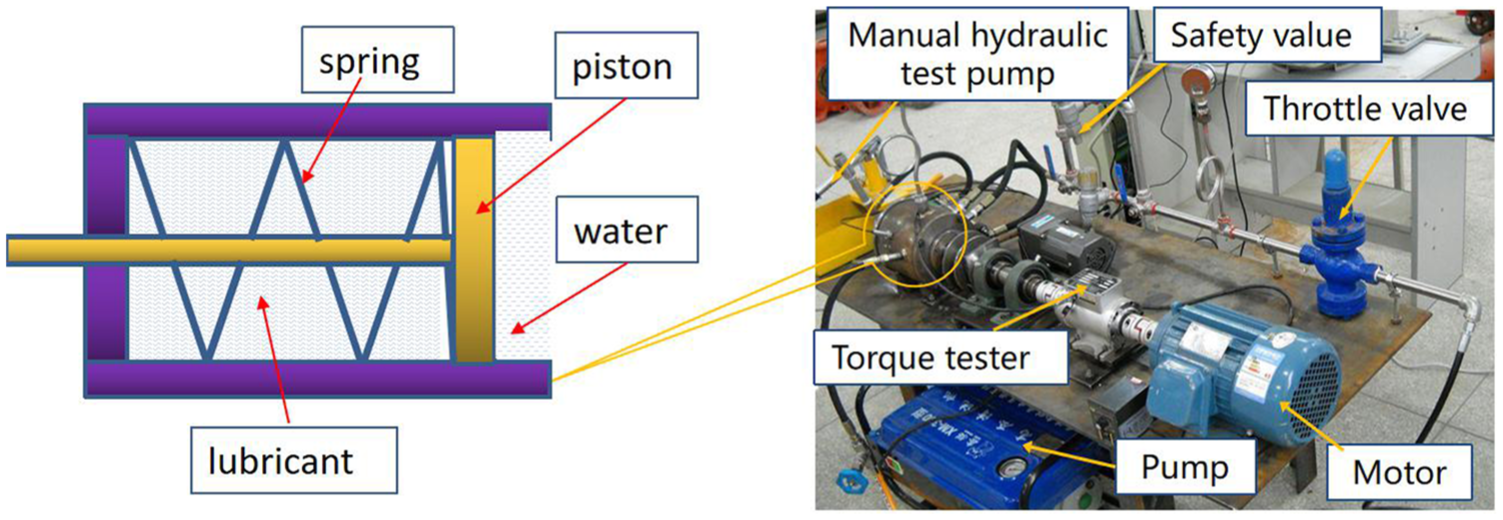
Schematic diagram of a seal tester.
In this trial, the pressure difference is 0.7 and 0.3 MPa for the previous seal and the improved seal, respectively. The environmental temperature is T = 30°C, the shaft speed n = 200 r/min and the water pressure is 3 MPa. The temperature of the outer seal interface and the leakage rate for the previous and improved seal with the lubricant pressure are presented in Figure 12.
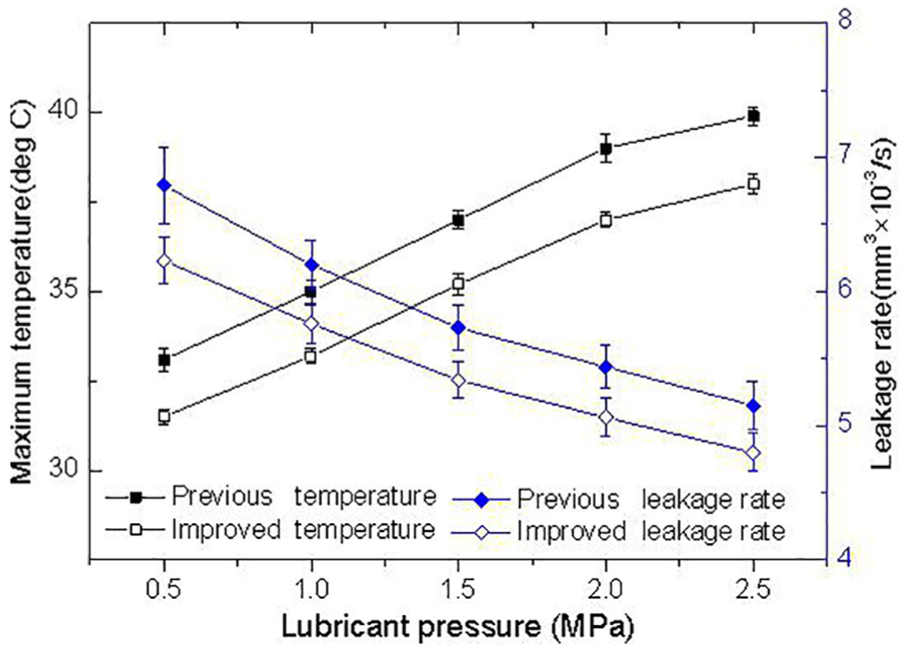
Comparison of the surface temperature and leakage rate before and after optimization.
Figure 12 shows the comparison of the surface temperature and leakage rate before and after optimization, where the temperature increases with the increase in the lubricant pressure from 0.5 to 2.5 MPa, and the error bars represent the standard deviations of the three experiments. The experimental results show that the temperature of the improved seal interface is lower than the previous, which means that the contact pressure of the outer seal is reduced after optimization, so the wear of the improved sealing surface can be reduced effectively. Meanwhile, the outer contact pressure increases rapidly with the increase in the lubricant pressure; thus, the wear of seal interface will be further aggravated during ultra-high pressure drilling. For the seal leakage rate, Figure 12 shows that the trend of the effect of lubricant pressure on seal leakage rate is opposite to the temperature. Therefore, the contact pressure should be reduced as much as possible when the leakage rate is allowed. The results of the experiment are consistent with the RSM and the FEA on the whole, even though there are some errors.
Conclusion
In this article, a study of parameter optimization of the cone bit seal has been conducted to find the optimum values of the design parameters through RSM and numerical simulation. The relations between the objective targets and four design parameters were set up, and a multi-objective optimization was studied to determine the optimal parameter combination to extend the life of the cone bit. The main results can be summarized as follows.
The ANOVA results show that the prediction model for the objective targets adequately represents the numerical analysis results because the F-values are less than 0.05, and the difference between the R2 and adjusted R2 for the objective targets is very small. Based on the RSM, the regression equations relating to the objective functions and the design parameters were established.
The error of the objective functions for the regression model and simulation is small enough and falls in the acceptable range. The leakage rate of the optimized seal gets an improvement of more than 10% compared to the previous seal.
The results of the confirmation experiments basically coincide with the the numerical simulation. Thus, the optimization method in this article can be applied to the optimization design of the seal more effectively.
Footnotes
Handling Editor: Davood Younesian
Declaration of conflicting interests
The author(s) declared no potential conflicts of interest with respect to the research, authorship and/or publication of this article.
Funding
The author(s) received no financial support for the research, authorship and/or publication of this article.