
Abstract
The purpose of this study is to analyze the differences between the effects of robot welding and manual welding on the low- and high-cycle fatigue lives of the weld zones for T-shaped weld structures fabricated from SM50A carbon steel using a CO2 gas arc welding method. Fatigue tests were conducted using a three-point bending method, and the S-N curves of the manual welding and robot welding crossed each other at approximately 3 × 10⁴ cycles. The robot welding weld zone had better high-cycle fatigue lives than the manual welding. The results are attributable to the fact that the more uniform and higher welding speed of the robot welding leads to smaller weld zone area (i.e. ~12% smaller than the manual welding) and also smaller grain size than the manual welding. Because a smaller grain size in the robot welding weld zone results in a higher hardness than the manual welding and material brittleness increases with increasing hardness, the robot welding weld zone shows better high-cycle fatigue lives but poorer low-cycle fatigue lives than the manual welding.
Introduction
In the fabrication of hull blocks or construction equipment, welding between metal pieces is one of the essential joining methods between individual structures.1–3 The primary goals of any welding method are enhancing the reliability of welded structures by minimizing the weld defects and improving the welding productivity by reducing costs and manpower while completing the targeted structure within the set schedule, as well as enhancing the welding precision by minimizing the welding deformation of the fabricated structures.4–7 However, welding operations are very sensitive and welding conditions, skill levels, weld defects, and heat-affected zones (HAZ) created by the heat generated during welding cause changes in the mechanical properties.8–10 Since such weld defects and HAZ may change the microstructures of metals and consequently affect the material properties considerably, the fatigue strength of weld zones should be evaluated before the parts are applied to the actual products.11–15 In particular, the weld zone strength highly relies on the welding method. Therefore, the most appropriate welding method should be selected considering the type of parent metals being welded, required performance of the welding metal, welding postures, and welding and economic efficiencies.
In addition, even when the same welding method is used, different sizes of weld beads and HAZ are formed depending on the welding parameters, such as the level and duration of the current applied during welding, which lead to large differences in tensile and fatigue properties.16,17 Recently, with the development of robot welding (RW) techniques, the economic viability of manual welding (MW) has declined remarkably. Moreover, as the importance of cost saving has become widely recognized and the pending issues of productivity enhancement need to be resolved accordingly, the application of automated systems using robots has become a priority.18–20 The major advantage of RW is the productivity enhancement of uniform quality products, because robots can always guarantee the same operating conditions for welding.21,22 Regarding the static and dynamic mechanical properties, however, there is no study showing that the weld zone using RW has an improved fatigue strength in comparison with that produced by MW. Therefore, the purpose of this study is to analyze the quantitative differences between the effects of RW and MW on the low- and high-cycle fatigue lives of T-shaped weld structures made from SM50A carbon steel using CO2 gas arc welding. Another aim is to determine the underlying causes of such differences. This study can be used in the optimized design of welding process variables to obtain a more stable weld structure with longer service life, together with further systematic studies to derive the correlations between welding currents and voltages, welding speeds, weld bead sizes, and carbon concentrations as well as their effects on enhancing the fatigue strength of weld zones.
Materials and methods
Welding method
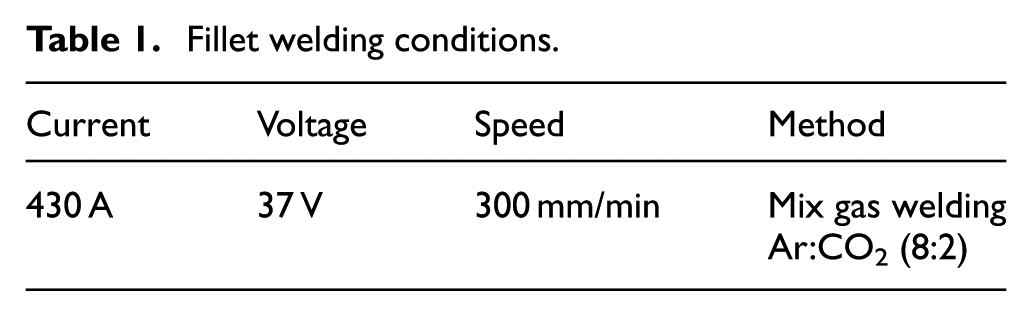
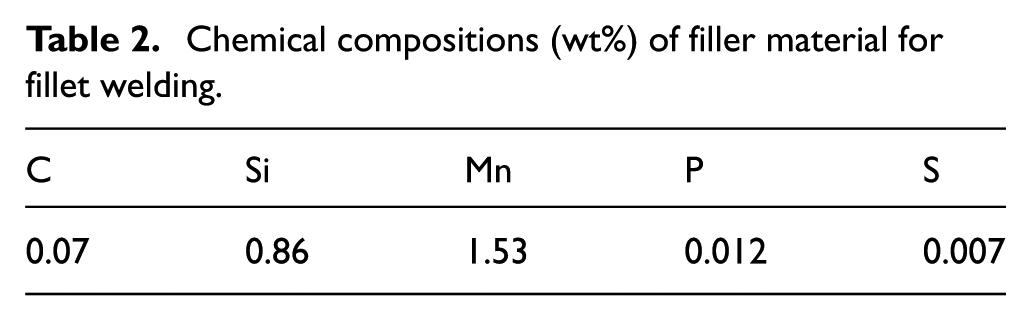
Both RW and MW were performed using CO2 gas arc welding with the same welding processes at a current level of 430 A and a voltage level of 37 V (Table 1). Filler material for the welding was Φ 1.2 mm KC-28 solid wires (AWS ER70S-6) whose chemical compositions were shown in Table 2. The reference welding speed was 300 mm/min. However, whereas the RW speed was assumed to be uniform, the MW was assumed to be performed at different speeds owing to the complex actions of the worker and welding rod feeding speeds.
Fillet welding conditions.
Chemical compositions (wt%) of filler material for fillet welding.
Specimens for material analyses
To determine the cause of differences in fatigue strength between the MW and RW weld zones, material analyses of the weld zone areas were conducted through the analysis process as shown in Figure 1. The differences in fatigue properties of the MW and RW in the low- and high-cycle sections were assumed to be the effects of weld zone ductility and brittleness. Therefore, the materials were analyzed focusing on carbon concentrations, which affect the ductility, brittleness, and hardness of materials.

Schematic of material analysis methods.
To analyze the materials of the MW and RW weld zones (weld beads and HAZ), test specimens were cut perpendicularly to their weld beads using a precision cutter (Figure 2(a)). A molding liquid made by diluting epoxy and a hardener at a ratio of 12.5:2 was injected into the cut surfaces to make the molding test specimens. Since air bubbles are generally formed in the process of diluting the epoxy and hardener, the epoxy molding test specimens were vacuum treated for 30 s after injecting the molding liquid in a vacuum chamber to remove the air bubbles. Afterward, the MW and RW molding test specimens were processed using 50 to 2400 sandpapers and finely ground with a 1 μm abrasive cloth. The ground surfaces were etched by immersing them into a 3% Nital etching solution for approximately 5 s. The etching solution was completely removed by washing the ground surfaces with flowing water. Thereafter, the molding test specimens were neutralized in an aqueous alkali solution and sufficiently dried to prepare the test specimens for the weld zone material analyses. It was observed that the weld zones (weld bead, HAZ, and parent metal) of the MW and RW test specimens were clearly visible even to the naked eye (Figure 2(b)).
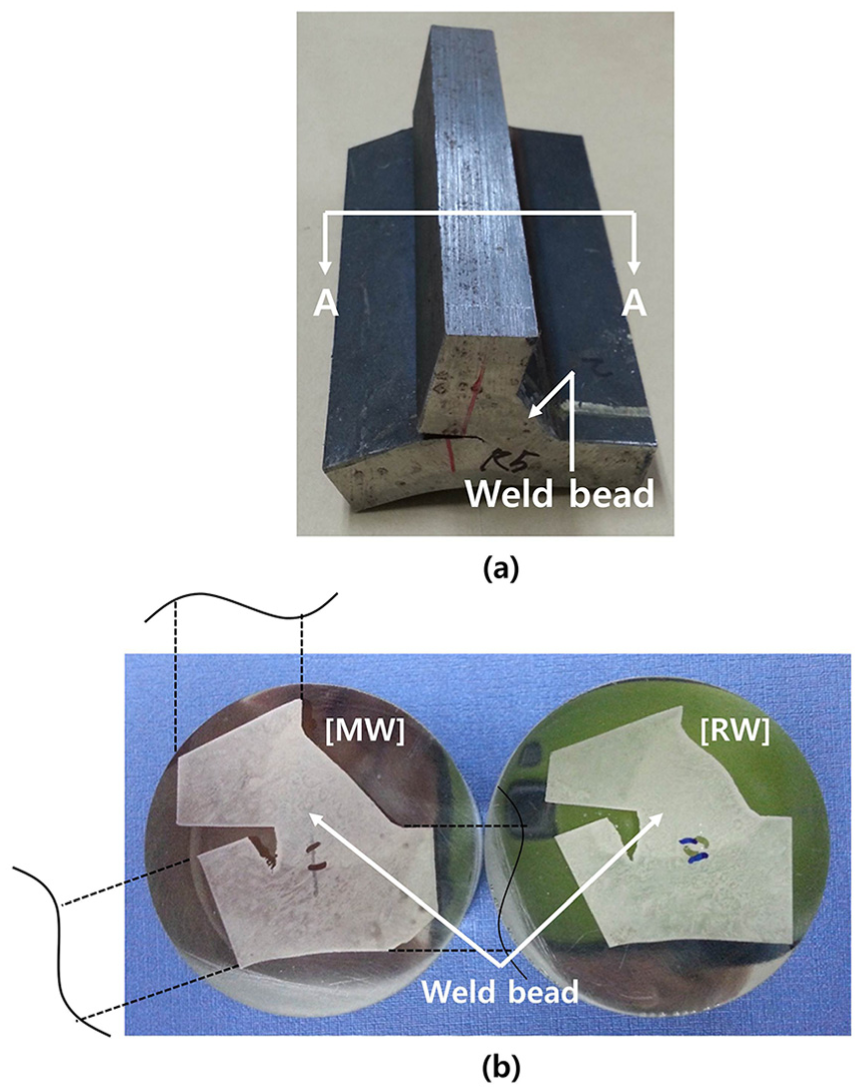
(a) A-A line cutting of T-shaped fatigue test specimens made by manual welding (MW) and robot welding (RW) after fracture and (b) epoxy molded specimens.
Microstructure analysis method
A stereoscopic microscope (SMZ1000, Nikon, Japan) and an field-emission scanning electron microscope (FE-SEM) (S-4200, Hitachi, Japan) were used for the macroscopic observation of the test specimens. When observed macroscopically, the differences in the areas of the weld zones, which comprise both weld beads and heat-affected zones, between the test specimens were visible even to the naked eye. To quantitatively characterize the weld zone areas, the outlines of the MW and RW weld zones (weld beads and HAZ) were accurately extracted using the 3D-DOCTOR (Able Soft, United States), an image processing and analysis program, and the weld zone areas were calculated from the extracted cross-sections.
Electron probe micro-analysis method
Electron probe micro-analysis (EPMA; JXA-8100, JEOL, Japan) is a method of qualitatively analyzing the carbon contents based on the energy emitted when a particular voltage is applied to a test specimen. Analysis positions were designated as line patterns on the MW and RW weld zones (weld beads and HAZ) and a voltage of approximately 24 kV was applied to the weld zone along the designated lines. Then, the energy emitted from the weld zone was used to qualitatively analyze the carbon content profile patterns.
Hardness measurement method
The hardness levels of the MW and RW weld zones were measured to determine the relative differences in carbon concentrations using a micro-Vickers hardness tester (HM-200, Mitutoyo, Japan) at the same positions from which the distribution of carbon contents was analyzed through EPMA. The micro-hardness was measured for a total of 8 points while moving from the weld beads to the parent metal under the condition of maintaining a micro-load of 300 gf for 10 s (Figure 3).

Eight positions of micro-Vickers hardness (Hv) measurements and their pressure marks.
Fatigue test specimens and method
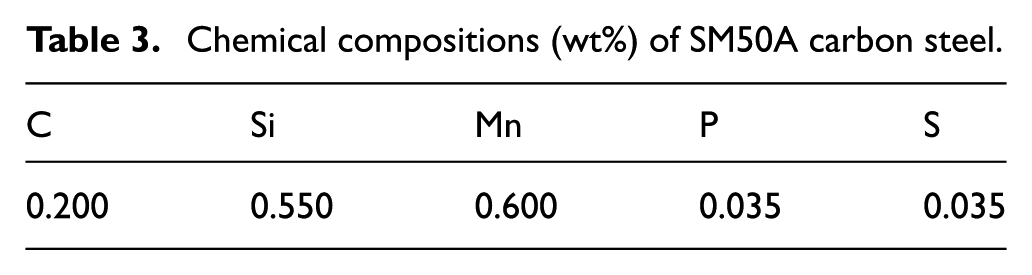
The material of the test specimens used in this study is SM50A, which is a rolled steel for weld structures applicable to heavy equipment used for construction. SM50A can be easily welded because it contains less than 0.2 wt% carbon (Table 3). The test specimens were divided into two types according to welding methods: MW performed by humans and RW performed by robots. The test specimens used in the fatigue tests were built into T-shaped structures using 15-mm-thick SM50A steel plates by MW and RW (Figure 4). To determine the differences of the weld zone shapes between the two types of test specimens, the widths of the weld beads were visually checked. When the weld beads of the two test specimens were compared, the differences were clearly visible (Figure 5). Therefore, to quantitatively examine the differences, the widths of the weld beads were measured using a three-dimensional scanner (COMET IV, Steinbichler, Germany) with a precision degree of 0.024 mm and maximum measurement range per time of 380 mm × 380 mm. The created scan data (Figure 6) were imported to CAD software (CATIA V5R19, France) to accurately measure the widths of the weld beads, which were measured at 9 points per test specimen at intervals of 10 mm. The results of the measurement showed that the weld bead widths of MW (WMW) were 15.68 ± 0.28 mm (n = 63: 7 test specimens × 9 points), and the weld bead widths of RW (WRW) were 13.16 ± 0.24 mm (n = 63: 7 test specimens × 9 points) indicating that the WMW values were larger by approximately 2.5 mm than the WRW.
Chemical compositions (wt%) of SM50A carbon steel.

Dimensions of the T-shaped specimen (units: mm).

Weld bead areas of both manual welding (MW) and robot welding (RW). The width of weld bead in MW (WMW) is bigger than that in RW (WRW).

3D scanning images of the width of weld bead: (a) 3D scanning machine, (b) MW, and (c) RW.
In this study, the MTS 809 with a maximum capacity of 10 tons (Figure 7) was used for fatigue tests. Three-point loading jigs were fabricated to obtain an identical semicircular-shaped (r = 15 mm) support and loading points, and the surfaces of the regions in contact with the T-shaped test specimens were mirror polished to maximally reduce the frictional resistance. When the three-point bending fatigue tests were performed, the test specimens were placed in the middle of the support points, and loads were applied at the center point of the distance between the support points to generate the bending stress. In terms of fatigue loading conditions, the sinusoidal loading profile was set to a cyclic frequency of 5 Hz and a stress ratio of R = 0.1. The fatigue tests were performed until the test specimen was completely fractured. The reference life for fatigue limits was set to 1 × 10⁶ cycles, and cycles exceeding this value were treated as outliers of the obtained S-N curves.

Three-point bending fatigue test machine with specimen and loading jigs.
Results and discussion
Microstructure analysis
The area of the weld zone (weld beads and HAZ) for the MW (180 mm2) was larger by approximately 12% compared with the RW (161 mm2), as shown in Figures 8 and 9. The dilution

where

SEM images for measurements of (a) weld bead and heat-affected zone (HAZ) areas, SiC particles on (b) weld bead and (c) HAZ in MW. Here,

SEM images for measurements of (a) weld bead and heat-affected zone (HAZ) areas, SiC particles on (b) weld bead and (c) HAZ in RW. Here,
EPMA
Figure 10 shows the profiles obtained through qualitative analyses of the carbon contents using EPMA after matching all analysis scales. In the analysis results, slightly higher profile patterns were found in the RW weld zone than the MW, which implies that the RW weld zone has slightly higher carbon contents than the MW.

Carbon contents by electron probe micro-analysis (EPMA) as a function of distance in the line patterns on (a) weld bead, (b) heat-affected zone (HAZ) in MW, (c) weld bead, and (d) HAZ in RW.
Hardness measurements
In the hardness measurement, an average hardness value of 244 Hv was measured in the RW weld beads (1, 2, and 3 positions; Figure 3), which was 30 Hv higher than the value of 214 Hv measured in the MW weld beads (1, 2, and 3 positions). Similarly, an average hardness value of 230 Hv (4 and 5 positions) was measured in the RW HAZ, which was 15 Hv higher than the value of 215 Hv (4 and 5 positions) measured in the MW HAZ (Figure 11). According to our previous finding that the grain size of material, which was changed by the repeated heating and cooling cycles, nonlinearly decreased with increasing hardness, we believe that the grain size of the RW weld zone is smaller than the MW because the hardness of the RW is higher than the MW. 23

Micro-Vickers hardness (Hv) values of MW and RW weld zones (weld beads and HAZ) and base metal.
Fatigue tests
After conducting fatigue tests of the T-shaped welding test specimens made through MW and RW using the SM50A carbon steel, the S-N curves of the two types of test specimens were obtained (Figure 12). From the S-N curves of MW and RW, the equations that are linear in the log–log scale were obtained and then the scales of the equations were changed into decimal scale to obtain the following equations


Comparison of the MW (black diamond, ♦) and RW (white diamond, ◇) fatigue test results presented with the upper and lower limits of 95% confidence level.
Since a large scattering in the S-N curves that has always existed in the results of fatigue tests of welded structures cannot be ignored, the scattering was estimated using the linear regression model of the result data, and the coefficient of determination (R2) was obtained to investigate the significance of the scattering. For the two S-N curves, the value of the coefficient of determination (R2) of the MW was measured to be 0.9974 while that of the RW was measured to be 0.9985. Since the significance of the linear regression analysis models becomes larger as the values of the coefficient of determination (R2) approach 1, the analyses of differences in trends using the two S-N test curves are assumed to be sufficiently feasible considering the fact that both the R2 values of MW and RW fatigue test results are at least 0.997 (although the number of test specimens used in the fatigue tests is small). The fatigue lives for the two welding methods were compared, and it was observed that the S-N curves crossed each other at 480 MPa and 3 × 10⁴ cycles, which is the boundary between the low-cycle and high-cycle fatigue.
Regarding the reasons for such crossing of the S-N curves, we try to explain it from the following two viewpoints. First, as the RW weld zone was found to have slightly higher carbon contents than the MW based on the abovementioned FE-SEM and EPMA analyses (Figure 10), the higher hardness level of the RW weld zone might be considered attributable to the slightly higher carbon concentration. In this viewpoint, the differences in the weld zone areas are considered to be the main reason for the differences in the fatigue strengths between the MW and RW, because the weld zone area affects the carbon concentrations and consequently affect the mechanical properties of the weld zone, finally leading to differences in the fatigue strength. A difference in the molecule concentration gradient results in the diffusion of the molecule according to the following Fick’s law

where
Second, however, in our previous finding, we observed that grain size of material, which was increased by the repeated heating and cooling cycles, nonlinearly decreased with increasing hardness. 23 Therefore, we believe that the hardness of the RW weld zone higher than the MW results more likely from a smaller grain size in the RW weld zone rather than a difference in the SiC content between the RW and MW weld zones. Because SiC is a very hard material, the overall hardness of the region with SiC will increase significantly with a little presence of SiC. However, such a significant difference in the hardness between the MW and RW weld zones is not evident from Figure 11, and the content of Si, as well as C in filler material (Table 2) and the base metal (Table 3), is insufficient to form SiC. As observed in our previous study, 23 the larger grain size of the MW weld zone than the RW could be caused by the amount of heat input larger in the MW than in the RW due to the slower welding speed of the MW method. Although we did not measure the amount of ferrites in the MW and RW weld zones from microstructure analyses, we also expect that the larger grain size as well as the lower hardness in the MW weld zone is associated with the amount of ferrites larger in the MW weld zone than in the RW (Figures 8 and 9) because ferrites are known to grow at grain boundaries with high energy and the amount of heat input in the MW weld zone is larger than the RW.
In the low-cycle fatigue region, the plastic deformation is dominant due to higher stress levels than the yield point, and a larger fraction of fatigue life is occupied by the crack growth than the crack nucleation. In general, the crack growth is calculated by the Paris equation

where a is the crack length; N is the number of loading cycles; A and n are the coefficients of the intercept and slope in the log scale, respectively, and
Finally, the main limitation of this study is that the number of samples for each testing stress level for the fatigue tests was too few to obtain reliable statistical analysis results. Nevertheless, when the fatigue lives of the MW and RW weld zones were compared at the same stress of 800 MPa in the low-cycle fatigue region where the weld zone is subject to high stress, the fatigue life of the MW weld zone was 1.67 times higher than that of the RW. However, in the high-cycle fatigue region where the weld zone is subject to low stress, the fatigue limit of the RW (253 MPa) was 1.12 times higher than that of the MW (227 MPa). Although the fatigue life of the MW weld zone was observed to be better than the RW at a stress level of 800 MPa, no significant difference in the overall S-N curves between the MW and RW indicates that the effect of the two welding methods on the fatigue behavior of their weld zones is unaltered. This may suggest that the RW method is more preferable as it is capable of maintaining consistency in the welding process parameters such as the welding speed during the entire course of the welding process as compared with the MW.
Conclusion
The RW and MW effects on the fatigue of SM50A carbon steel weld zones were analyzed in this study. The RW weld zone showed better fatigue life at 800 MPa, but slightly poorer fatigue life than the MW at 227 MPa. However, no significant difference in the overall S-N curves between the MW and RW except these two stress levels may suggest that the RW method is more desirable due to its advantage in maintaining consistency of welding process parameters than the MW. Further systematic studies to derive the correlations between welding parameters (welding currents, voltages, and speeds) and weld zone microstructures, as well as their effects on the fatigue strength of weld zones, can contribute to the design of the optimized welding process parameters in the RW method.
Footnotes
Acknowledgements
C.H. and C.Y. contributed equally to this work.
Handling Editor: Daxu Zhang
Declaration of conflicting interests
The author(s) declared no potential conflicts of interest with respect to the research, authorship, and/or publication of this article.
Funding
The author(s) disclosed receipt of the following financial support for the research, authorship, and/or publication of this article: This work was supported by a 2-year research grant of Pusan National University.