
Abstract
Fixed-time traffic signal control strategy in an isolated pedestrian crossing tends to reduce traffic capacity and expose vulnerable road users to more danger. To mitigate the negative impact of previous control strategy, this study proposed an optimal real-time signal timing strategy to protect pedestrian crossing and at the same time minimize the system-wide traffic delay. With the application of a wide-area radar data, the features of vehicles, pedestrians, and the passing time of non-motor vehicles and pedestrian were captured considering conflicts and traffic delay. The support vector machine for regression was utilized to hypothesize traffic delay by training. The discrete values of hypothetical passing time will be tested. The minimum value of delay can be recognized and the corresponding hypothetical passing time will be recommended as the green time for crossing. The performance of the proposed ORSTS outperformed the fixed-time traffic signal control strategy in reducing traffic delay by 22.3%.
Introduction
China’s urban traffic has been experiencing exponential growth in recent years. In busy commercial blocks or arterial roads with heavy traffic, vulnerable road users, pedestrians in particular, are more likely to face greater danger when crossing roads. The main causes are lack of appropriate pedestrian crossing facilities 1 and precise signal timing. 2
Presently, a considerable number of pedestrian crossings in China are actualized without signals. Studies3,4 have shown that non-signal control tends to obstruct traffic flows and deteriorate the safety of pedestrians. In addition, at signalized crossroads with fixed-time traffic signal control, the fluctuation of traffic demand in peak and off-peak periods are often ignored. Therefore, fixed signaling is prone to cause inefficiency in pedestrian passing time. 5
Later, researchers proposed real-time signal control with the application of many new technologies to this area. To better capture the features of road users, computer image processing has shown its advantages for real-time performance.6,7 Machine learning techniques also play important roles in optimizing the strategies for traffic control. In previous studies, neural network, 8 Q-learning, 9 support vector machine, 10 fuzzy logic, 11 and other methods are proposed to deal with streaming data to mine out the potential value, which were effective to support traffic control design.
In terms of the evaluation of real-time strategies, different criteria are adopted in response to different circumstances. In the arterial road of heavy traffic, more consideration needs to be provided toward vehicular delay 12 as well as traffic pollution. 13 Areas with more pedestrians receive more attention due to the delay of pedestrians 14 and traffic conflicts between the different road users. 15
However, in actual traffic control, capturing images by camera to split different features may fail to meet the needs of desired efficiency. The accuracy, real-time performance, and robustness of the system can also be greatly influenced by obscured cameras, light intensity changes, bad weather, and so on.
In this article, an optimal real-time signal timing strategy (ORSTS) for an isolated pedestrian crossing was proposed. Due to the necessity of eliminating noise, radar data were applied to track the location and record the real-time speed of pedestrians and non-motor vehicles within 200 m of a signal. Support vector machine for regression (SVR) was utilized to solve the problem of insufficient amount of data in short-term forecasting, since it offers nonlinear function approximation and global optimal solutions in comparison to other algorithms. 16 The sum of vehicular delay and pedestrian delay is employed as the evaluation method for the proposed strategy.
The contents of this article are organized as follows: section “Methodology” reviews data acquisition method, definition of traffic delay based on radar data, and SVR for delay time regression. Two algorithms were depicted for optimal timing. Experimental data and results are shown in the “Analysis and results” section. Adjustment to the weights of vehicle delay, pedestrian delay, and significant results can be inferred in the “Discussion” section. Finally, the findings are summarized in the “Conclusion” section.
Methodology
Support vector regression
SVR is a subfield of supervised learning utilized to give prediction. Different from other machine learning algorithms, SVR trains parameters matrix Θ by optimizing its insensitivity ε, as shown in Figure 1. Minimizing the error of the training set is treated as an essential restriction, instead of the optimal goal. SVR applied kernel functions to map nonlinear problems to high-dimensional feature spaces and constructing linear functions. Compared to other machine learning algorithm, especially neural network, SVR performed better with small samples. In addition, SVR can better fit multidimensional data, avoiding the curse of dimensionality.

The ε-insensitive tube of SVR.
The training sample is assumed to be
Define an error function as follows

where
In the practical issues to be covered, the input vector
In order to solve the under fit in a linear regression, nonlinear regression is utilized to give the optimal hypothesis in the form of

The equivalent question is to select an optimal parameter vector by training it to

where C is the “Penalty coefficient” which “punishes” the error between the hypothesis and the actual value subject to

The standard dualization utilizing Lagrange multipliers is proposed 18 to get the optimal solution of the hypothetical function

where
Acquisition of quantitative variables
Division of experimental zones
A two-way-six-lane arterial road (Nanjing Zhongshan Gate Street) was selected as the experimental subject. As shown in Figure 2, a coordinate system was established and divided the experimental subject into multiple zones:
Zones 1 and 2: The waiting areas for pedestrians and non-motor vehicles before crossing the motorway.
Zone 3: Motor vehicles’ delay area. As entering this area, vehicles begin to slow down.

Division of experimental zones.
Varhelyi 19 shows that drivers determine whether to brake at 50 m upstream of the stop line. However, due to the difference in geometric design and other factors, this fixed area division cannot be generalized and will cause errors in the calculation of actual delays.
Therefore, we provide a division method based on historical data captured by radar.
With an optimal algorithm for tracking slow targets, ith pedestrian’s velocity can be calculated as
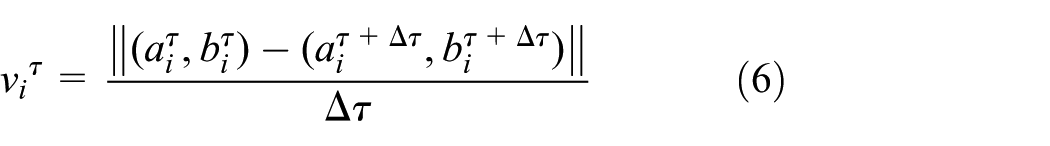
When

Acquisition of pedestrian features
The average speed
Input feature vector of SVR.

Which will be given in the following section.
Definition of traffic delay
1. Vehicle delay
The velocity of the ith vehicle starting to decelerate is

Statistically, the average delay

where
2. Pedestrian delay
Non-motor vehicles have the same characteristics of delay as pedestrians waiting in red light, so these two types of delay can be categorized as pedestrian delay. In previous studies, pedestrian delay was calculated in fixed models. However, some idealized parameters are difficult to be collected in actual observation. Moreover, pedestrian delay due to traffic conflicts when crossing the road will be compensated in the calculation of vehicular delay. Therefore, pedestrian delay is only considered when it is caused by waiting for a red light. So, the average delay time of pedestrians is

where M is the number of pedestrians waiting in the waiting areas,
ORSTS based on machine learning method
As shown in Algorithm 1, a SVR with a Gaussian kernel is utilized to give hypothesis on delay. We used a time-sharing training strategy to make the results more accurate, in which training sets were chosen to give hypothesis on corresponding periods in a day, and different traffic features of different weekdays or holidays are also considered.

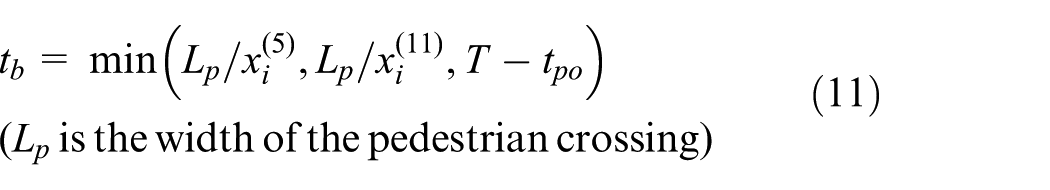
Before the end of the signal cycle, what the system can achieve from radar is only
In order to eliminate the impact of signal cycle changes on the relative pedestrian crossings and intersections, the cycle T obtained under the fixed timing optimization remains unchanged.
Analysis and results
In the experiment, peak periods during five continuous Mondays were observed. There were 221 effective ones in 230 selected signal cycles. The signal cycle was fixed to 130 and 24 s for pedestrians and nonmotor vehicles to pass the motorway, respectively. Table 2 shows part of the experiment data.
Traffic feature vectors and delay time.

Initially, we chose 135 samples as the training set, 43 samples as the cross-validation set, and the remaining 43 samples as the test set. In order to prevent the SVR algorithm from over fitting or under fitting, in the cross-validation set, we plotted a learning curve (Figure 3) to describe the relationship between the average regression cost of the cross-validation set and the number m of training sets.

The relationship between the regression cost of the cross-validation set and the number of training sets.
As the learning curve shown in Figure 3, the cost reaches its extreme value at m = 87, where the training strategy gets the best generalization ability, and 87 was finalized as the size of the training set. Figure 4 shows the prediction value of SVR, indicating that SVR regression has a strong generalization ability.

The comparison of hypothesis and actual values of delay time in the test set.
With permission, we applied the proposed ORSTS to the study area to evaluate the real-world effect. Optimal timing is implemented after capturing the feature vector and Table 3 shows the results, highlighting the overall reduction in delay.
Comparisons of the ORSTS with fixed signal control on delay time.

ORSTS: optimal real-time signal timing strategy.
Discussion
To what degree to reduce vehicle delay time or pedestrian delay time is distinguished under different traffic conditions. Studies21,22 show that when the waiting time at the pedestrian crossing is too long, even if under the maximum endurance time, pedestrians tend to cross the road in the red light time. Pedestrian delay should be a priority in commercial blocks and areas where large number of pedestrians assemble. Meanwhile, in arterial roads with heavy traffic and few pedestrian crossings, vehicle delay should be considered more.
This can be reflected by setting different weights for
Conclusion
In this study, we proposed an ORSTS to protect pedestrian crossing and at the same time minimize the system-wide traffic delay. To reduce the lack of robustness of real-time timing systems based on image processing, a wide-area radar is utilized to capture features. The support vector regression was trained using the real-time data to optimize real-time traffic signal timing. The experimental areas’ division method based on machine learning was proved to improve the accuracy of the proposed strategy. Results of contrasting experiments show that the ORSTS outperformed the fixed-time signal timing strategy in reducing the traffic delay and improves the safety of pedestrian crossings.
Footnotes
Handling Editor: Martin Baumann
Declaration of conflicting interests
The author(s) declared no potential conflicts of interest with respect to the research, authorship, and/or publication of this article.
Funding
The author(s) disclosed receipt of the following financial support for the research, authorship, and/or publication of this article: This study was supported by the National Key Research and Development Program of China (Grant No. SQ2018YFB160031_2), the National Science Foundation of Jiangsu Province (Grant No. BK20160685), the National Natural Science Foundation of China (Grant No. 61620106002), the China’s Post-doctoral Science Fund (2015M572728), and the Opening Foundation of Intelligent Transportation Information Sensing and Data Analysis Engineering Laboratory for Jiangsu Province.