
Abstract
Some intersection approaches have right-turn lanes and/or auxiliary through lanes that are short in the sense that during the queuing process, entry to these lanes can be blocked by the queue in the adjacent continuous lane, limiting their capacity contribution. Conventional capacity and signal timing methods typically treat these lanes as full additional lanes, which can result in large errors in estimates of capacity and delay. This paper develops a consistent method for capacity analysis, signal timing design, and delay estimation at signalized intersections with short added right-turn and auxiliary through lanes. Short lanes are modeled as providing “bonus flow” per cycle, equal to their functional storage capacity, rather than a contribution to saturation flow rate. In analysis, this bonus flow is represented as negative lost time—a head start equivalent, allowing the proposed model to be implemented in conventional analysis with minor modifications. This study shows that with short added lanes, capacity per hour does not increase with cycle length as much as conventional methods predict, because the benefit of fewer switches per hour is offset by fewer green starts, thus less bonus flow. It is also possible for an intersection’s sum of critical lost time to be negative, in which case there is a unique cycle length that maximizes capacity—a short cycle with a red interval just long enough to replenish the short lane. Intersection-level capacity and saturation flow rate measures are proposed. Reservice is demonstrated to be a promising strategy, offering a capacity gain of 21% in one example.
Introduction
On approaches to signalized intersections, auxiliary through lanes and right-turn lanes are sometimes added to increase capacity. However, if an added lane is short, its contribution to capacity can be limited if the queue in the adjacent continuous lane can grow to the point that it blocks entry to the added lane. Likewise, if a high proportion of traffic is turning right, the right-turn lane queue can spill back into a through lane, creating a zone of unused capacity between the stop line and the spillback point.
The same phenomena can also happen with short left-turn lanes ( 1 ). However, added left-turn lanes involve additional complexity because left turns often run in a different phase from the through movement, and even when they run concurrently, discharge is often blocked as left-turning vehicles wait for a gap in opposing traffic. The staggered discharge that usually accompanies left-turn lanes result in more complex queue interactions ( 2 ), which are beyond the scope of this study. This study considers only added lanes that discharge concurrently with the through movement—thus, auxiliary through lanes and most right-turn lanes. Right-turn lanes that have a distinct phase are thus excluded, though many of the phenomena this paper discusses apply to them as well. For auxiliary through lanes, the scope is limited to where there is no downstream lane drop that creates a bottleneck, because lane drops create their own queue that can interact with the traffic signal’s queue.
The phenomena of entry blockage and spillback with short added lanes have long been recognized. Early studies ( 3 – 5 ) focused on preventing spillback by developing guidelines for the length of added right-turn and auxiliary lanes. Standard guidance found in the American Association of State Highway and Transportation Officials (AASHTO) Green Book ( 6 ) is to size added lanes for 1.5 to 2.0 times the expected number of vehicles expected to use the lane per cycle. However, little attention has been given to preventing the queue in the continuous lane from blocking entry to the added lane. The Highway Capacity Manual (HCM) ( 7 ) intersection capacity method fails to account for entry blockage, in effect assuming an infinite lane length. Synchro ( 8 ), a popular software that implements the HCM method, treats short added lanes as a full length lane. In recognition of spillback risk, it provides a warning if a lane’s predicted queue length (determined assuming unlimited length) exceeds its specified length; however, no warning is given if the continuous lane queue length is enough to block entry to an added lane. As a result, in industry practice, the capacity contribution of added lanes can be grossly overestimated when using HCM-based methods. Practitioners, recognizing that a short added lane will not offer the same capacity as an additional full lane, sometimes apply a lane utilization factor (LUF), an adjustment factor in the HCM capacity methodology that provides a way to essentially treat a full lane as a fraction of a lane (or, equivalently, as a lane whose saturation flow rate is a fraction of that of a normal lane). This paper will show the inadequacy of this approach.
This study was motivated by two Boston intersections with short added auxiliary through lanes and right-turn lanes that are notoriously congested, with queues that persist for hours and often extend back through one or more upstream intersections. In both cases, the approach with added lanes is the discharge from a bridge that flares (i.e., adds lanes) where the bridge meets land shortly before an intersection. The poor performance of these intersections is likely attributable to signal timing plans developed using HCM-based methods that expected those added lanes to contribute far more capacity than they do. This study aims to develop a simple yet correct method of capacity estimation for such scenarios, building as much as possible on standard capacity analysis principles. As the title of this paper suggests, we found that the capacity contribution of a short added lane can be modeled as a negative lost time adjustment. This paper aims to answer the following questions:
Can a simple model estimate the capacity of an approach with short added lanes, and under what conditions?
For intersections with short added lanes, how does capacity vary with cycle length? And how does the possibility of negative lost time affect capacity and cycle length analysis?
How do short added lanes affect uniform delay?
What signal timing strategies might be well suited to approaches with short added lanes?
This study proposes a framework for closed-form estimation of approach-level and intersection-level capacity, effective saturation flow rate, optimal cycle length, and uniform delay, accounting for the effects of short added lanes. In the following section, the problem is broken down and defined, and prior works on short added lanes are reviewed. In later sections, a solution framework is proposed, extended to more general cases, and validated through PTV VISSIM simulation. Finally, signal timing strategies are proposed with examples to optimize the throughput at intersections with short added lanes.
Problem Definition and Literature Review
Figure 1 shows an approach with an added right-turn lane and an added auxiliary lane. This figure assumes that the fraction of arriving vehicles that want to use an added lane is small enough that, as queues grow and reach the diverge point, it will be the queue in the continuous lane that virtually always blocks entry to the added lane, as opposed to the queue in any added lane spilling back to block the continuous lane. (Later, this latter assumption will be relaxed.) As a result, the continuous through lane and added lanes should be recognized as a single movement group, because the movements using them share a common queuing area (the area upstream of the diverge point). Variables used in the analysis are defined in Table 1.
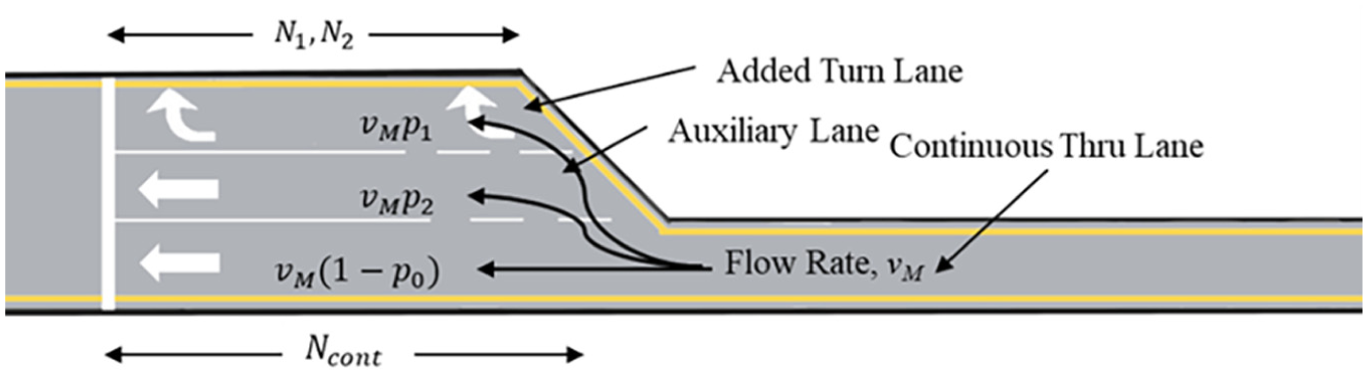
Approach layout with added lanes.
Summary of Notations
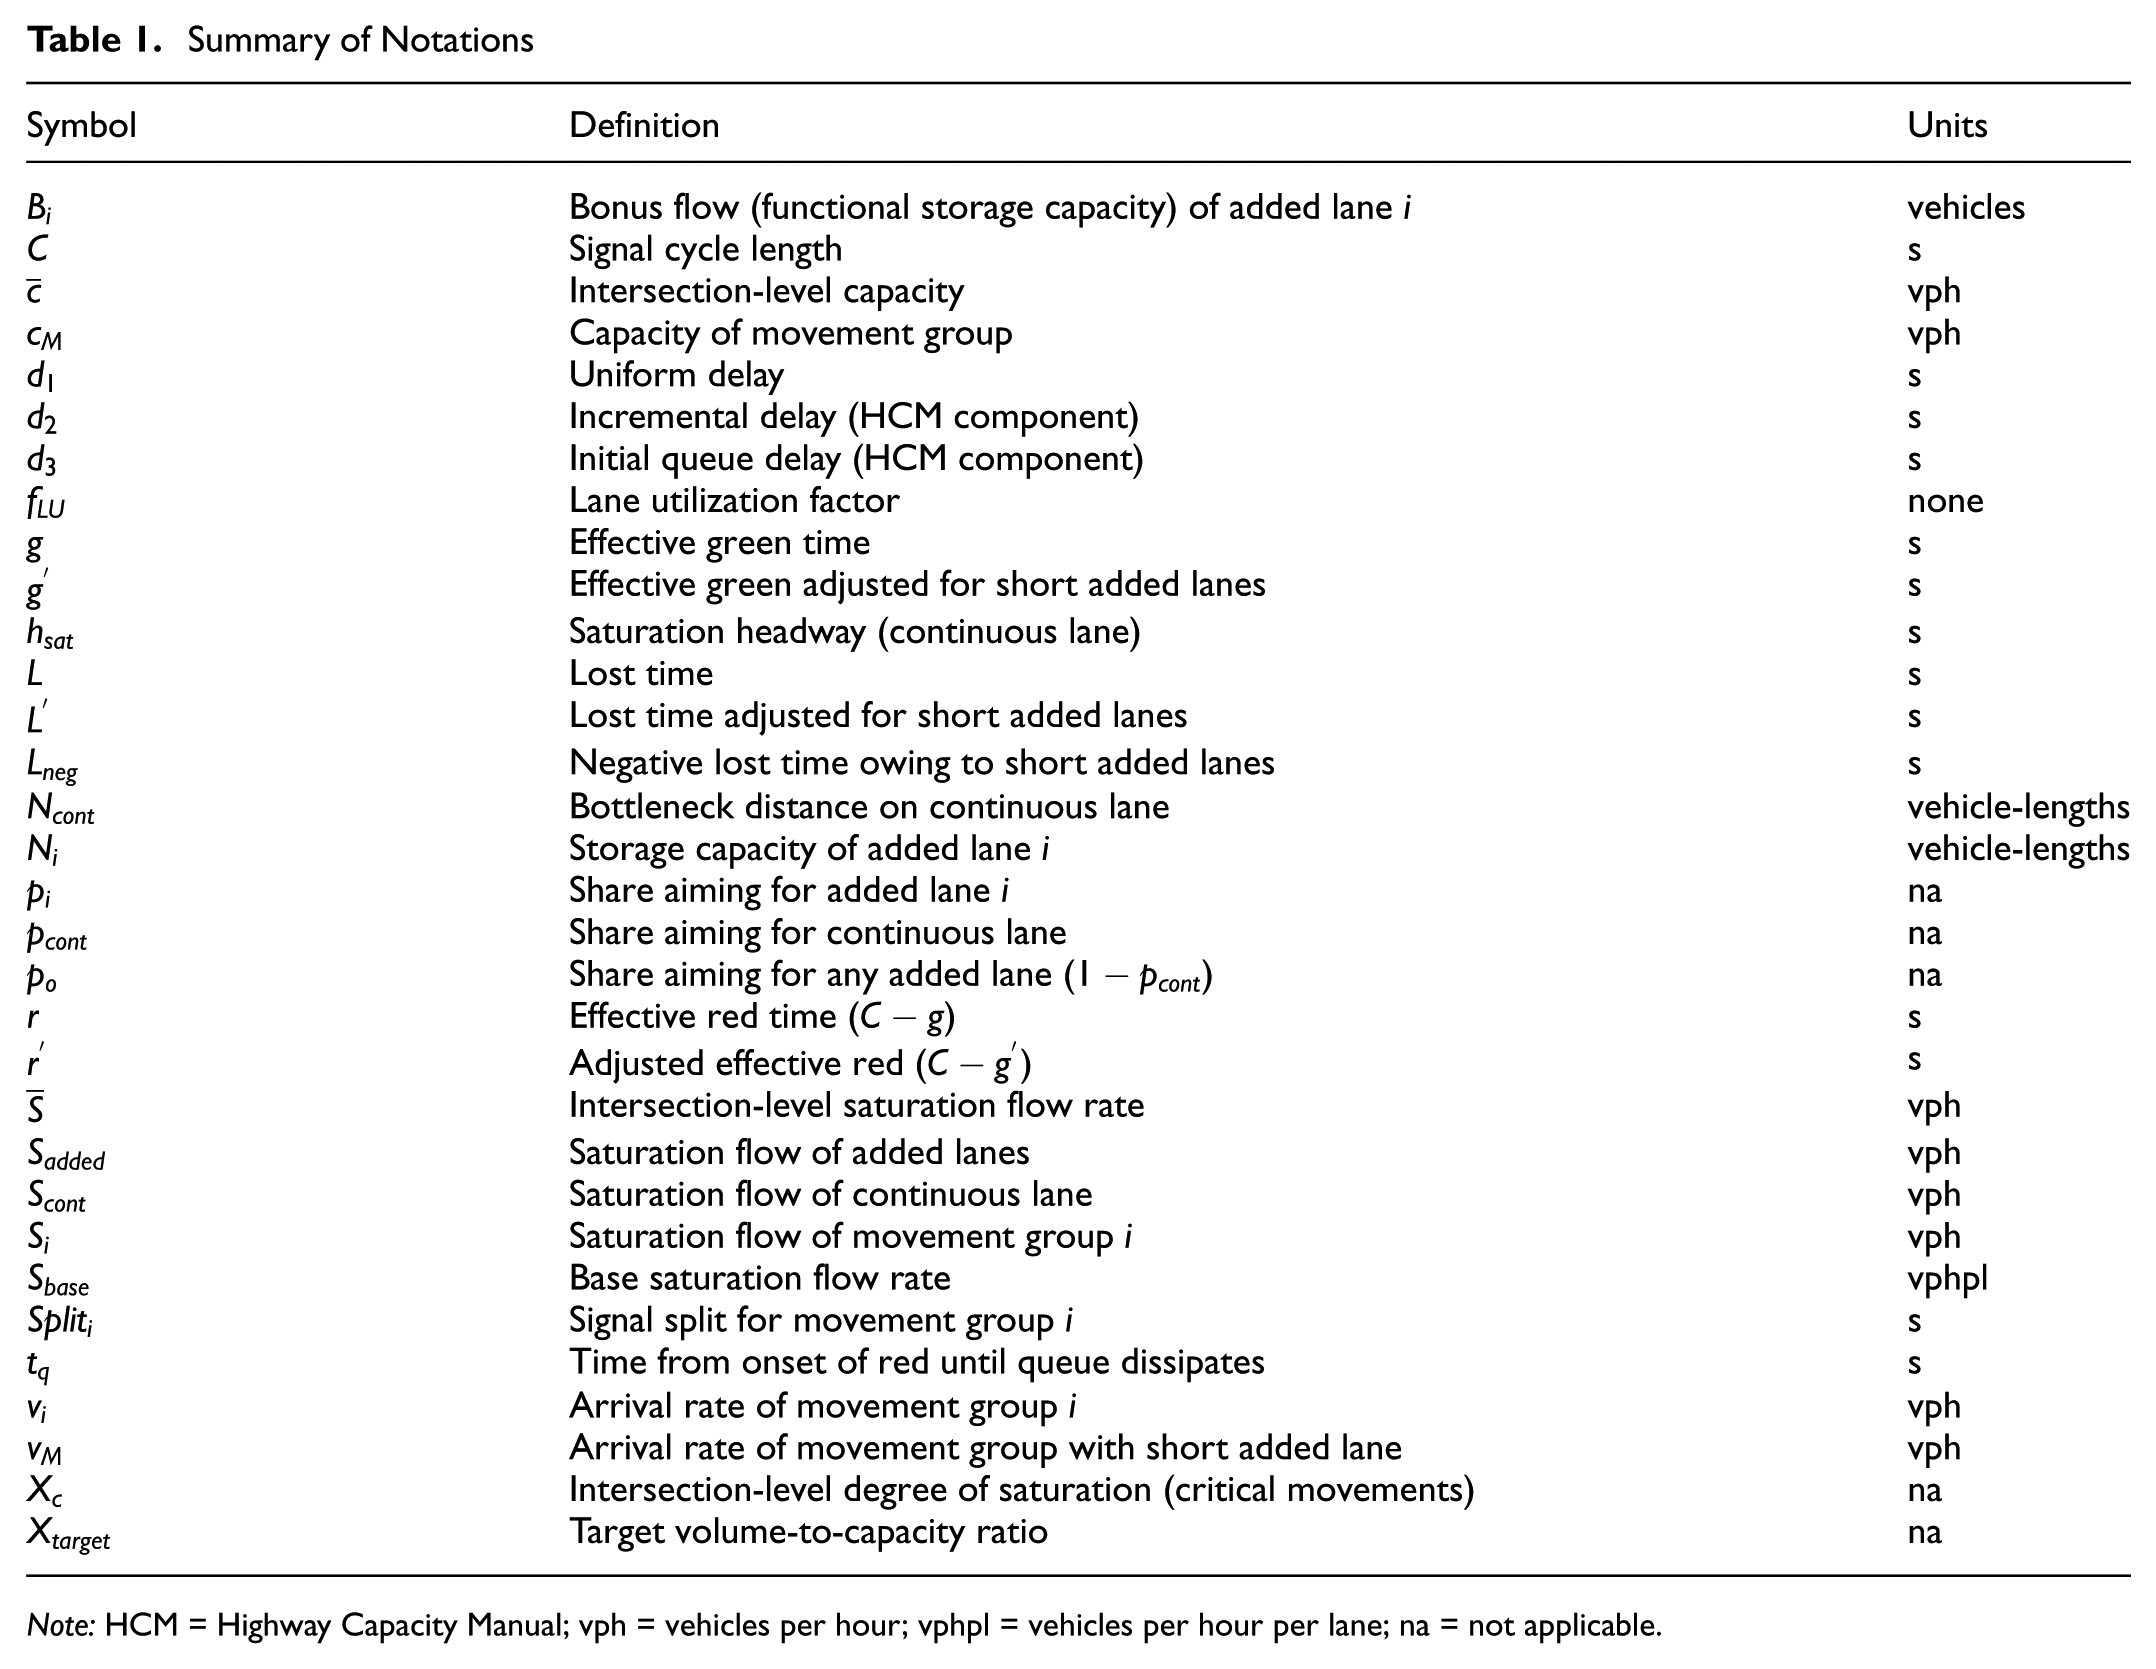
Note: HCM = Highway Capacity Manual; vph = vehicles per hour; vphpl = vehicles per hour per lane; na = not applicable.
The first researchers to formally recognize the phenomenon of entry blockage ( 9 – 11 ) modeled the probability that entry to an added lane is blocked and used that to determine the needed length of an added auxiliary through lane under varying lane preferences, arrival rates, and signal timings. Lin ( 9 ) attributed short right-turn lane underutilization to entry blockage and driver hesitation during right-turn-on-red (RTOR). Rouphail et al. ( 12 ) developed a step-by-step approach to size auxiliary lanes added on both the upstream and downstream sides of an intersection. While their guidelines acknowledge queue interactions, the impact on capacity is indirectly addressed through geometric design rather than planning formulas. Lin ( 9 ) and Farivar and Tian ( 13 ) has shown how, where RTOR is allowed, entry blockage to short right-turn lanes can substantially increase delay to the right-turn movement.
Tian and Wu ( 14 ) were the first to explicitly model the capacity effects of short added lanes, accounting for both spillback and entry blockage. Zhao et al. ( 15 ) built on the entry blockage model of Tian and Wu, but when it came to estimating capacity, they wrongly assumed the short lane fills to its physical storage capacity. Some recent literature has studied the capacity impacts of short left-turn lanes, developing probabilistic capacity analysis for leading-protected, lagging-protected, and protected-permitted left-turn phases under Poisson arrivals ( 16 ) and for various short-lane lengths, green intervals, and turning proportions ( 17 ). These studies indicate that with short left-turn lanes, an approach’s capacity is highly sensitive to phasing strategy because of how left-turn bay spillback can block through flow. Although these studies investigate left-turn bays, the probabilistic process they employ can be transposed to right-turn lanes.
Figure 2 is a time–space diagram showing how the queue in the continuous lane evolves during a cycle. Trajectories in orange are vehicles aiming for an added lane, assuming
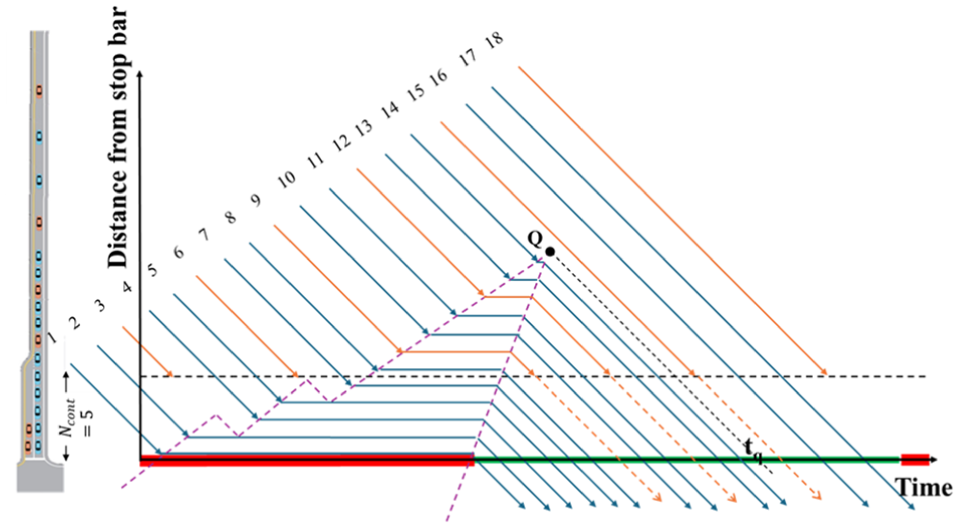
Queue evolution in the continuous lane when
This example shows that the contribution of the added lane to approach capacity is simply in discharging the vehicles that stack in the added lane before entry becomes blocked, which in this example is two per cycle. We call this the bonus flow associated with a short added lane; bonus flow can also be seen as an added lane’s functional storage capacity, which can be substantially less than its physical storage capacity.
It is well recognized that driver willingness to use auxiliary through lanes can be small and varies greatly from site to site (
3
,
5
,
19
); in our model it is an exogenous parameter
Entry blockage can be modeled as a discrete probabilistic process during the red interval. Vehicles arrive at the entry point and independently choose between the continuous lane and an added lane based on lane preferences:
The queuing process can be simplified for cases in which driver preference for the added lanes is low enough that entry blockage is almost certain to occur before spillback could occur. A low preference for using added lanes is a common situation, as acknowledged by previous research (
3
,
5
,
19
,
22
). With this assumption, functional storage capacity of a short added lane, defined as the expected number of vehicles that queue in the added lane before entry blockage occurs, can be determined by modeling arriving vehicles as a series of independent trials. The number of vehicles choosing added lane
Equation 1 shows the functional storage capacity, also called bonus flow, of an added lane. The equation assumes invariant lane preferences and sufficient red time for the queue to reach beyond the bottleneck. Vehicle interactions while discharging and spillback from the added lane into the continuous lane are not represented in equation 1, and so it applies only when added lanes discharge concurrently with the continuous through lane and when preference for added lanes is small enough that turn lane spillback is highly improbable.

where
For capacity analysis, a movement group with one continuous through lane and one or two short added lanes should be modeled not as an approach with two or three lanes, but as an approach with only one lane, the continuous through lane, plus a bonus flow per cycle from the added lane(s). It should be remarked that because right-turns will take place from an added lane, added lanes may also contribute to capacity by increasing Scont, the saturation flow rate of the continuous lane, relative to what it would be without added lanes inasmuch as they protect the continuous lane from disturbances owing to right-turning vehicles slowing down or yielding to pedestrians.
McCoy and Tobin ( 4 ) developed a regression model to estimate the mean number of through vehicles per cycle discharging from auxiliary lanes. Other researchers and practitioners have also recognized that the capacity contribution of short lanes can be modeled as bonus flow per cycle, but without discovering that bonus flow can be derived from a probability process as in Equation 1. For example, the Hong Kong Transport Planning and Design Manual ( 28 ) recommends that the capacity contribution of short lanes should be quantified as a fixed number of vehicles per cycle, but it does not explain how to determine this number of vehicles.
Simulation-based studies further confirm the shortcomings of standard capacity estimation methods. Using PTV VISSIM microsimulation, two studies ( 16 , 18 ) demonstrated that the HCM theoretical framework fails to capture the nonlinear nature of short-lane capacity contribution. A more recent study ( 29 ) used regression analysis on CORSIM simulation results to estimates capacity adjustment factors for the length of left-turn bays, suggesting that the effective length of a short lane can be less than its physical length. Schmitz et al. ( 30 ) proposed a revised capacity model calibrated to microsimulation results to adjust terms to match short-lane effects. Recent research has demonstrated that microsimulation outcomes are highly sensitive to calibration assumptions ( 31 ). While models relying on microsimulation calibration can be accurate, they cannot be incorporated into creating signal timing plans and may be challenging to extrapolate.
As we discussed, actual utilization of an auxiliary lane depends not only on driver preference, but also on entry blockage. Researchers have often failed to distinguish these two effects which, when combined, result in high variability. In a study of 94 North Carolina intersections, Lee et al. ( 32 ) found that lane utilization models for roadways that flared at intersections gave a poor fit. Ring and Sadek ( 33 ) adjusted Lee’s model for auxiliary lanes in Buffalo and concluded that site-specific studies would be needed. Bugg et al. ( 34 ) analyzed 22 U.S. sites, but their model explained only 78% of the variance, and the authors emphasized the need for localized calibration. Bugg et al. ( 35 ) estimated logit models for lane choice based on arrival phase and queue differences, but the predictions still underestimated utilization in validation samples.
Empirical studies have attempted to model the capacity contribution of short added auxiliary lanes using a lane utilization factor (LUF) ( 22 , 24 , 25 ), and to provide guidance on implementing site-specific LUF adjustments to HCM-based capacity analysis ( 34 ). However, the assumption of a LUF is continuous discharge flow at a reduced rate throughout the green, which is fundamentally different from the discharge process that happens with short added lanes in which a fixed number of vehicles per cycle discharge at the start of the phase. Granted, as long as cycle length and green time are fixed, the same capacity contribution can be achieved by a fixed number of vehicles per cycle or a (low) flow rate that applies during the full green interval; however, for signal timing, in which cycle length and green time are variables, a fixed number of vehicles per cycle is not equivalent to a fixed number of vehicles per second of green. Using a fixed bonus flow per cycle means that an added lane’s hourly capacity contribution does not increase with green time, while the LUF model predicts that capacity contribution will increase with green time. Likewise, if a fixed number of vehicles per cycle use an added lane, increasing cycle length will actually decrease an added lane’s capacity contribution (because there will be fewer cycles per hour), a phenomenon that the LUF model does not capture.
A still more serious error with using a LUF is that, following HCM procedures, LUF is measured based on the number of vehicles that discharge from an added lane over the entire green interval, while bonus flow counts only those who were stacked in the added lane at the onset of green. In Figure 2, only vehicles 3 and 6 count toward bonus flow, while the HCM procedure for determining LUF will also count vehicles 9, 12, 15, and 18, resulting in a highly distorted.
Using Negative Lost Time to Determine the Capacity of a Movement Group with Short Added Lanes
With Entry Blockage Only
In the situation illustrated in Figure 1, in which the fraction of vehicles aiming for the added lanes is small enough that the queue in the continuous lane will (virtually) always grow to block the entry before the queue in an added lane can spill back to block the continuous lane, the additional capacity provided by a short added lane is, as derived previously, a bonus flow of

Bonus flow can be modeled as a “head start” given to the continuous lane, as though its flow started just early enough to discharge

where

With that substitution, lane group capacity can be written in the familiar form of saturation flow rate multiplied by an effective green ratio as in Equation 5

where
Accounting for Entry Blockage as Well as Turn Lane Spillback
If the added lane is a sufficiently popular right-turn lane, it may be that before the continuous lane queue grows large enough to block entry to the turn lane, the turn lane queue will grow large enough to spill back into the continuous lane and block it. The type of blockage that prevails can vary from cycle to cycle: entry blockage in some cycles, and turn lane spillback in others. In either case, if arrival volume is high and the added lane is short, one lane will be full and the other will be only partly full. The one that’s full can be treated as the continuous lane, and the bonus flow comes from the lane that’s partly full.
Likewise, if the added lane is an auxiliary lane with a high proportion of drivers aiming for it, the expected bonus flow formula (Equation 1) is misleading, because one cannot presuppose which lane’s entry will be blocked. With a 50/50 split, that formula determines that the auxiliary lane will fill every cycle, which does not match reality; because lane preference varies from driver to driver, in any given cycle, one lane’s queue will reach the diverge point before the other’s, leaving the other lane blocked and only partly full. Again, the correct way to model capacity is to treat whichever lane is full as the continuous lane and take the bonus flow from the partly full lane. However, in this case the bonus flow is stochastic and cannot be determined by a simple formula.
Tian and Wu ( 14 ) modeled this kind of stochasticity by first determining expected throughput per cycle separately for two cases—when the added lane is blocked and when the continuous lane is blocked—and then combining the results using the probability of each case as weights. Following their approach, Equation 6 determines the expected bonus flow accounting for the possibility that either lane’s queue could block the other.
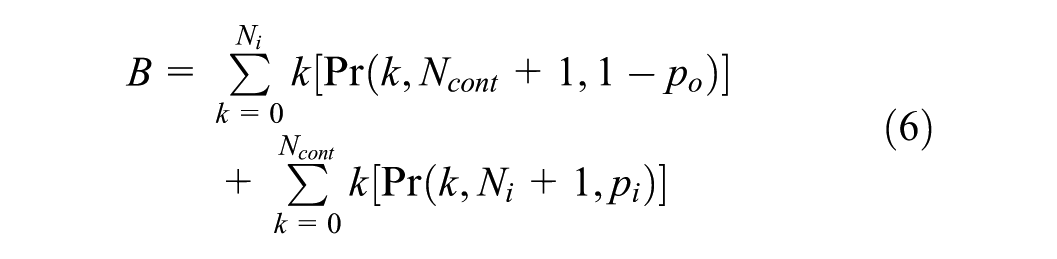
In Equation 6,
For a sufficiently small proportion of vehicles aiming for the added lanes
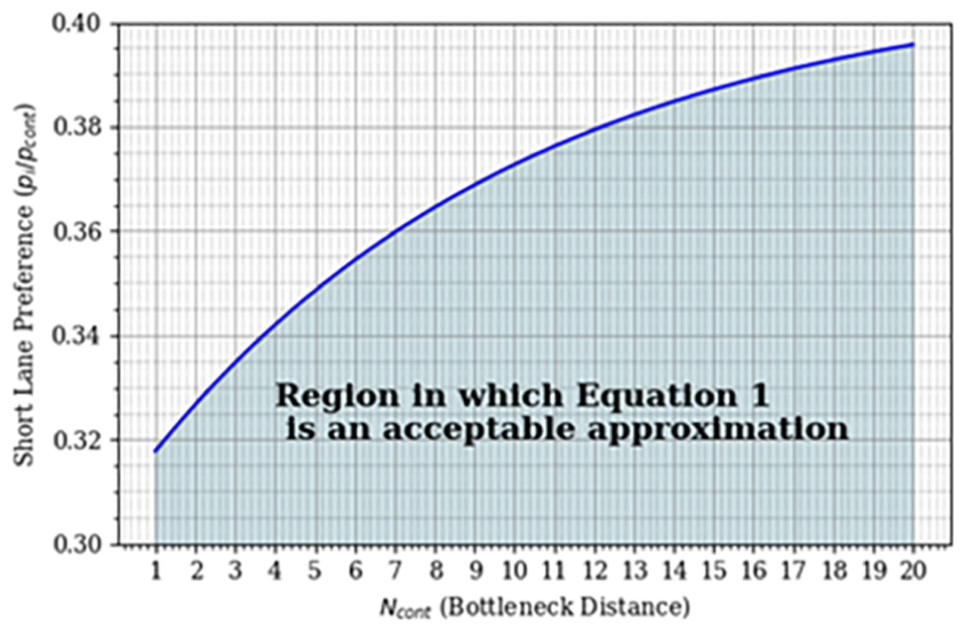
Limits for applicability of Equation 1, the entry-blockage-only formula.
Example: Southbound Approach from the BU Bridge
The Boston University (BU) Bridge has only one lane southbound, but until 2024, as it neared the intersection with Commonwealth Avenue, the southbound approach added a right-turn lane and an auxiliary through lane, as shown in Figure 4, which also shows p.m. peak vehicle volumes and lane shares. Relevant parameters in 2024 were
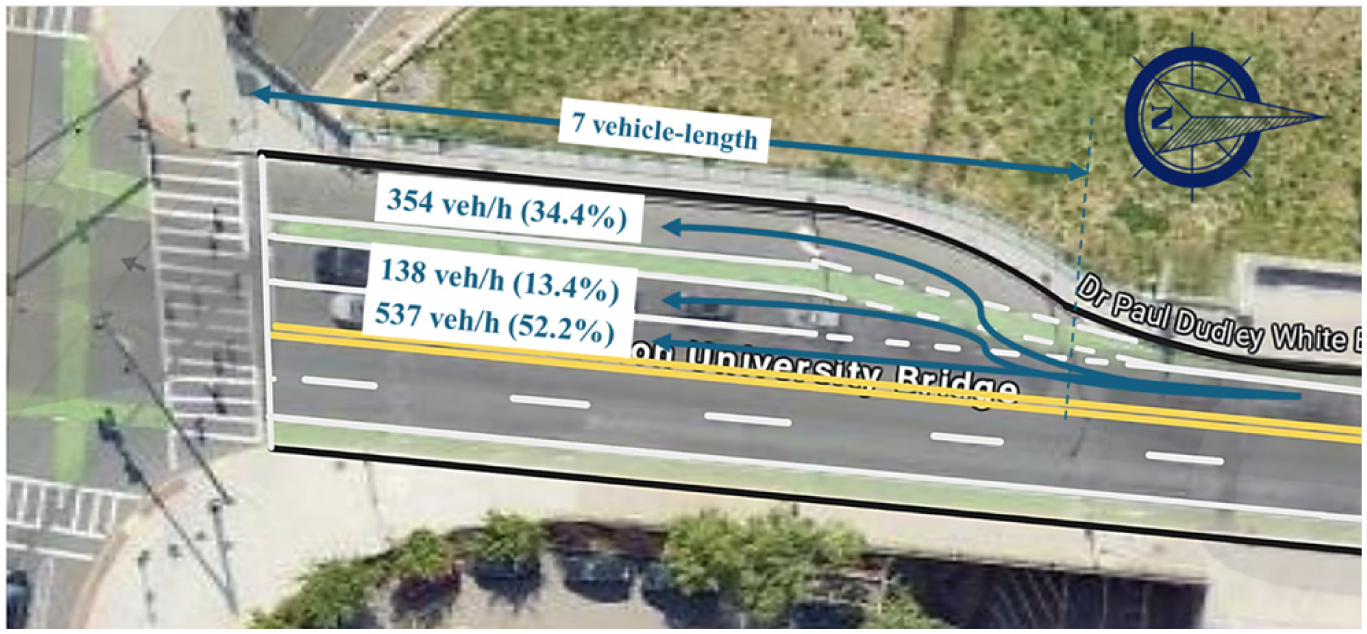
Boston University Bridge at Commonwealth Avenue.
Conventional intersection analysis would (a) treat the right-turn lane as a separate movement group, and (b) treat through movement group as having two lanes, albeit with an LUF (
Saturation flow rate, capacity, and volume-to-capacity (

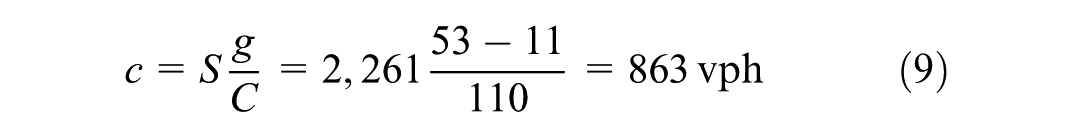

With a volume-to-capacity ratio this low, no congestion would normally be expected. At the same time, the right-turn movement, treated as its own movement group in the conventional approach, also has capacity far in excess of its volume. It’s easy to see why this intersection is puzzling to traffic signal engineers, because conventional analysis says it has plenty of excess capacity, yet that conclusion is plainly belied by massive daily congestion.
The conventional approach fails because the added lanes are short enough to be affected by entry blockage; as indicated in Figure 4, a queue of more than seven vehicles in the continuous lane will block entry to the added lanes. Therefore the right-turn movement and through movement should not be modeled as distinct movement groups, but as a single movement group, since their queues share a lane. Using Figure 3 we determine which formula to use to calculate the added lanes’ bonus flow; the result is Equation 1 for the auxiliary through lane because its relative preference (

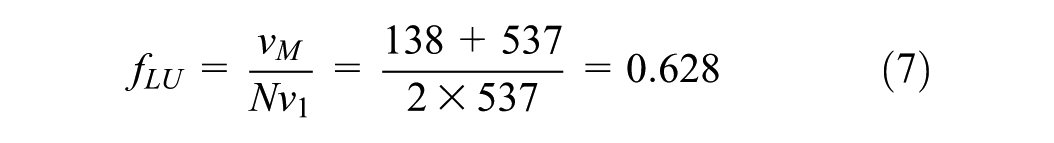
Because movement group volume is
Conventional analysis makes two significant errors. First, the right-turn lane should not be modeled as a separate lane group, because entry blockage forces right-turning vehicles to queue in the continuous lane. Second, the LUF calculated using the standard HCM formula grossly misrepresents the capacity contribution of the auxiliary through lane. While an observer would count 138 vph using that lane at the stopline, only those that stack up during the red period, amounting to 67 vph, use that lane productively; the remainder queue in the continuous lane behind the diverge point, and therefore do not contribute to capacity. Table 2 summarizes capacity analysis for this example using the conventional method versus our proposed method.
Conventional Highway Capacity Manual (HCM) Analysis versus Negative Lost Time Method for the Boston University (BU) Bridge Southbound Approach
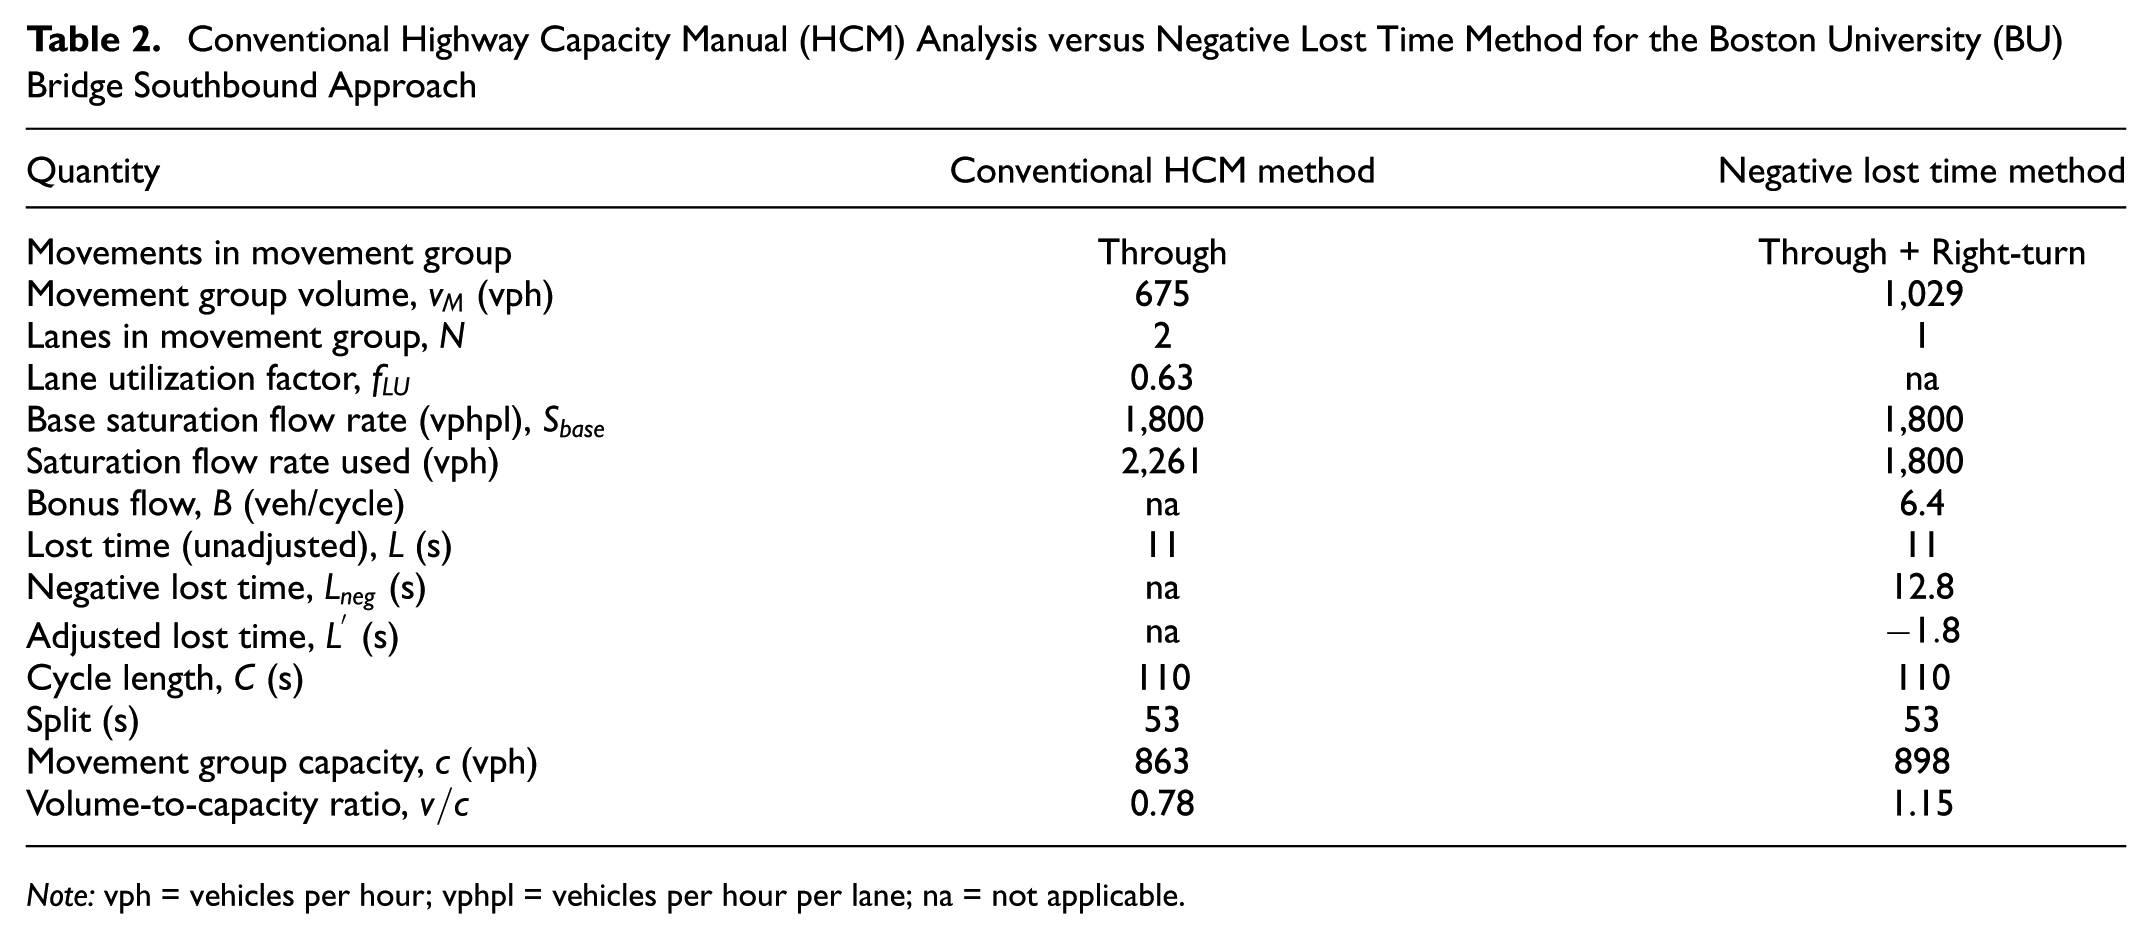
Note: vph = vehicles per hour; vphpl = vehicles per hour per lane; na = not applicable.
Signal Timing with Short Added Lanes
Short Lane Condition and Movement Groups
First, it will be useful to derive the condition under which an added lane is short enough that its entry is routinely blocked during the queuing process. With uniform arrivals, constant lane preferences, and with an added lane long enough to prevent spillback, the queue in the continuous lane will dissipate at a time

An added lane is “short” if the number of arrivals aiming for the continuous lane during

As Equation 13 shows, whether an added lane is “short” depends only partly on lane length and lane preference; it also depends on the length of the red interval, which in turn depends on the cycle length. For a given intersection approach, an added lane may qualify as “short” if the cycle is long, but not if the cycle is short.
Whether the short lane condition applies determines what movement groups should be used in signal timing and capacity analysis. An added right-turn lane should be treated as its own movement group unless it meets the short lane condition, in which case it belongs to the same movement group as the through movement. And when a short added lane is treated as part of the through movement group, it should not be counted as an additional lane; it contributes to movement group capacity not by increasing the number of lanes, but rather by providing negative lost time. For an auxiliary through lane, if the short lane condition doesn’t apply, it should be counted as an additional lane that adds to the movement’s saturation flow rate (perhaps with a LUF if there is a systemic aversion to using the auxiliary lane), while if the short lane condition applies, the added lane should not be counted as an additional lane, but only toward contributing negative lost time.
Needed Cycle Length—Upper Bound or Lower Bound?
In this section, we consider how short added lanes affect the minimum cycle length needed to achieve a target (i.e., maximum) volume-to-capacity ratio

Because critical movement groups are mutually conflicting and therefore may not overlap, the cycle length must be long enough to fit the splits of the critical movements in series, resulting in the inequality shown in Equation 15
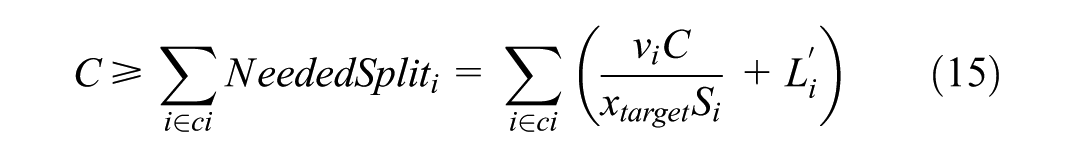
where the index

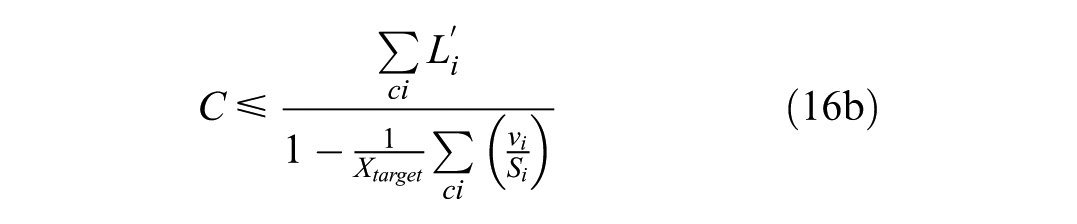
In conventional signal timing, only the lower bound (Equation 16a) is considered because the numerator—the sum of critical lost times—is always positive, and so a negative denominator always indicates infeasibility. However, when short added lanes are accounted for, the sum of critical lost times may be positive or negative. If positive, only the upper branch is relevant, as in conventional signal timing. However, if the sum of critical lost times is negative, there are two interesting possibilities:
If the sum of critical lost times is negative and the denominator is positive (Equation 16a applies), then any positive cycle length will offer sufficient capacity. Because the objective is to minimize cycle length, one might conclude that the cycle should then be as short as allowed by minimum split constraints; however, as the cycle length becomes short, added lanes may fail to meet the short lane condition, which can change the set of critical movements and possibly lead to a less extreme optimal cycle length.
If the sum of critical lost times is negative and the denominator is also negative (Equation 16b applies), their ratio, which will be a positive number, is a maximum cycle length, meaning any cycle length less than the right side of Equation 16bwill offer sufficient capacity. Again, cycle length cannot decrease without bound because a decreasing cycle can make an added lane fail to meet the short lane condition, changing the set of critical movement groups and with it the sum of critical lost times.
Except for the additional provisions needed when the sum of critical lost times is negative, signal timing with short added lanes can therefore use standard formulas for cycle length (Equation 16a) and splits (Equation 14).
Capacity versus Cycle Length
Typically, increasing the cycle length increases intersection capacity because with fewer switches per hour, there is less lost time per hour. However, where one or more critical movements have a short added lane, the added lane makes a contribution to capacity that increases when the cycle is shorter, because a shorter cycle means more green starts and therefore more bonus flow per hour. As a result, short added lanes make capacity less sensitive to cycle length and tend to favor shorter cycles.
Intersection-Level Metrics for Capacity and Saturation Flow Rate
Capacity sensitivity to cycle length must be measured at the intersection level, because with a change in cycle length, splits are bound to change for all movements. We define intersection-level capacity, represented as

This ratio can be interpreted as [effective green time needed by the critical movement groups per cycle] divided by [effective green they get per cycle]. We can also write

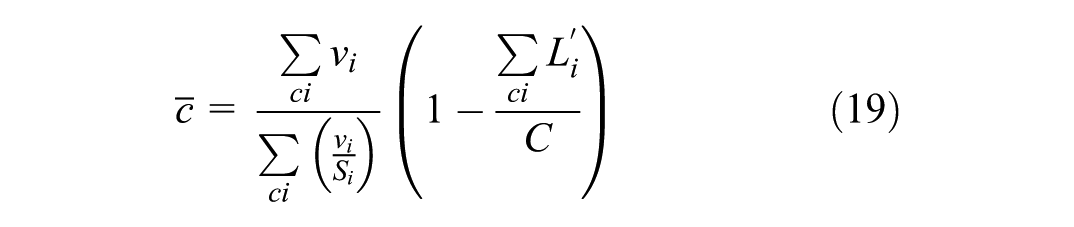
To make the capacity formula more concise, it is helpful for define the intersection-level saturation flow rate,

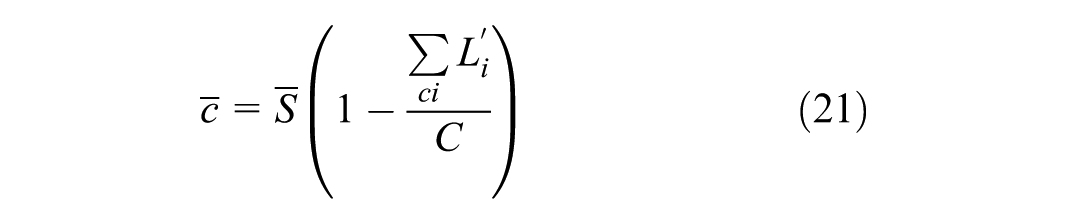
From Equation 21, one can see that if the sum of critical adjusted lost times is positive, intersection-level capacity will still grow with cycle length; however, because short added lanes lower effective lost time, the growth in capacity with cycle length will have a lower rate than it would if there were no negative lost time adjustments. And if the sum of critical adjusted lost times is negative, intersection-level capacity will not grow with cycle length; rather, it will grow as cycle length declines.
To quantify this effect, two example cases for positive (Case A) and negative (Case B) total adjusted lost time with parameters given in Table 3 are demonstrated. Figure 5 shows how intersection-level capacity varies with cycle length for each case. Both cases involve short added lanes for one of the critical movements, modeled after the BU Bridge approach described earlier. The two cases are constructed to isolate different operational effects of short added lanes with positive and negative adjusted lost times. In other words, the two cases depict the trade-off between lost time owing to phase switching and bonus flow.
Variables Used for Capacity versus Cycle Length Graphs
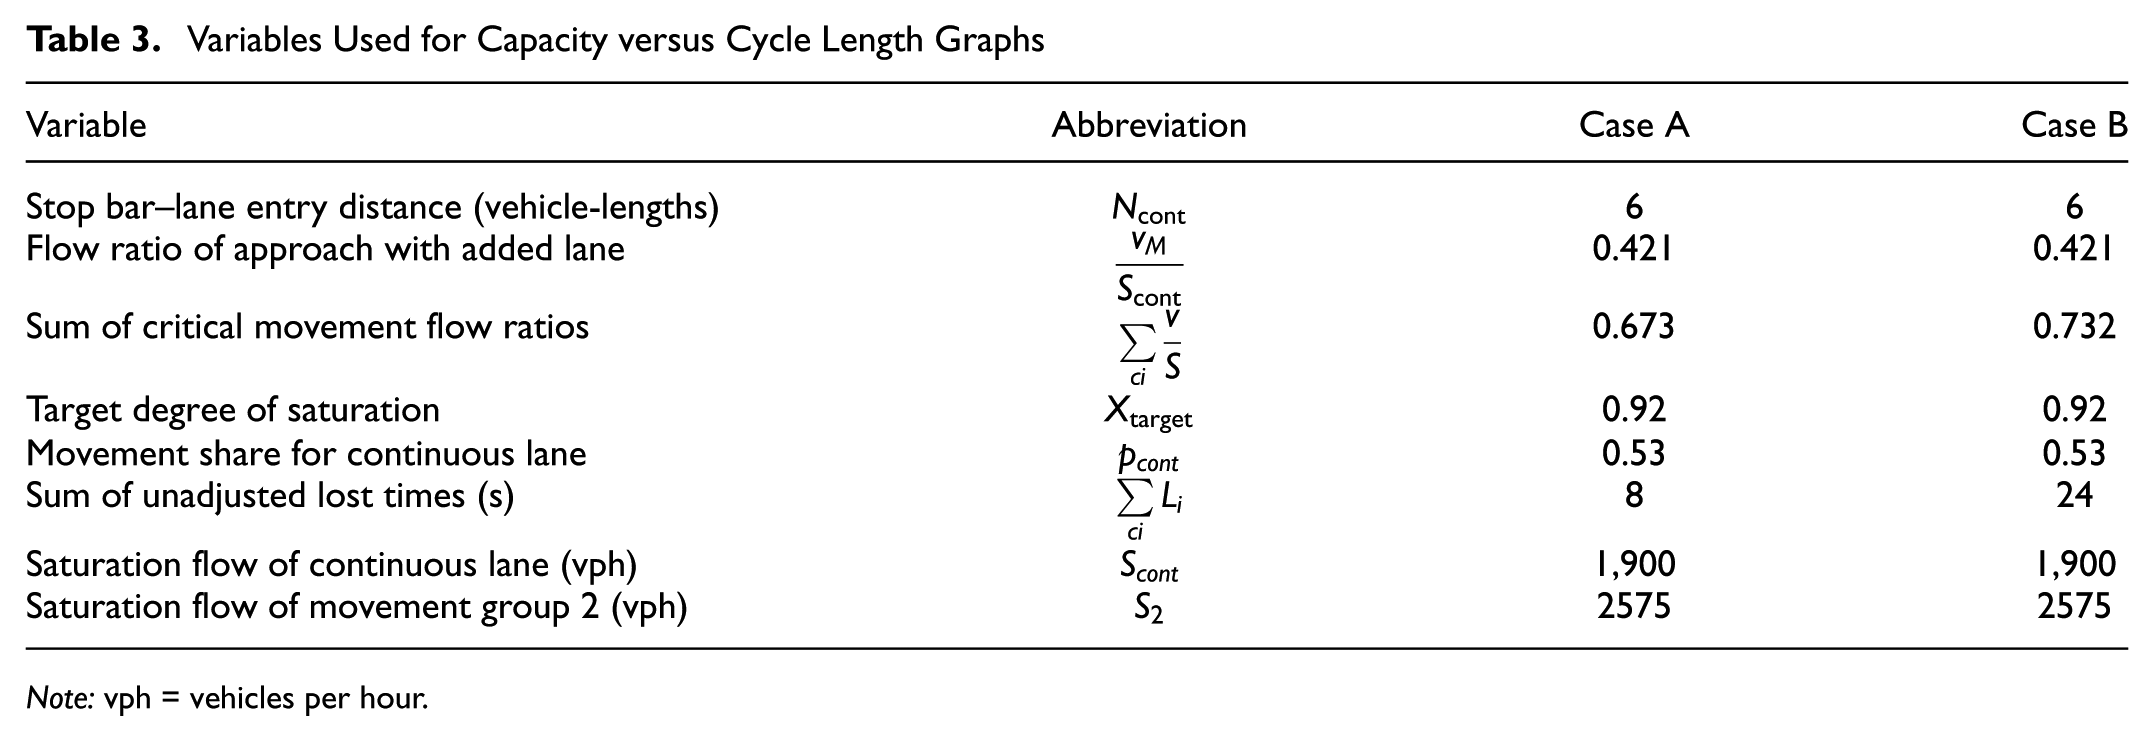
Note: vph = vehicles per hour.
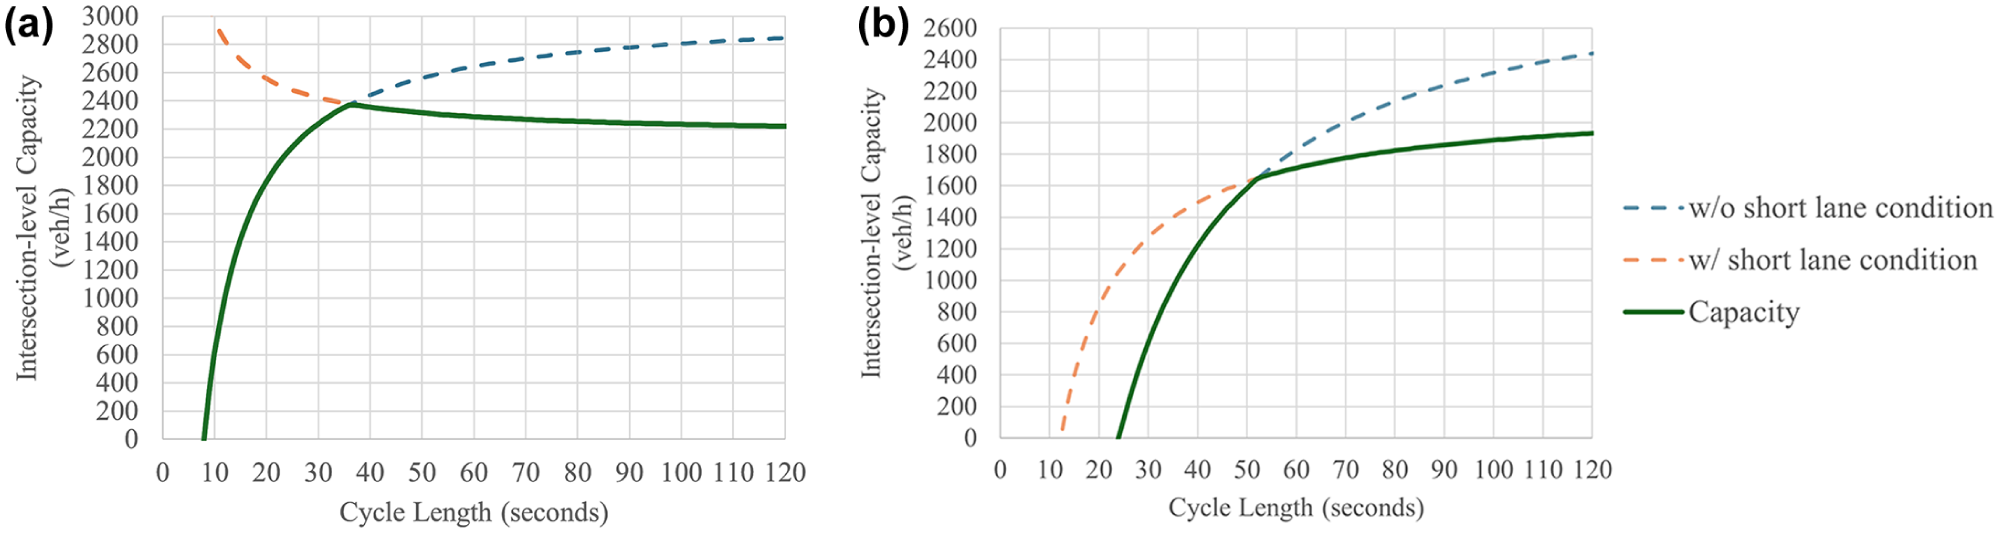
Intersection-level capacity versus cycle length: (a) Case A, (b) Case B.
In Case A, there is only one other critical movement, a vehicular movement group without short lanes, which leads to total adjusted lost time being negative. As shown in Figure 5a, the short lane condition does not apply for
Case B adds a third critical movement, a pedestrian crossing with a fixed phase length requirement of 16 s, which can be modeled as a lost time of 16 s, making the total adjusted lost time positive. As shown in Figure 5b, the short lane condition begins to apply at
Tian and Wu ( 14 ) also found that short added lanes resulted in capacity growing slower with cycle length than usual. However, we find that the decline in capacity enhancement with increasing cycle length is even greater than what they found because they used a method of allocating splits that fails to ensure that all critical movements’ volume-to-capacity ratios remain equal. A study by Emtenan and Day ( 18 ) also confirms our finding that with short added lanes, there can be a maximum intersection-level throughput at a unique optimal cycle length. However, their formulation needs simulation calibration, which makes it challenging to use their method to find the optimal cycle length.
Numerical Validation
To validate the theoretical model presented for capacity using negative lost time, a series of simulations were conducted for the Case A scenario described earlier. For cycle lengths ranging from 25 to 120 s in 5-s increments, equal volume-to-capacity splits were determined for the two critical movement groups using Equation 14 along with checks to see whether the short lane condition applies, adjusting saturation flow rate and negative lost time accordingly. The resulting timing plan for each cycle length was then tested using VISSIM, with 20 replications of one-hour simulations for each cycle, plus 15-min warm-up and cool-down periods. Saturation flow rates for both theory and simulation were carefully calibrated to reflect observed discharge behavior at the BU Bridge intersection, with additional calibration made to ensure consistency between the two approaches. Figure 6a shows how the movement group’s capacity changes with cycle length, while Figure 6b shows how intersection-level capacity changes with cycle length; in both figures, both formula-based and simulation-based results are shown. The box-and-whiskers format shows, for each cycle length, the median, the 25th and 75th percentile values, and the maximum and minimum value observed over the 20 replications.
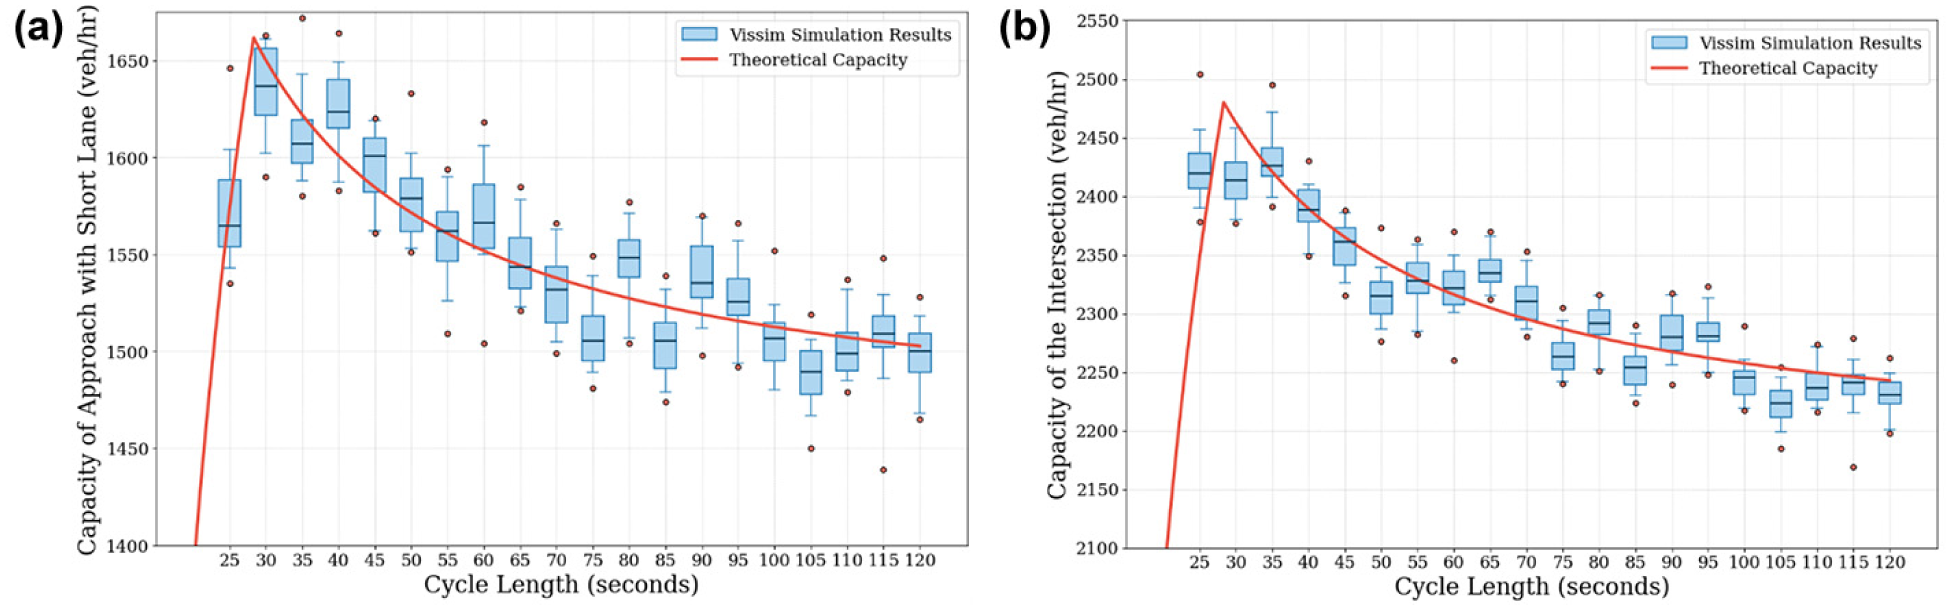
Capacity measured using VISSIM simulation, compared with the deterministic model for Case A: (a) approach capacity, and (b) intersection-level capacity.
At both approach level and intersection level, the analytical model closely follows the simulation results. Table 4 quantifies the agreement between theory and simulation. Bias is very small. Random errors were analyzed considering all simulation datapoints (20 one-hour replications × 20 cycle lengths) as well as considering mean capacity for the 20 cycle lengths. The performance measure used is relative root mean square error (rRMSE), which is RMSE divided by the mean. As the table indicates, typical errors tend to be less than 2% of capacity.
Relative Error Metrics for Capacity Estimation
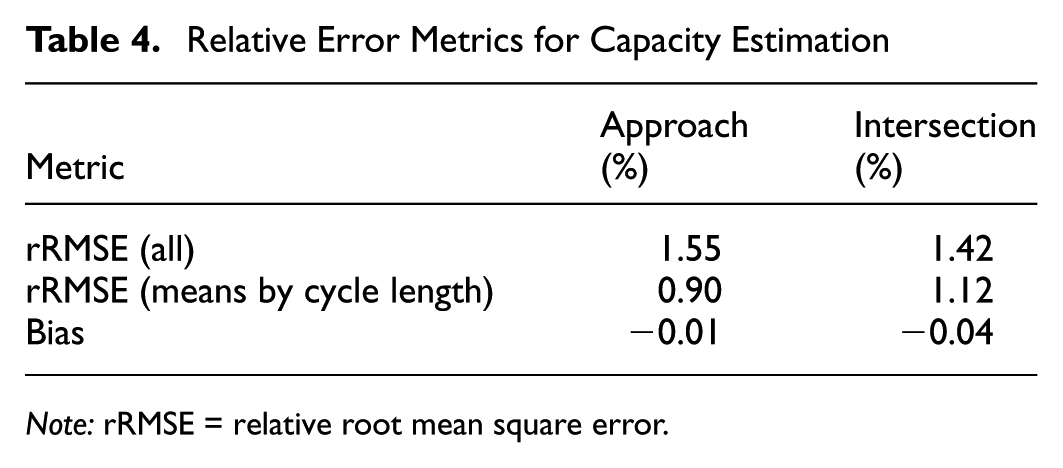
Note: rRMSE = relative root mean square error.
Figure 6 shows some smoothing of the peak compared with the theoretical model. This arises because the formulas are based on a deterministic model in which, at the critical cycle length, entry to the added lane is not quite blocked in everycycle while in the simulation (as in reality), entry is blocked in some cycles, resulting in less throughput than predicted by the deterministic model.
Short Added Lanes and Vehicle Delay
Because capacity analysis is the basis for determining delay, it is interesting to consider how short added lanes affect average delay. Following the HCM framework, intersection delay has three components,
Component
The queue evolution for a movement group with a short added lane is shown in Figure 7 with cumulative arrivals and departures curves. The origin is the onset of red with an empty queue. Departures begin at
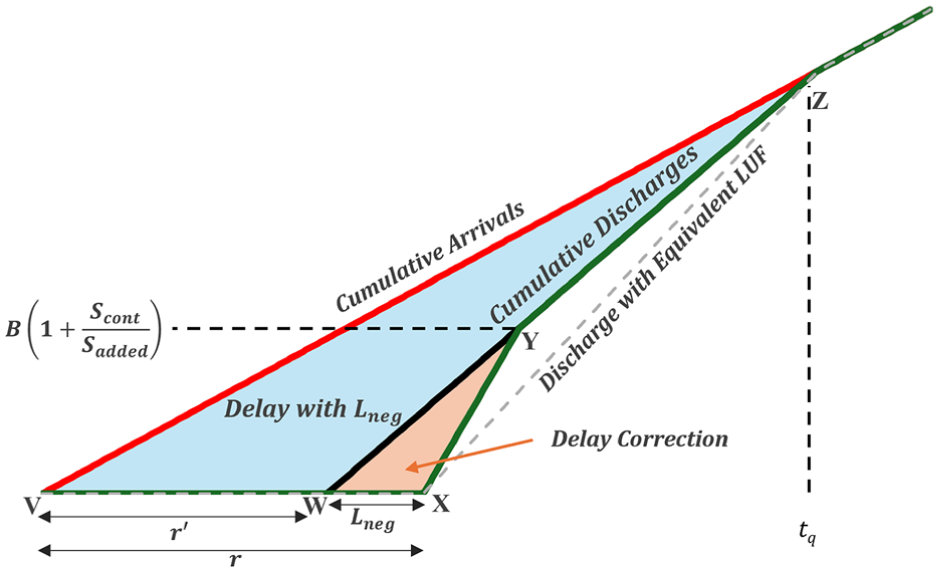
Cumulative arrivals–departure diagram for a movement group with a short added lane.
Modeling the short added lane as negative lost time, as proposed for capacity analysis, implies that departures begin not at
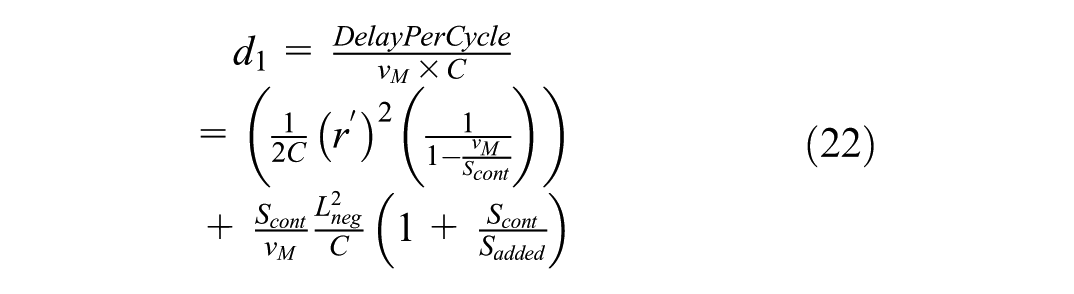
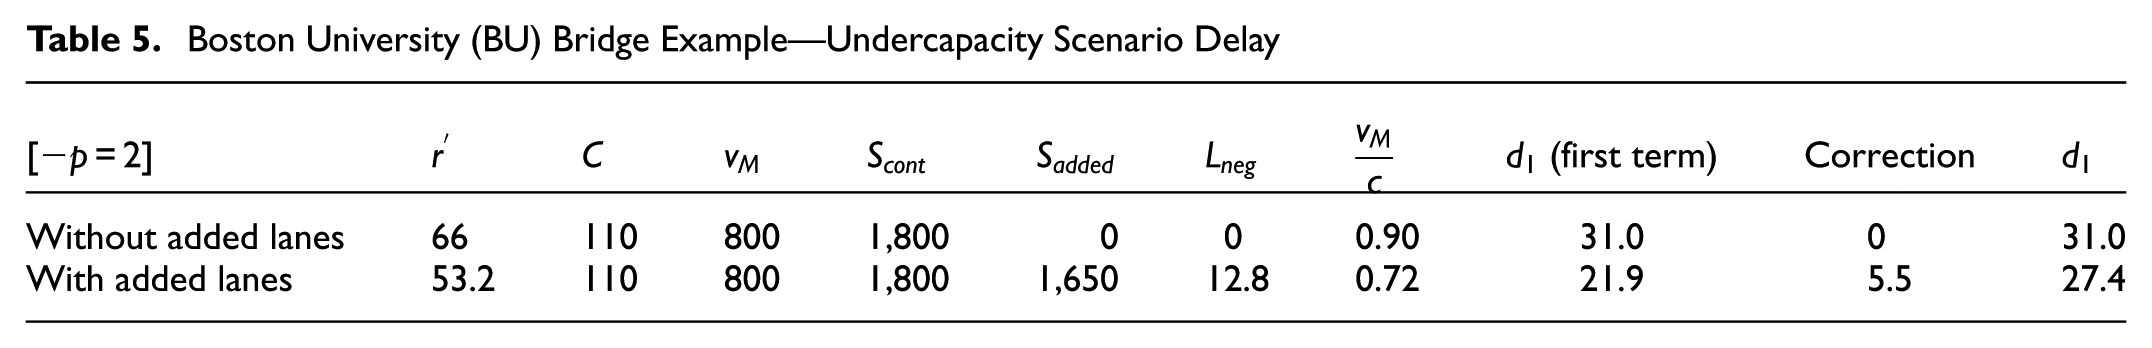
Example
Table 5 offers a numerical example of applying the proposed uniform delay formula. The site is the familiar BU Bridge southbound approach during an uncongested period, comparing uniform delay with and without short added lanes. Without any added lanes, effective red is 66 s, resulting in a volume-to-capacity ratio of 0.90 and
Boston University (BU) Bridge Example—Undercapacity Scenario Delay
Reservice as a Signal Timing Strategy to Take Advantage of Short Added Lanes
Reservice, meaning serving a movement group in two distinct phases within the cycle, is a well-known strategy for increasing capacity on approaches with short left-turn lanes ( 36 , 37 ). Reservice can similarly be effective for approaches with short added right-turn and auxiliary through lanes by providing twice as many green starts per hour and thus doubling the bonus flow, provided the intervening red intervals are long enough to fill the added lanes to their functional storage capacity. Reservice will be effective if the lost time added owing to additional phase switches is offset by having an additional round of bonus flow per cycle.
North Washington Street at Chelsea Street, at the northern end of the Charlestown Bridge, is an example of where reservice could have increased capacity during a three-year construction period in which northbound traffic backed up over the bridge and spilled back into upstream intersections every afternoon. Northbound on the bridge, North Washington Street had a single lane, and then flared as it approached Chelsea Street, adding three short lanes. One could observe that the added lanes together had a functional storage capacity of 9.5 vehicles. With a saturation headway of 2.0 s in the continuous lane, that implies 19 s of negative lost time. During North Washington Street’s green period, one could observe strong flow for the first several seconds as the bonus flow discharged from multiple lanes, but once the bonus flow had discharged, the rest of the green interval had weak, single-lane flow. Replacing its 50 s phase with a pair of 25 s phases, separated so that during the intervening red periods the short lanes could be refilled, would have doubled the bonus flow per cycle. Granted, reservice would have added 6 s of lost time owing to the additional phase switch; but by adding 19 s of negative lost time, there would be a net lost time reduction of 13 s, enough for 6 or 7 more vehicles to pass through per cycle, increasing capacity by 21%.
A second example illustrating the potential of reservice for short right-turn lanes is a new (in 2025) configuration of the BU Bridge southbound approach to Commonwealth Avenue, in which both added lanes are now right-turn lanes. To give pedestrians and cyclists a protected crossing, the right-turn green starts 46 s later than the through movement (whose split has been increased to 71 s, along with an increase in cycle length from 110 to 120 s). During the first 46 s of the through phase green, the right-turn queue in the short added lanes continues to grow, and sometimes spills back to block the through lane. Simulation showed that by providing two short right-turn intervals per cycle, one at the start and one at the end of the southbound through phase, southbound capacity would increase by 22% by virtually eliminating spillback risk, with no change to other movements.
The examples are presented to demonstrate the extent of capacity improvement achievable through reservice under an optimized signal timing plan. The analysis does not address considerations such as parallel and conflicting signal timing requirements or specific field implementation issues. Practical application of reservice at a given intersection would require evaluation of local conditions and the development of a site-specific signal timing plan.
Discussion and Conclusion
Short added lanes that run concurrently with a through movement—including both short right-turn lanes and short auxiliary through lanes—are and will continue to be a feature of many intersections because they add capacity in constrained environments. Yet standard intersection capacity analysis lacks a method that accounts for how their limited length can lead to entry blockage and thereby limit capacity. As a result, conventional methods can grossly overestimate capacity and lead to ineffective signal timing plans. This study addressed this gap by introducing a simple analytical framework that is compatible with conventional capacity models.
This paper shows that short added lanes do not increase the saturation flow rate, nor do they increase capacity in proportion to the green ratio. Instead, short lanes contribute to capacity by discharging, during the early part of green, a fixed bonus flow consisting of vehicles that stacked up in the short lane during the red interval. This effect can be modeled by expressing the bonus flow in terms of negative lost time, which is equivalent to a head start given to the continuous lane. Accordingly, short added lanes should not be counted as additional lanes when determining a movement group’s saturation flow rate, because their contribution to throughput is a fixed number of vehicles per green start rather than an increased discharge rate that applies during the entire effective green interval. This interpretation is fundamentally different from LUF-based analysis which assumes a constant discharge rate through the entire green interval, and from the simulation-calibrated adjustments to conventional methods which are difficult to implement into signal timing design.
The shortcomings of conventional methods are presented in one example where conventional analysis predicted a volume-to-capacity ratio of only 0.78, whereas the actual ratio was 1.15, with long queues persisting for hours each day. In another case involving a severely overcapacity intersection, designers were unaware that a phasing strategy contrary to conventional wisdom—serving a through movement in two short phases rather than one long phase—could increase capacity by approximately 20%. In that case, the additional lost time incurred by an extra phase switch was more than offset by enabling an additional bonus flow each cycle. These examples illustrate that in presence of short added lanes, signal timing using conventional methods may not find the best solution.
Standard intersection capacity and signal timing methods can be applied to movement groups with short added lanes if effective green is replaced with adjusted effective green, defined as effective green minusnegative lost time, and if short added lanes are not counted when determiningsaturation flow rate. Before implementing these adjustments, it is necessary to determine whether an added lane qualifies as “short,” based on a formula derived in this study. From a practical perspective, this method provides framework that can be applied in HCM capacity and signal timing analysis to account for short added right turn and auxiliary through lanes.
Another important contribution of this research is demonstrating that the bonus flow, or functional storage capacity, of a short added lane can be substantially smaller than its physical storage capacity. This study presents a simple formula based on a deterministic model for estimating functional storage capacity when the proportion of arriving vehicles that prefer the added lane is small. When this assumption does not hold, a more complex but still tractable formulation based on a stochastic model can be used. A graphical guideline is provided to identify the parameter ranges under which the simpler formula yields results with minimal error.
Although short added lanes do increase capacity, their contribution is smaller than that of lanes long enough to prevent entry blockage. When a critical movement includes short added lanes, increasing phase length cycle length yields a smaller capacity increase than would otherwise be expected. Reservice, in which a long phase is divided into two shorter phases separated by an intervening red interval that allows short lanes to refill, can improve capacity if the negative lost time associated with short lanes exceeds the additional lost time owing to switching. Of course, practical implementation of reservice requires site-specific evaluation to account for potential impacts of coordination with adjacent intersections, driver behavior, pedestrian and bicycle timing constraints, and any other safety consideration associated with a change in signal timing plan.
At intersections with short added lanes, increasing the cycle length becomes a less effective means of increasing capacity than under conventional assumptions. While longer cycles reduce the number of phase switches per hour, they also reduce bonus flow per hour. If the intersection-level sum of adjusted lost times is negative, capacity can be increased by shortening the cycle until the short-lane condition no longer applies. This leads to a unique capacity-maximizing cycle length—one that is just long enough to replenish the added lanes during their red interval so that a full bonus flow is discharged during green. This outcome contrasts with conventional guidance, which generally favors longer cycles to maximize capacity.
To analyze the cycle length–capacity tradeoff, this study introduces a measure termed intersection-level capacity, defined as the sum of critical movement capacities when all critical movements operate at the same volume-to-capacity ratio. Although this measure can be derived from the intersection-level degree of saturation used in the HCM ( 7 ), it does not appear to have been explicitly expressed in prior literature. This measure provides a practical basis for evaluating how added lanes affect intersection performance under different signal timing strategies. This study also introduces a measure of intersection-level saturation flow rate.
The analytical framework presented is deterministic and based on expected values of the underlying queuing process. Microsimulation results show close agreement in mean capacity, but also exhibit smoothing near the capacity-maximizing cycle length. This occurs because, in stochastic traffic streams, entry blockage does not occur identically in every cycle. Consequently, realized throughput near the theoretical optimum may be slightly lower than predicted, suggesting that a modest robustness margin may be appropriate in design.
The proposed method modifies standard delay estimation while preserving its overall structure. For movement groups with short added lanes, uniform delay (
The main limitation of this work is that it does not directly apply to short left-turn lanes, which experience similar queue interaction issues but involve additional complexities because their effective green time typically differs from that of the through movement. This situation has been studied by Wu ( 2 ). While the present study allows the saturation flow rate of an added right-turn lane to differ from that of the continuous through lane, it assumes that pedestrian conflicts will not interfere with right-turn discharge to the point that they cause right-turn queues to spill back and block through traffic during green.
Footnotes
Acknowledgements
Thanks to Evan Wotton for developing the BU Bridge case study.
Author Contributions
The authors confirm contribution to the paper as follows: study conception and design: Peter Furth and Fatemeh Tabatabaei; data collection: Fatemeh Tabatabaei; analysis and interpretation of results: Fatemeh Tabatabaei, Peter Furth; draft manuscript preparation: Peter Furth, Fatemeh Tabatabaei. All authors reviewed the results and approved the final version of the manuscript.
Declaration of Conflicting Interests
The authors declared no potential conflicts of interest with respect to the research, authorship, and/or publication of this article.
Funding
The authors received no financial support for the research, authorship, and/or publication of this article.