
Abstract
In order to enhance the efficiency of centrifugal pump, the structure of a centrifugal pump with vaned diffuser, whose specific speed is 190, was numerically improved by trimming back-blades of impeller and smoothing sharp corner in annular chamber. The energy performance, the internal flow field, the axial force, the radial force, and the pressure pulsation of the pump were analyzed. Results show that efficiency of the improving scheme 1 under the design flow rate is 77.47%, which can balance 69.82% of the axial force, while efficiency of the improving scheme 2 under the design flow rate is the maximum, which could still balance 62.74% of the axial force. The pressure pulsations of the improving scheme 2 at the typical monitoring points are less than that of the improving scheme 1 and the original scheme. The difference of the radial force peak between the improving scheme 1 and the improving scheme 2 is very small. The vector distributions of the radial force of the improving scheme 1 and the improving scheme 2 are more uniform than that of the original scheme. Considering the efficiency, pressure pulsation, and axial force, experiment measurements on the improving scheme 2 were carried out to verify the effectiveness of the improvement result. Results of energy performance experiment show that efficiency of the improving scheme 2 under the design flow rate is 76.48%, which is 5.26 percentage points higher than that of the original scheme.
Keywords
Introduction
Centrifugal pump is a kind of hydraulic machinery widely used in agriculture, industry, nuclear power, and other fields. It is of great practical significance to improve the efficiency and optimize the performance of the centrifugal pump.1–5 Derakhshan et al. 6 redesigned the blade shape of a centrifugal pump to improve its hydraulic efficiency by using a gradient-based optimization algorithm coupled with a three-dimensional (3D) Navier–Stokes flow solver. Yang 7 improved the hydraulic efficiency by optimizing the impeller of high-specific-speed centrifugal pump. Cao et al. 8 studied the effect of axial clearance on the efficiency of a shrouded centrifugal pump with model tests and numerical simulation. They found that the volumetric efficiency is the key factor why the gross efficiency changes with axial clearance. Lipej et al. 9 studied the effect of wall roughness on the efficiency of centrifugal pump. Li et al. 10 investigated the effect of the blade-loading distribution on head, radial force, and pressure pulsation of a low-specific-speed centrifugal pump with cylindrical impeller blades and analyzed the effect of the variation of the aft-loading point on hydrodynamic performance of the pump. Wang et al. 11 proposed a method to optimize the design of a typical multistage centrifugal pump based on energy-loss model and computational fluid dynamics (CFD) and assessed interactive relationships among the different types of energy losses. Dong et al. 12 studied the performance characteristics of a super-low-specific-speed centrifugal pump with different front streamline sweep angles of the impeller blades and analyzed the effect of the blade design aspect on internal flow field, pressure pulsation, and interior and exterior acoustics of the pump. Wang et al. 13 analyzed the energy characteristics, pressure pulsation, vibration, and noise characteristic of a five-stage centrifugal pump under different flow rate.
Vaned diffuser is one of the most important flow-passage parts of the centrifugal pump, which has a direct effect on the performance of the pump. The back-blades of the impeller are radial blades on the back shroud of the centrifugal pump impeller, whose main role is to balance the axial force and axial seal. In recent years, some scholars have performed a lot of research on the vaned diffuser of the centrifugal pump by experiment and numerical simulation.14–18 Sun et al. 19 analyzed the pressure fluctuations in a pump turbine with different guide vane’s opening angle and found that pressure fluctuation under design-opening angle were much lower than those under off-design-opening angle. The main source of pressure fluctuation between runner and guide vanes is rotor/stator interaction. Li et al. 20 found that the change of the number and width of impeller back pump-out vanes in the screw centrifugal pump has great influence on the distribution of the pressure in seal chamber and volute casing. Huang and Liu 21 employed CFD method to indicate that the key cause of low-frequency pressure pulsation is the eddies generated due to streamline distortion. Based on the detached eddy simulation (DES) model, Zhou et al. 22 put forward the impeller design method to optimize the anti-missile blade, reduce the flow loss between the guide vanes, and improve the performance of a multistage centrifugal pump.
Because the back-blades and sharp corner in annular chamber directly affect the flow field of the pump, their cumulative effect on the pump performance was studied in this article. To improve the efficiency of a centrifugal pump with vaned diffuser, two improving schemes were proposed by trimming back-blades of impeller and smoothing sharp corner in annular chamber. The energy performance, the internal flow field, the axial force, the radial force, and pressure fluctuation of the pump were analyzed with numerical simulation method. Finally, the energy performance of the improving scheme 2 was experimentally validated.
Improving schemes
Centrifugal pump with vaned diffuser
Design parameters of a centrifugal pump with vaned diffuser are as follows. Design flow rate Qd is 270 m3/h, head of the pump H is 15 m, efficiency of the pump η is 75%, rotation speed n is 1450 r/min, and specific speed ns (
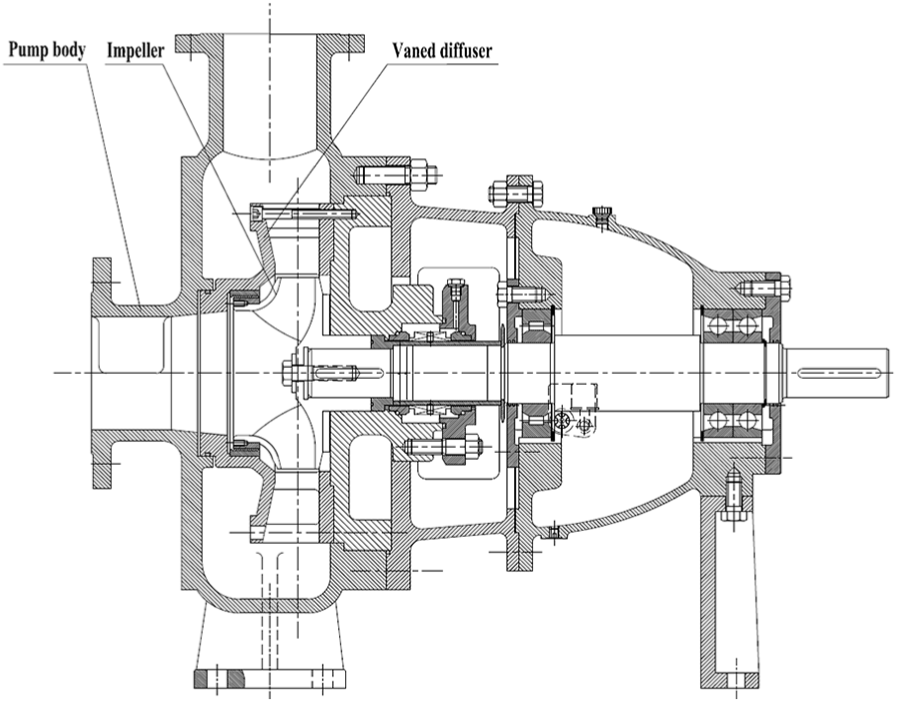
Structure of the centrifugal pump with vaned diffuser.
Main structure parameters of the pump.

Experiment of energy performance
Experiment bench of the centrifugal pump with vaned diffuser is shown in Figure 2. Experimental equipment on energy performance of the pump includes a motor, a flow meter, two pressure transmitters, a three-phase pulse width modulation (PWM) digital power meter, and so on. The flow rate, head, and power were measured several times by the flow meter, pressure transmitters, and digital power meter, respectively, in the experiment. All experimental data were managed and analyzed by a data acquisition instrument.

Experiment bench of the pump: (a) schematic diagram of the experiment bench and (b) experiment bench.
Figure 3 shows experimental results of energy performance of the pump. It can be observed from Figure 3 that under the design flow rate, head of the pump is 15.03 m and efficiency of the pump is only 71.47%. Therefore, it is necessary to improve its structure so that its efficiency can reach the design requirement.

Energy performance curve in the pump.
Improving schemes
In order to improve efficiency of the centrifugal pump with vaned diffuser, the back-blades of the impeller were trimmed to reduce the power consumption. Improving schemes are shown in Figure 4. Moreover, the chamfer of the annual chamber in the original scheme was made with sharp corner. In order to improve the internal flow field of the pump, sharp corner in annular chamber in the improving schemes was smoothed (shown in Figure 5), whose radius is 50 mm.

Trimming back-blades of impeller.
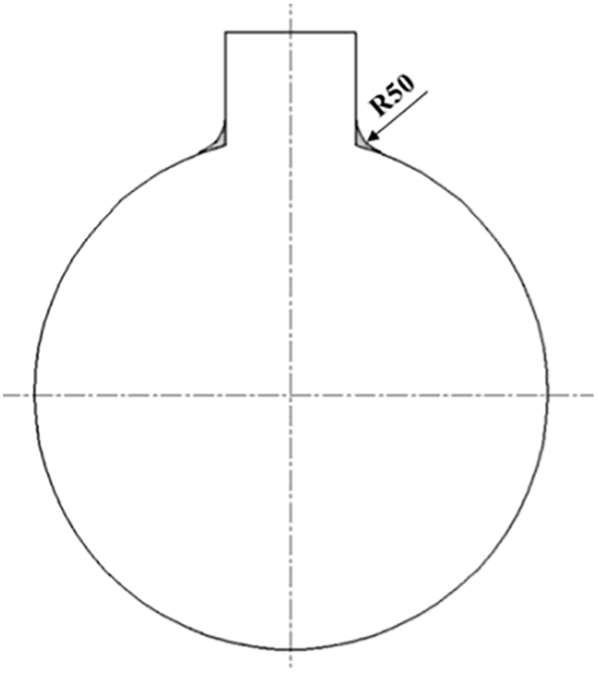
Smoothing sharp corner in annular chamber.
Therefore, according to the previous figures, three schemes were as follows:
Original scheme: the outlet diameter of the back-blades is 208 mm and the width is 8.4 mm.
Improving scheme 1: the outlet diameter of the back-blades is 179 mm, the width is 7.4 mm, and sharp corner in annular chamber is smoothed.
Improving scheme 2: the outlet diameter of the back-blades is 150 mm, the width is 6.4 mm, and sharp corner in annular chamber is smoothed.
Numerical simulation method
Grid independence analysis
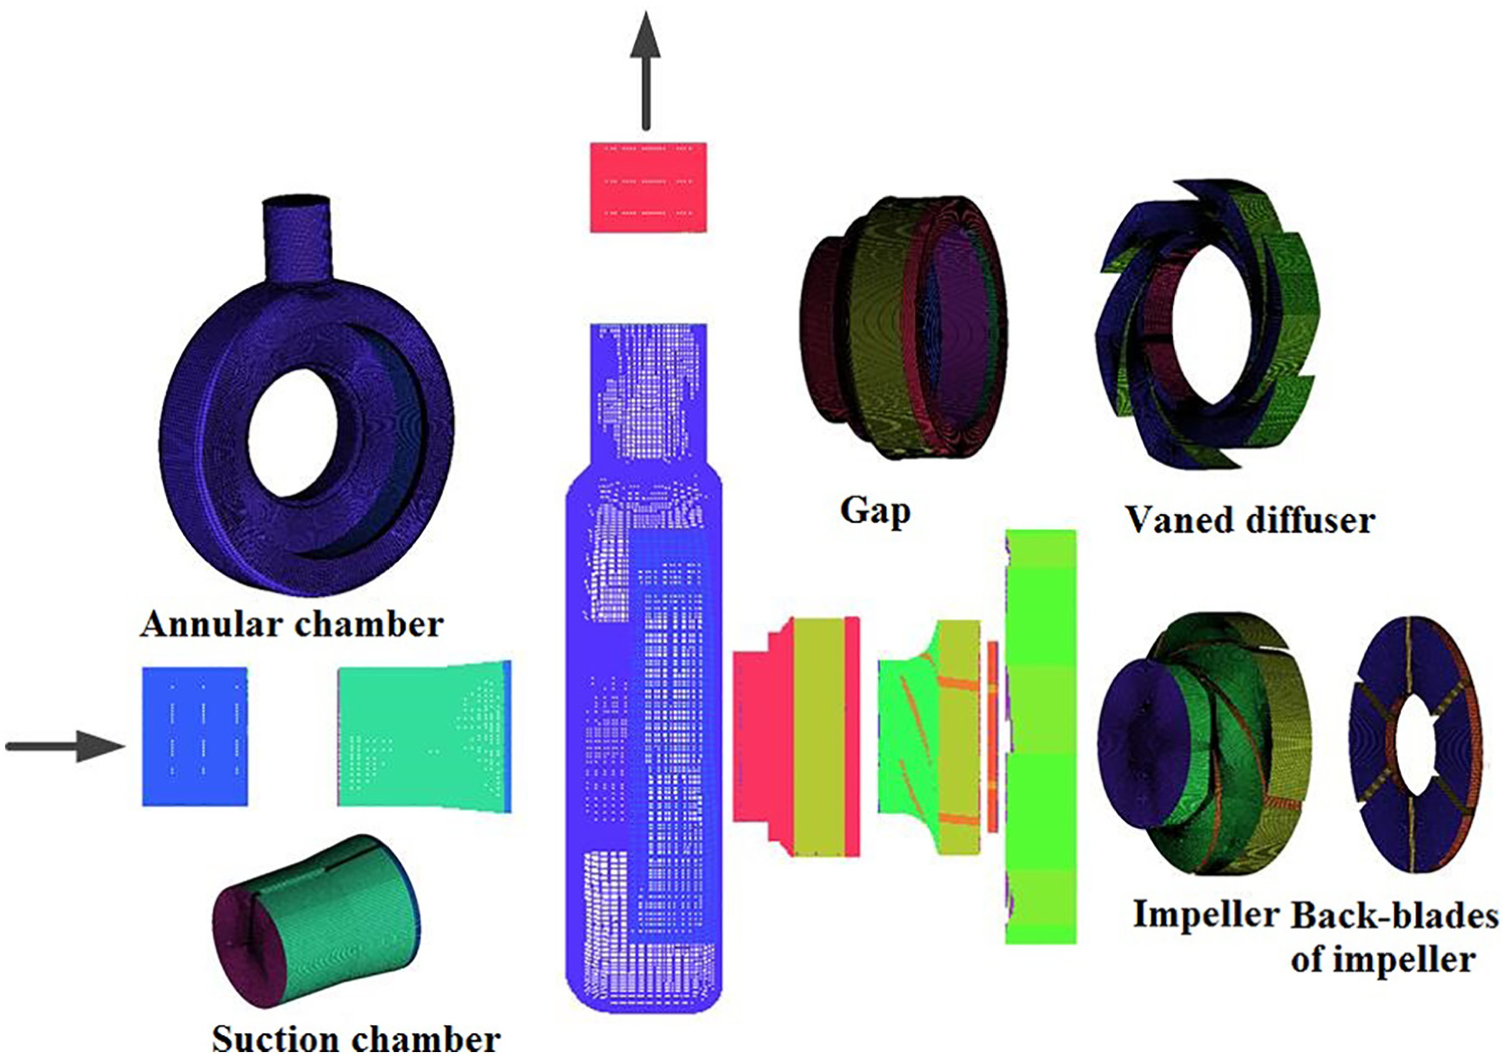
The 3D model and assembly of the pump were carried out by Pro/E software. ICEM software was chosen for hexahedral mesh generation, as shown in Figure 6. In order to select the appropriate grid number, mesh sensitivity analysis was carried out. Table 2 shows results of grid independence analysis. As can be seen from Table 1, with the increase of grids number, head and efficiency of the pump will be stable at a certain value and the change is very small. Therefore, considering the calculation time, scheme 4 was selected for the subsequent simulation.
Mesh generation.
Grid independence analysis.

Boundary conditions
The numerical simulation was carried out by ANSYS CFX software. The fluid medium chosen was water. The impeller and back-blades of impeller were arranged in a rotation domain with a rotational speed of 1450 r/min. Other domains were set to be static domains. There are three pairs of static and dynamic interfaces: impeller and gap, back-blades of impeller and gap, and impeller and suction chamber. Other interfaces were defined as static interfaces. The inlet pressure was set as the total pressure of 1 atm, and the outlet was set to be the calculated mass flow rate. The walls were set as no-slip condition, and the roughness was 0.025 mm.
Applicability of turbulence model
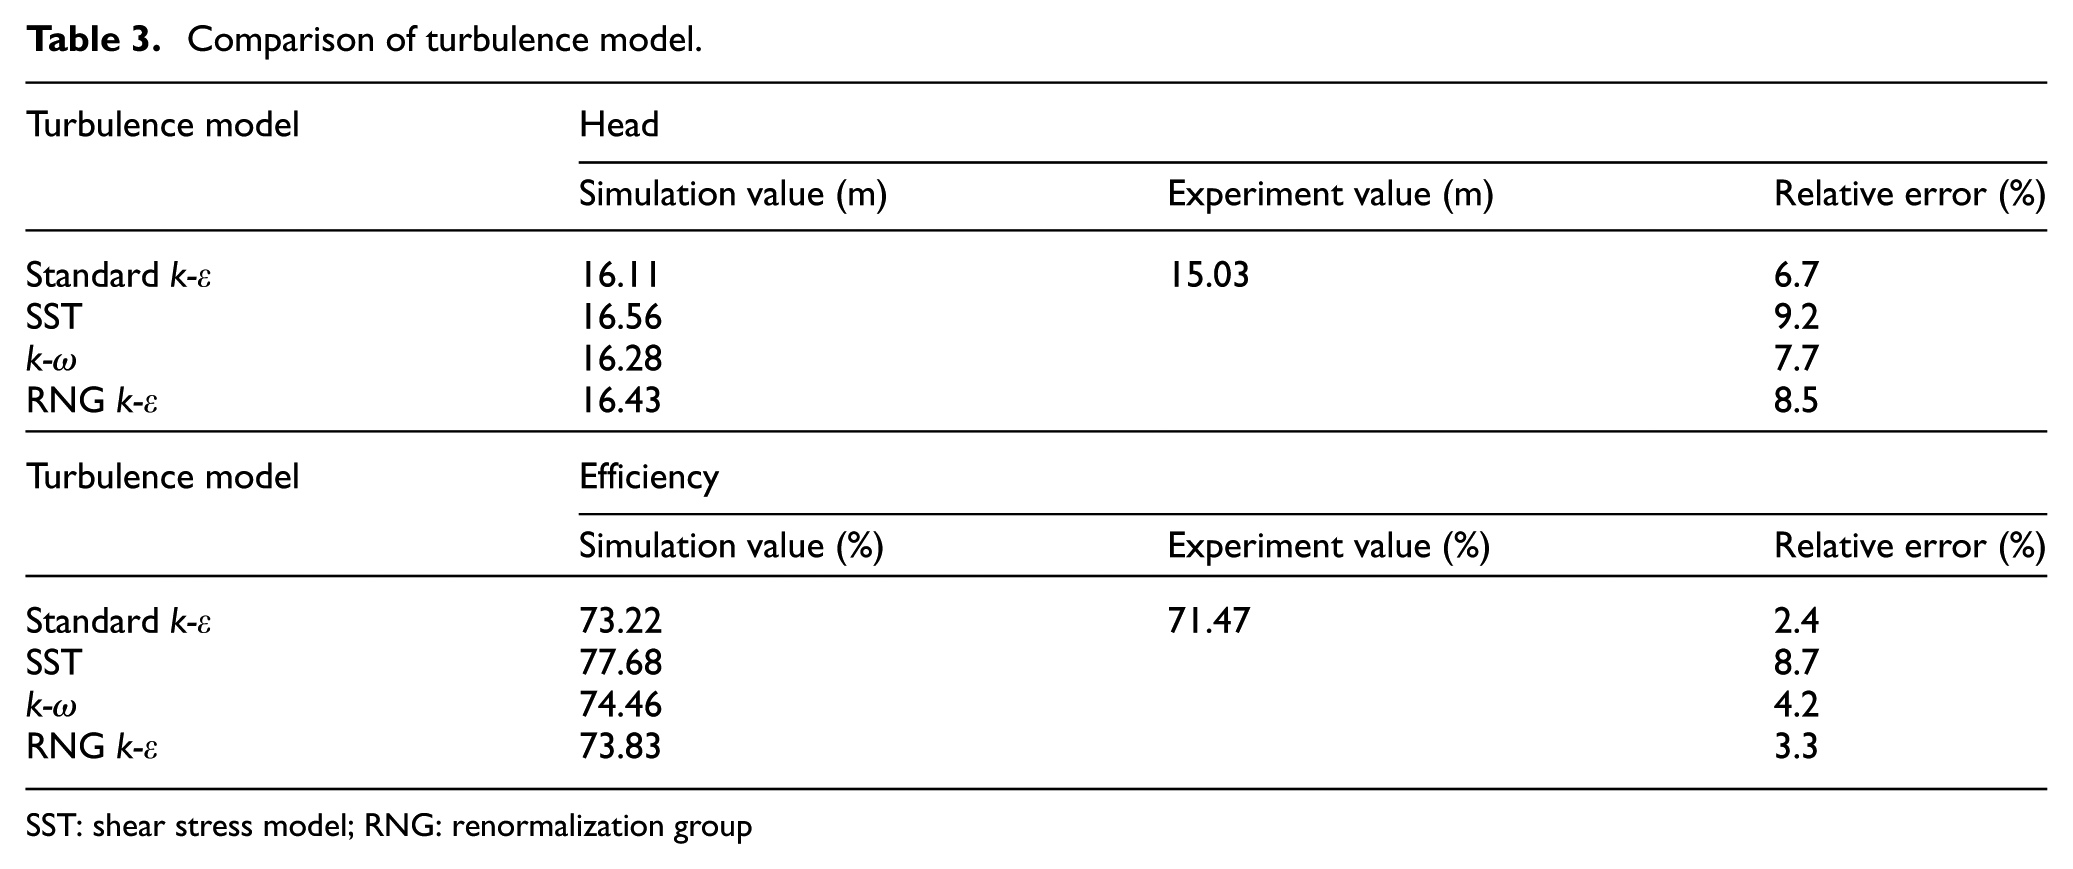
Standard k-ε model, shear stress transport (SST) model, k-ω model, and renormalization group (RNG) k-ε model were used to analyze the applicability of turbulence model. Except for the choice of turbulence model, other settings are the same in the numerical simulation setting. The simulated head and efficiency of the pump under the design flow rate are compared with the experimental results, as shown in Table 3.
Comparison of turbulence model.
SST: shear stress model; RNG: renormalization group
As can be seen from Table 3, the relative error of head and efficiency of the four turbulence models under the design flow rate are larger than experiment values. Compared with each turbulence model, the relative error of standard k-ε model is smaller. The relative error of head is 6.7%, and the relative error of efficiency is 2.4%. The relative error of SST model is the largest. The relative error of head is 9.2%, and the relative error of efficiency is 8.7%. Therefore, standard k-ε model was chosen for the subsequent simulation.
Arrangement of monitoring points of pressure pulsation
In order to analyze the pressure pulsation in the pump, the monitoring point P1 at outlet of the impeller, the monitoring point P2 at outlet of the vaned diffuser, the monitoring point P3 at the annular chamber near the chamfer, and the monitoring point P4 at the outlet were selected, which are shown in Figure 7.

Distribution of monitoring points of pressure pulsation.
Because the rotation speed of the pump n is 1450 r/min in this experiment, axis-passing frequency of the pump is 25 Hz. Due to the impeller with five blades, the blade-passing frequency of the impeller is 125 Hz (i.e. 5th harmonic of axis-passing frequency).
Numerical results and analysis
Energy performance
Figure 8 shows the energy performance curves of the three schemes. Compared with the original scheme, efficiency of improving scheme 1 and improving scheme 2 are greatly increased. Efficiency of the improving scheme 2 is 79.59%, which is the maximum and is 6.37% higher than that of the original scheme. Efficiency of the improving scheme 1 is 77.47%, which is 4.25% higher than that of the original scheme.
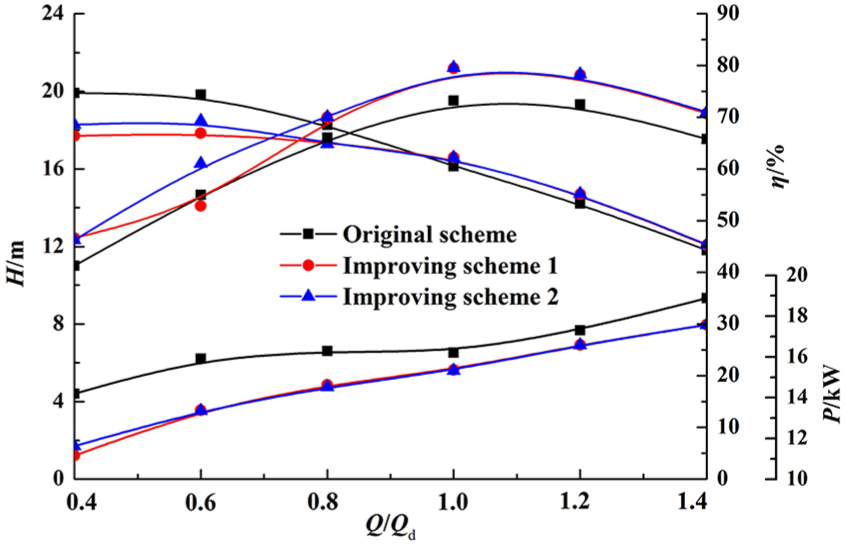
Energy performance curve with numerical simulation.
Internal flow field
Figure 9 shows the absolute velocity distribution and streamlines in the middle section under the design flow rate. As can be seen from Figure 9, the absolute velocity distributions in the three schemes are gradually increased from the impeller inlet. They reach the maximum at the impeller outlet. In the original scheme, a high-pressure area appeared on the suction surface of the impeller near the outlet. The internal flow of the improving scheme 1 and improving scheme 2 are uniform and stable. The high-pressure area is very small and can be neglected. A distinct low-pressure area appeared at downstream of the right side of the annual chamber in the original scheme. A wake zone without fluid flow appeared near the low-pressure area. For the two improving schemes, the impact of the flow is weak, which can reduce flow loss to some extent.

Absolute velocity distribution in middle section: (a) original scheme, (b) improving scheme 1, and (c) improving scheme 2.
Axial force
The axial forces of the three schemes under the different flow rate are shown in Figure 10. The axial force decreases with the increase of flow rate. In contrast to the three schemes, the parameters of the back-blades of impeller in original scheme are most appropriate. Because the ability to balance the axial force gradually decreases after trimming the diameter and width of the back-blades of impeller. Under the design flow rate, the axial force of the model without back-blades is 3000 N. The original scheme can balance 89.47% of the axial force, while the improving scheme 1 can balance only 69.82% of the axial force and the improving scheme 2 can balance only 62.74% of the axial force. The difference of the axial force between improving scheme 1 and improving scheme 2 is 7.08 percentage points.
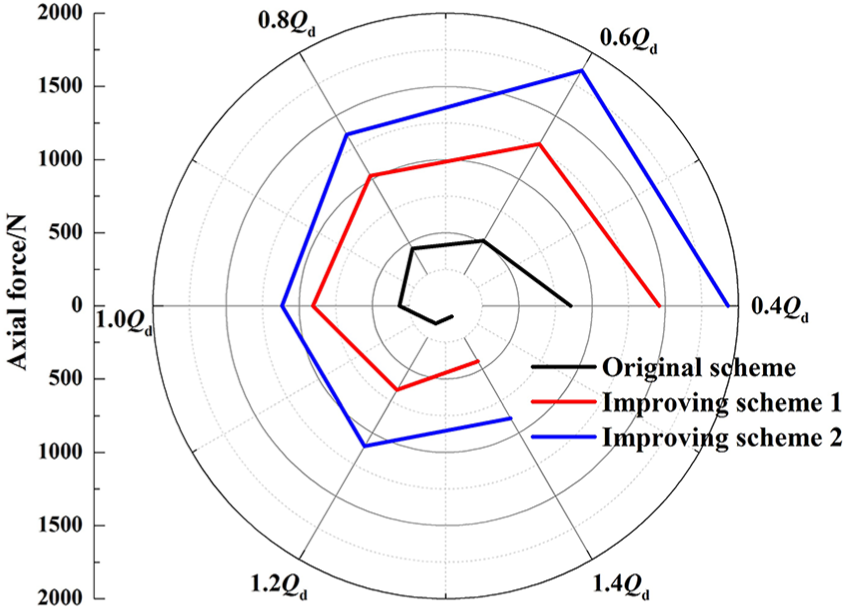
Axial force under different flow rate.
Although trimming the back-blades of the impeller reduces their ability to balance axial force, it can greatly improve efficiency. Therefore, the improving scheme 2, which is better than improving scheme 1, was chosen to perform the subsequent experiment verification.
Radial force
Figure 11 shows time domain and frequency domain of the radial force in the impeller under the design flow rate. It can be seen from Figure 11 that the time domain and frequency domain of radial force in the three schemes are exactly the same when the impeller rotates for one circle, while the magnitude is different. It can be seen from Figure 11(a) that the peak value of the pressure pulsation peak can be arranged in order: original scheme >improving scheme 1 >improving scheme 2. The peak value of scheme 1 is 12% smaller than that of the original scheme. The peak value of the improving scheme 2 is 20% smaller than that of the original scheme. It can be seen from Figure 11(b) that the dominant frequency of the three schemes is 25 Hz (i.e. axis-passing frequency) and the second frequency is 600 Hz. Amplitude of the frequency domain of the improving scheme 1 is 83.6% of the original scheme. Amplitude of the frequency domain of the improving scheme 2 is 74.5% of the original scheme.
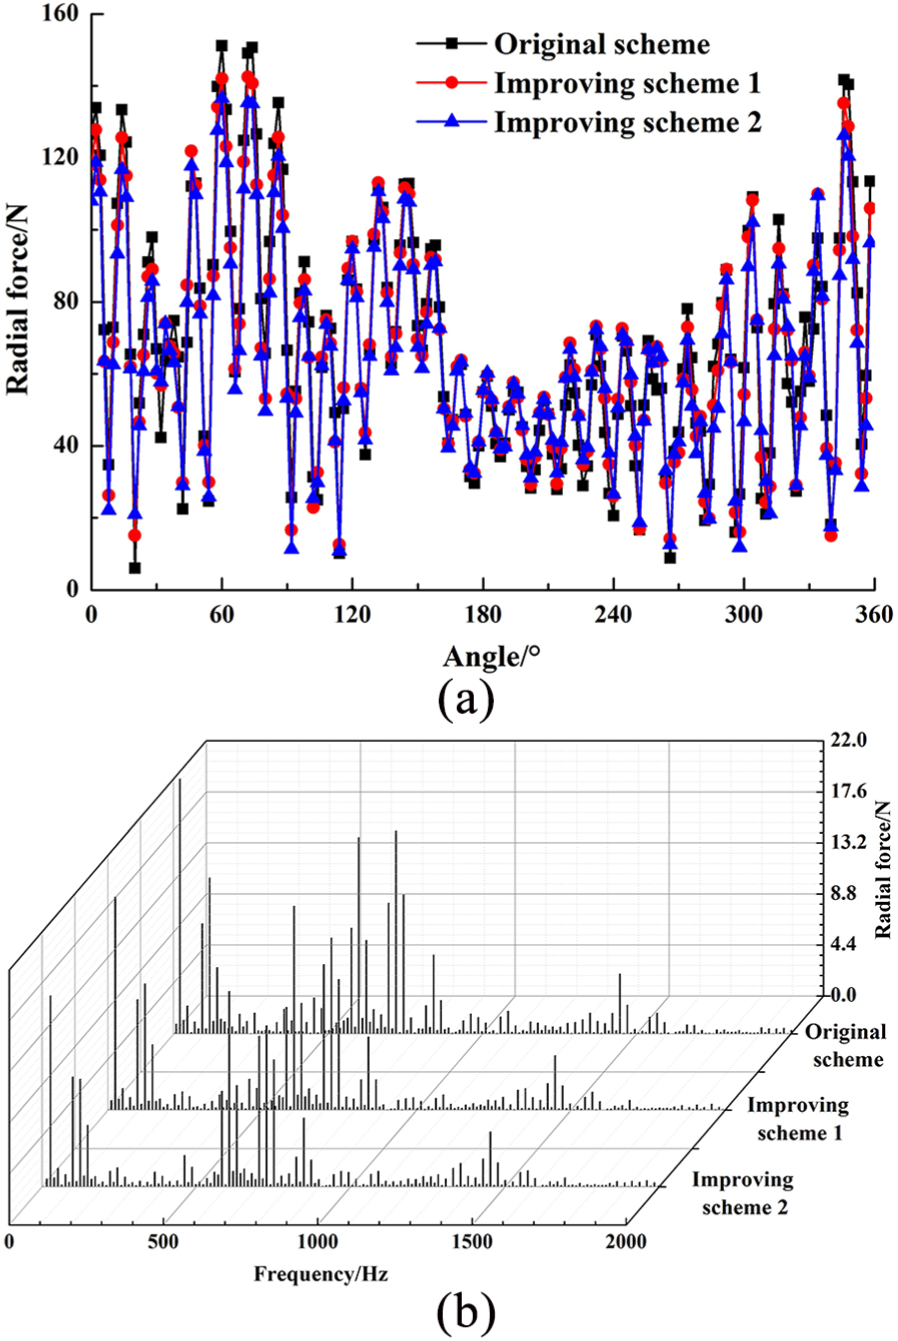
Radial force in the impeller: (a) time domain and(b) frequency domain.
Figure 12 shows time domain and frequency domain of the radial force in the annual chamber under the design flow rate. As can be seen from Figure 12(a), the radial forces of the three schemes are exactly the same. There are five peaks and troughs, which is corresponding to the blade number of the impeller. The difference of the radial force peak between the improving scheme 1 and the improving scheme 2 is very small. But at the same angle, pressure value of the original scheme is the minimum. This is due to the reduction of the energy loss when the back-blades of the impeller is trimmed, which results in the increase of the outlet pressure. From Figure 12(b), it can be seen that the dominant frequency of the three schemes is 120 Hz. Amplitude of blade frequency of the radial force in the improving scheme 1 and the improving scheme 2 is 6.6% lower than that of the original scheme. Therefore, although the pressure value of the improving scheme 1 and the improving scheme 2 increased, the pressure pulsation conditions are improved.

Radial force in the annular chamber: (a) time domain and (b) frequency domain.
Figure 13 indicates radial force vector in the annular chamber. As can be seen from Figure 13, the radial force vectors of the three schemes are all hexagonal, which is corresponding to the blade number of the vaned diffuser. In one rotating period, hexagon repeats five times which is corresponding to the blade number of the impeller. Therefore, the radial force in the annular chamber is the result of rotor–stator interference between the impeller and the vaned diffuser. Each blade of impeller sweeps over a stationary blade of vaned diffuser which leads to a radial force peak. The difference of radial force vector between the improving scheme 1 and the improving scheme 2 is very small. The radial forces of the two schemes are more evenly distributed in the four quadrants. The radial force of the original scheme is partial to the X direction. Theoretically, the radial force distribution is uniform, indicating that the force in each direction is more uniform, and there will be no large vibration impact. However, the original scheme with uneven radial force distribution is easy to generate stress on one side. It leads to greater stress concentration in the annular chamber which is unfavorable to the long-term smooth running of the pump.

Radial force vector in the annular chamber.
Pressure pulsation
The result of numerical simulation on each monitoring point shows the static pressure at different time. In order to accurately compare the pressure of each monitoring point, the pressure pulsation coefficient Cp is introduced
where p is the static pressure of the monitoring point,
Figure 14 shows the time domain and frequency domain of the pressure pulsation at the monitoring point P1. As can be seen from Figure 14(a), the pulsations in the three schemes are exactly the same, which have five peaks and troughs. The time to enter the peaks (i.e. the high-pressure area) is longer than the time to enter the troughs (i.e. the low-pressure area). It indicates that high-pressure area at the outlet of impeller is larger. As shown in Figure 14(b), the dominant frequency of the three schemes is 150 Hz (i.e. 6th harmonic of axis-passing frequency, or blade-passing frequency of the vaned diffuser). The amplitude difference of the pressure pulsation between the three schemes is very small. Therefore, trimming back-blades of impeller does not affect the change trend of the pressure pulsation at the outlet of the impeller and has little influence on its amplitude.

Pressure pulsation at P1: (a) time domain and(b) frequency domain.
Figure 15 gives the time domain and frequency domain of the pressure pulsation at the monitoring point P2. The pulsation rule of time domain and frequency domain are basically the same in the three schemes. The order of the peak value of pressure pulsation is as follows: improving scheme 2 >improving scheme 1 >original scheme. The difference of the peak value of pressure pulsation between the improving scheme 2 and the original scheme is the largest. The peak value of pressure pulsation is 0.14% larger than that of the original scheme. The pressure pulsation coefficients of the three schemes are compared. The dominant frequency of the three schemes is 120 Hz, which is the blade-passing frequency of the impeller. The order of the amplitudes of the pressure pulsation coefficients is as follows: original scheme >improving scheme 1 >improving scheme 2. The amplitude of the pressure pulsation in the improving scheme 1 is 94.4% of the original scheme and improving scheme 2 is 93.2% of the original scheme. The difference between the improving scheme 1 and the improving scheme 2 is very small. Therefore, the pressure pulsation of the monitoring point at outlet of the vaned diffuser is mainly affected by the rotor–stator interference at outlet of the impeller. The monitoring point of the vaned diffuser outlet is closer to the outlet diffuser section of the annular chamber. The pressure pulsation signal is also affected by the outlet diffuser section.

Pressure pulsation at P2: (a) time domain and(b) frequency domain.
Figure 16 shows the time domain and frequency domain of the pressure pulsation at the monitoring point P3. As can be seen from Figure 16, the pulsation rules of the pressure values in the three schemes also are the same. The order is as follows: original scheme >improving scheme 1 >improving scheme 2. The peak value of pressure pulsation in the improving scheme 2 is 0.52% lower than that of the original scheme. Variation rule of the amplitude of pressure pulsation coefficient is the same as that of the pressure value. The dominant frequency of the three schemes is 120 Hz.
Pressure pulsation at P3: (a) time domain and(b) frequency domain.
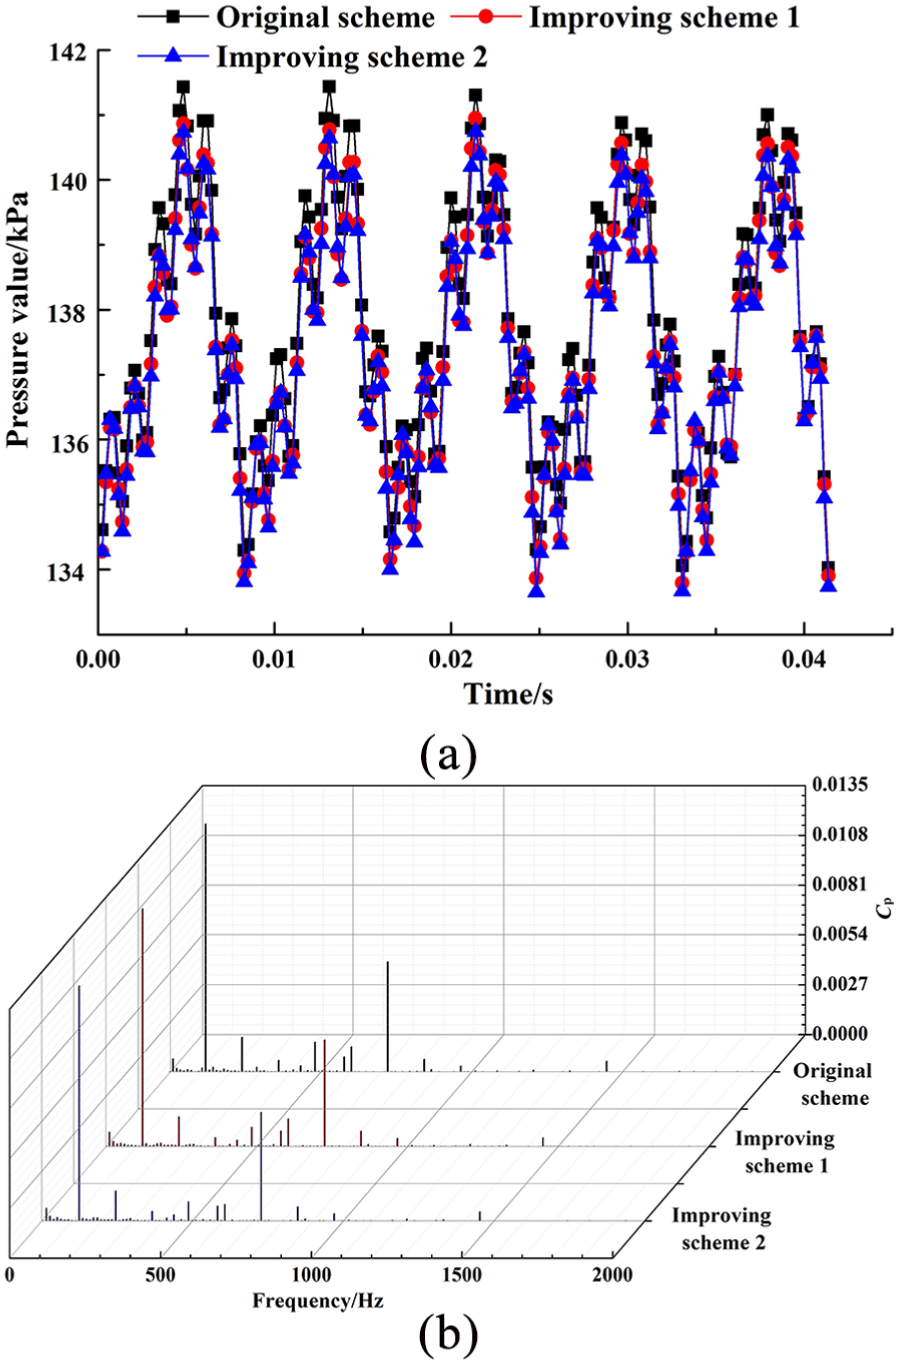
Figure 17 shows the time domain and frequency domain of the pressure pulsation at the monitoring point P4. As can be seen from Figure 17(a), the pressure values of the improving scheme 1 and the improving scheme 2 are obviously larger than that of the original scheme. The pressure value of the improving scheme 1 is 16.4% larger than that of the original scheme and the improving scheme 2 is 16.8% larger than that of the original scheme. The increase of the outlet pressure is due to the decrease of energy loss after structural optimization. The magnitude of the pressure pulsation frequency in Figure 17(b) is in the order as follows: original scheme >improving scheme 1 >improving scheme 2. The improving scheme 1 is 12.85% less than that of the original scheme and the improving scheme 2 is 14.2% less than that of the original scheme. The dominant frequency is the blade-passing frequency of the impeller.

Pressure pulsation at P4: (a) time domain and(b) frequency domain.
Experiment verification
In order to verify the feasibility of structural improvement, experimental measurements on the improving scheme 2 were carried out. The energy performance curves of the original scheme and the improving scheme 2 are shown in Figure 18. As can be seen from Figure 18, the differences between head and efficiency of the pump before and after optimization are very small under the small flow rate. With increase of the flow rate, the difference also increases. Under the design flow rate, the efficiency of the improving scheme 2 is 76.48%, which is 5.26 percentage points higher than that of the original scheme. The effect of structural improvement is very obvious.

Comparison of energy performance.
Conclusion
The structure of a centrifugal pump with vaned diffuser has been improved. Numerical analysis and experimental verification have been carried out. Some conclusions are as follows:
Trimming back-blades has a certain influence on the axial force in the pump. Under the design flow rate, the original scheme can balance 89.47% of the axial force, the improving scheme 1 can balance 69.82% of the axial force, and the improving scheme 2 can balance 62.74% of the axial force.
The frequency-domain amplitude of radial force of the improving scheme 1 is 83.6% of the original scheme, while the frequency-domain amplitude of radial force of the improving scheme 2 is 74.5% of the original scheme. After structural improvement, the radial force in the annular chamber increases. But the pulsation of frequency domain is improved, and the vector distribution is more uniform than that of the original scheme.
In the two improving schemes, the pressure pulsation coefficients at the four monitoring points are less than that of the original scheme.
Although trimming the back-blades of the impeller reduces their ability to balance axial force, it can greatly improve efficiency. Experimental results of the improving scheme 2 show that the efficiency of the improving scheme 2 under the design flow rate is 76.48%, which is 5.26 percentage points higher than that of the original scheme.
Footnotes
Handling Editor: Assunta Andreozzi
Declaration of conflicting interests
The author(s) declared no potential conflicts of interest with respect to the research, authorship, and/or publication of this article.
Funding
The author(s) disclosed receipt of the following financial support for the research, authorship, and/or publication of this article: This work was supported by the National Key Research and Development Program of China (grant no.: 2016YFB0200901), the National Natural Science Foundation of China (grant nos.: 51579117 and 51779108), and Six Talent Peaks Project in Jiangsu Province of China (grant no.: 2018-GDZB-154).