
Abstract
Using response surface methodology, two-target parameter mathematical models for a 100MD60Y4 motorized spindle are established using biogeography-based optimization. Air supply pressure, fuel supply rate, and oil supply interval are the independent variables, while the spindle temperature increase and oil mist PM2.5 cumulative volume distribution percentage are the response variables. Biogeography-based optimization is used to find a set of optimal lubrication system parameters with the constraint of a small temperature increase in the motorized spindle at 30,000 r/min while considering the influence of oil mist particle size on environmental quality. After lubrication system parameter optimization, comparing the particle size distribution density and temperature increase between the biogeography-based optimization model’s calculated values and the experimental test results, the errors were 1.8% and 1.17%, respectively.
Keywords
Introduction
Computer numerical control (CNC) machine tools occupy a pivotal position in national economic development. Automation, intelligence, and green development are hallmarks of CNC machine tools. In order to meet the demands of low-carbon manufacturing and sustainable development, the design, manufacture, and use of CNC machine tools are necessary.1,2 An important development is high-speed spindle technology, which is used in advanced cutting operations. However, these spindles experience elevated temperatures that affect equipment life. Accordingly, most motorized spindles employ oil–air lubrication which simultaneously provides bearing lubrication and rotor cooling. Although oil–air lubrication uses less oil than oil mist and atomize the oil, small oil droplets remain in the air, which we consider “oil mist” for purposes of environmental air quality and safety. Research shows that the health risk created by oil mist is closely related to the size of the oil particles. Oil particles less than 2.5 μm diameter (PM2.5) enter the the bronchi and alveoli, allowing harmful substances in the oil to infiltrate the bloodstream, causing harm to the human body.3–5 For this reason, the European machine tool manufacturing industry is relatively focused on the environmental performance of machine tools. Technologies such as dry cutting and hard cutting—processes based on using less cutting fluid and lubricant—are targeted at reducing machine tool operation environmental emissions. Weinert 6 provided a detailed and comprehensive discussion on dry-cutting technology and cutting technology using less cutting fluid. The Michigan University of Technology’s Environmental Awareness Project has studied the waste generated by various mechanical processes of machine tools, developing various methods for predicting waste and proposals to reduce emissions via process optimization. 7 Recently, scholars have studied oil–air lubrication systems and motorized spindles.8–10 Lin 11 developed a genetic algorithm optimization approach to search for optimal bearing locations on a motorized spindle shaft. Jeng and colleagues compared different conditions of oil–air lubrication with mixed ceramic ball bearings and steel ball bearings while increasing temperature. The study accounted for the load, spindle speed, fuel supply rate, gas flow rate of oil, and operating parameters, studying how they impacted steel bearing temperature increase.12,13 Huang and Zhang 14 analyzed the frictional heating of a high-speed motorized spindle and the heat radiation of an oil–air lubrication system. Jiang and Mao 15 investigated the effects of the operational parameters of an oil–air lubrication system on the temperature rise of both the hybrid ceramic ball bearing and steel ball bearing.
The above-mentioned studies separately considered environmental performance and processing efficiency; however, there has been no combined discussion of these topics. A challenge in the machinery manufacturing industry is how to achieve high-quality processing efficiency and effective ambient air quality control. The 100MD60Y4 motorized spindle, manufactured by Luoyang Bearing Research Institute Co., Ltd., is the subject of this study. Based on a single-factor experiment using response surface methodology, two-target parameter mathematical models are established. Air supply pressure, fuel supply rate, and oil supply interval are the independent variables, while the motorized spindle temperature increase and oil mist PM2.5 cumulative volume distribution are the response variables, which are optimized using biogeography-based optimization (BBO). With the constraint of ensuring a small motorized spindle temperature increase, the influence of oil mist particle size on environmental quality is evaluated to find a set of optimal lubrication system parameters. The results are compared with those from the “fmincon” function, which can be used to solve the minimum value of a nonlinear multi-function in MATLAB.
Experimental method
In this article, a TC-2008 multi-channel thermometer was used to measure the temperature increase in the motorized spindle bearing outer races, and a laser particle size analyzer was used to measure the oil mist released from the spindle to the environment.
Single-factor experiments were done, with each experiment lasting 40 min. The experimental setup is shown in Figure 1.
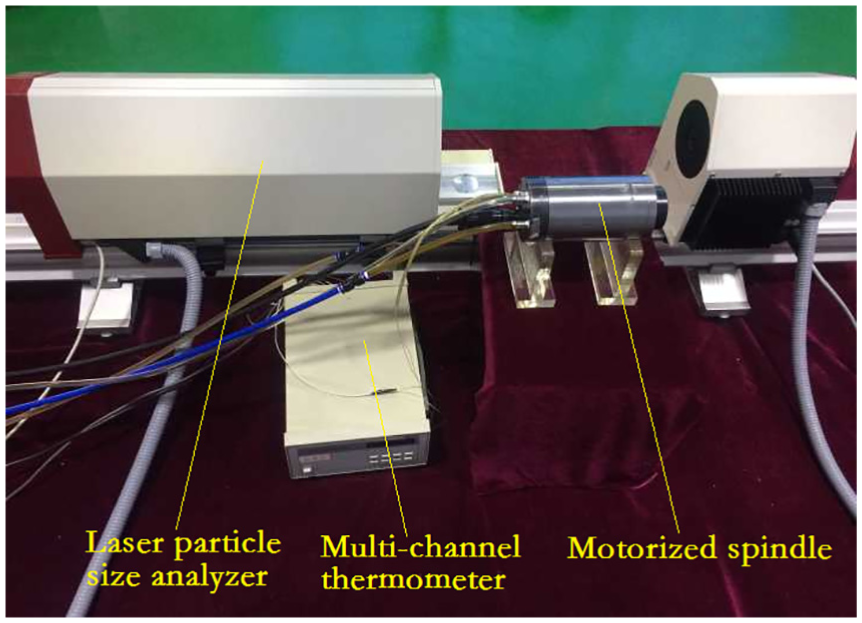
Experimental setup.
The spindle bearing temperature rise (ΔT) as a function of air supply pressure, fuel supply rate, and oil supply interval is shown in Figure 2. In each experiment, the spindle bearing temperature rise reached a steady state before the end of the 40 min. The cumulative distribution (Q3) and distribution density (q3*) of oil mist particles with air supply pressure, fuel supply rate, and oil supply interval are shown in Figures 3 and 4, respectively.

Bearing temperature increase: effect of (a) air pressure when the oil supply interval is 0.2 s and the fuel supply rate is 24 mL/h, (b) oil supply interval when the air supply pressure is 0.29 MPa and the fuel supply rate is 24 mL/h, and (c) fuel supply rate when the oil supply interval is 0.2 s and the air supply pressure is 0.29 MPa.

Cumulative distribution of oil mist particles: effect of(a) air pressure when the oil supply interval is 0.2 s and the fuel supply rate is 24 mL/h, (b) oil supply interval when the air supply pressure is 0.29 MPa and the fuel supply rate is 24 mL/h, and(c) fuel supply rate when the oil supply interval is 0.2 s and the air supply pressure is 0.29 MPa.

Distribution density of oil mist particles: effect of (a) air pressure when the oil supply interval is 0.2 s and the fuel supply rate is 24 mL/h, (b) oil supply interval when the air supply pressure is 0.29 MPa and the fuel supply rate is 24 mL/h, and (c) fuel supply rate when the oil supply interval is 0.2 s and the air supply pressure is 0.29 MPa.
The impact of these parameters is shown to have a significant effect on air quality. The oil mist particle size PM2.5 cumulative volume with time under different conditions is shown in Figure 5. The oil mist particle size PM2.5 cumulative volume does not change with time under certain conditions.

Oil mist particle size PM2.5 cumulative volume with time.
Model design
Referencing the previous single-factor experiment studying lubrication system parameters and using the Box–Behnken experimental design criteria, three levels (high, medium, and low) for each of the three factors were chosen. These values were 0.29, 0.35, and 0.41 MPa for air supply pressure; 6.5, 15.25, and 24 mL/h for fuel supply rate; 0.6, 90.6, and 180 s for oil supply interval; and the spindle speed was fixed at 30,000 r/min. According to the Box–Behnken center combination using three response-point analyses with three factors and three levels, a total of 17 experimental points from groups 1 to 12 were used for the analysis; the last five sets of data for the central experiment were used to estimate the error (Table 1). The advantage of this design is that the number of experiments is relatively small; since all factors are not at a high level at the same time, the experimental design ensures that all design points are in a safe range.
Design of a three-factor, three-level Box–Behnken experiment.

The results of these experiments are listed under “response variable” in Table 1. In the experimental results, the variation range of the motorized spindle temperature was 15.1°C–21.1°C, and the oil mist particle size PM2.5 cumulative volume distribution was 0.003–1. The data range was relatively wide, and the order of magnitude was not uniform, leading to inaccurate predictions. Therefore, the min–max normalization method was used to normalize the data to reduce the data range and improve prediction and model accuracy. The original data were linearly transformed with equation (1) to map the resulting value between 0 and 1, where max and min are the maximum and minimum values of the response variable data, respectively. The results are listed in Table 1 under the “normalization” heading;

The response surface method is a regression method for function estimation that provides a functional relationship between the factors in a multi-factor experiment and the experimental response values. Surface analysis of the function and quantitative analysis of each factor was conducted and their influence on the response values was determined. For the multifactor experiments, ΔT and Q3 were measured at t = 40 min (the end of the experiment).
When the regression model of

where G is the air supply pressure, B is the fuel supply rate, t is the oil supply interval, and
To evaluate the reliability of the experimental results and the fitting accuracy of the model, the results were tested for significance. First, a variance experiment was conducted, determining the significance of each factor. Second, the significance of the overall experiment was determined. Table 2 shows the partial regression analysis of the oil mist PM2.5 cumulative volume distribution percentage for the spindle lubrication system outlet.
Variance of the PM2.5 cumulative volume distribution regression equation.

Multiple correlation coefficient R2 = 0.9298; correction coefficient
From the analysis of variance in Table 2, the experimental value P = 0.04 < 0.05 indicates that the model in equation (2) was significant. The correction coefficient of the model was 0.93805, which indicates that the model can explain a change of 93.80% in the response value; that is, only 6.20% of the total variation cannot be explained by it. The multiple correlation coefficient was 0.9298, indicating a strong correlation between the predicted value and the measured value; the model fits well. The model resolution was 67.66 > 4, indicating sufficient resolution. Thus, equation (2) is suitable and can be used to analyze and predict the oil mist PM2.5 cumulative volume distribution percentage.
When the regression model of
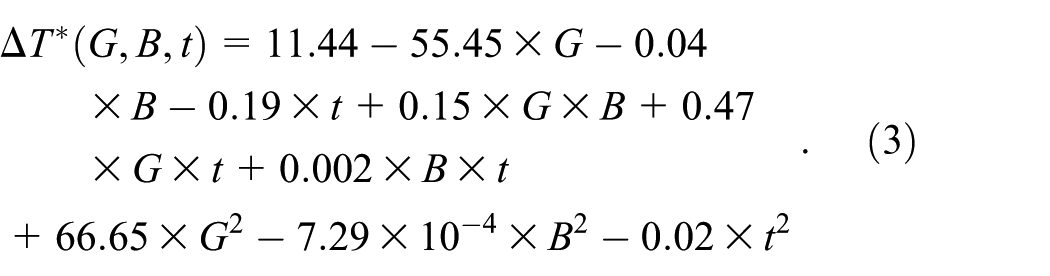
From the analysis of variance in Table 3, the experimental value
Variance of the motorized spindle temperature increase regression equation.
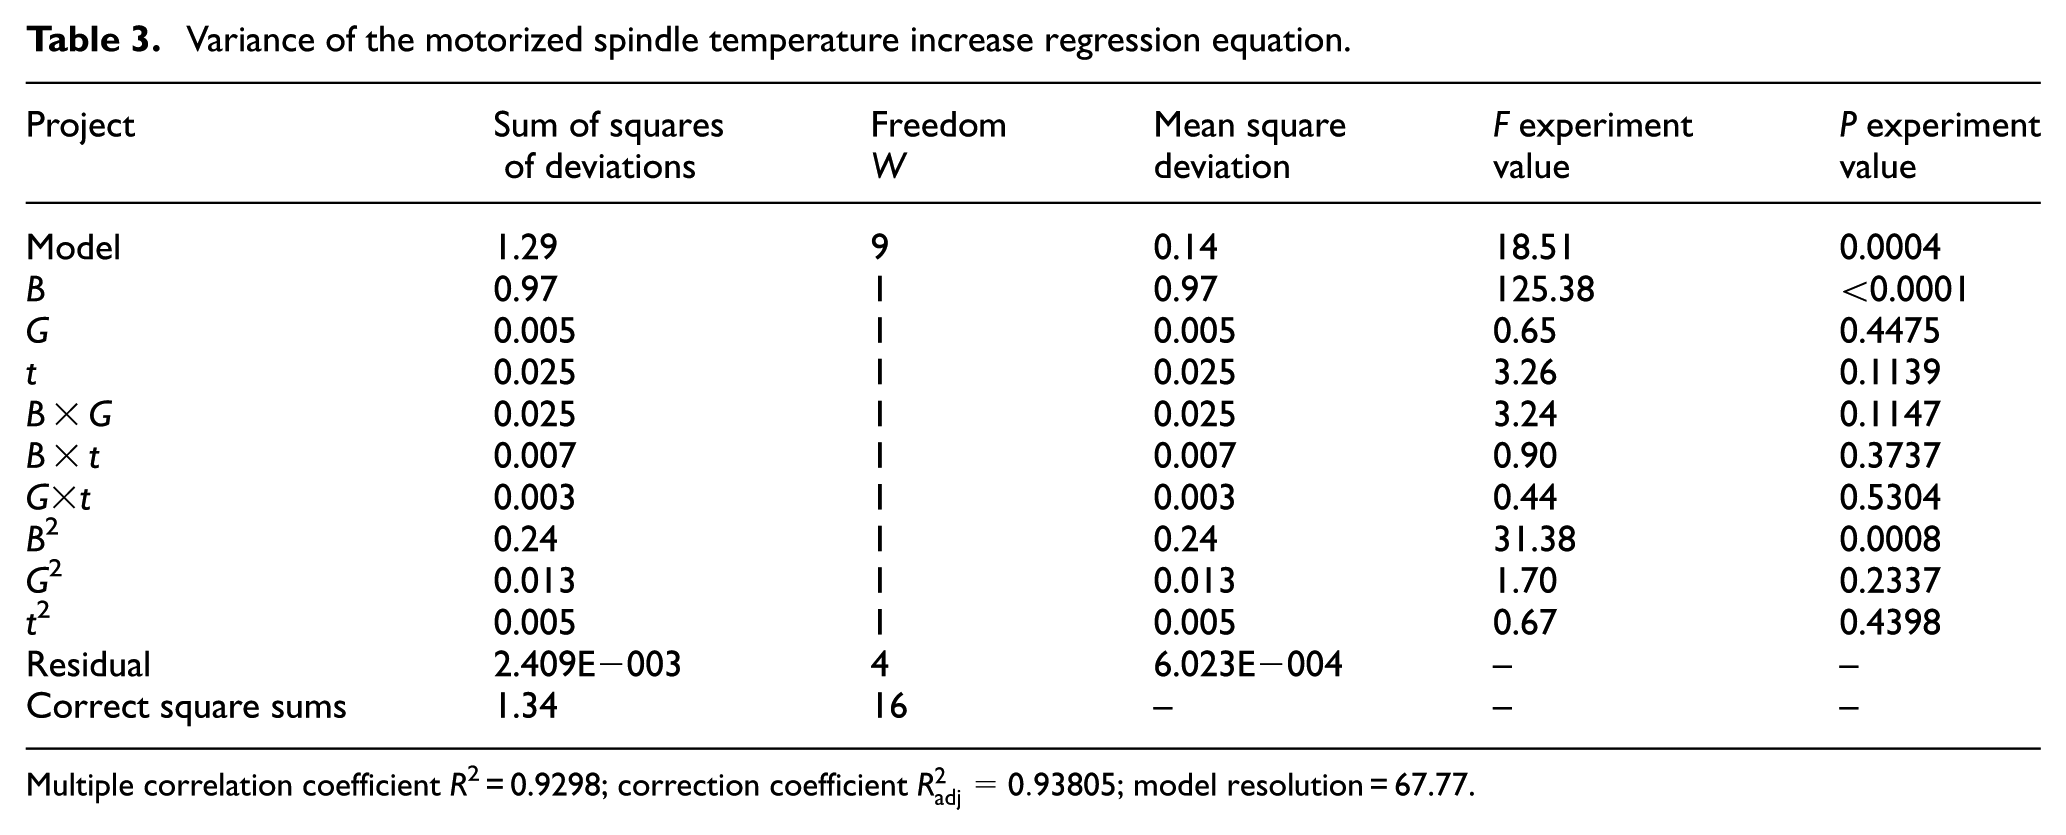
Multiple correlation coefficient R2 = 0.9298; correction coefficient
The optimal design of the response surface model requires further statistical feature diagnosis to determine the accuracy. One method is the normal probability graph of the student’s residual, which is used to show whether the residuals conform to the normal distribution. If the points are concentrated on the plane and distributed along the line, then they conform to a normal distribution. The spindle temperature increase and oil mist PM2.5 cumulative volume distribution represent the two target parameters of the response surface model; the relevant student’s residual normal probability diagram is shown in Figure 6, which indicates that the response surface model established was statistically accurate.
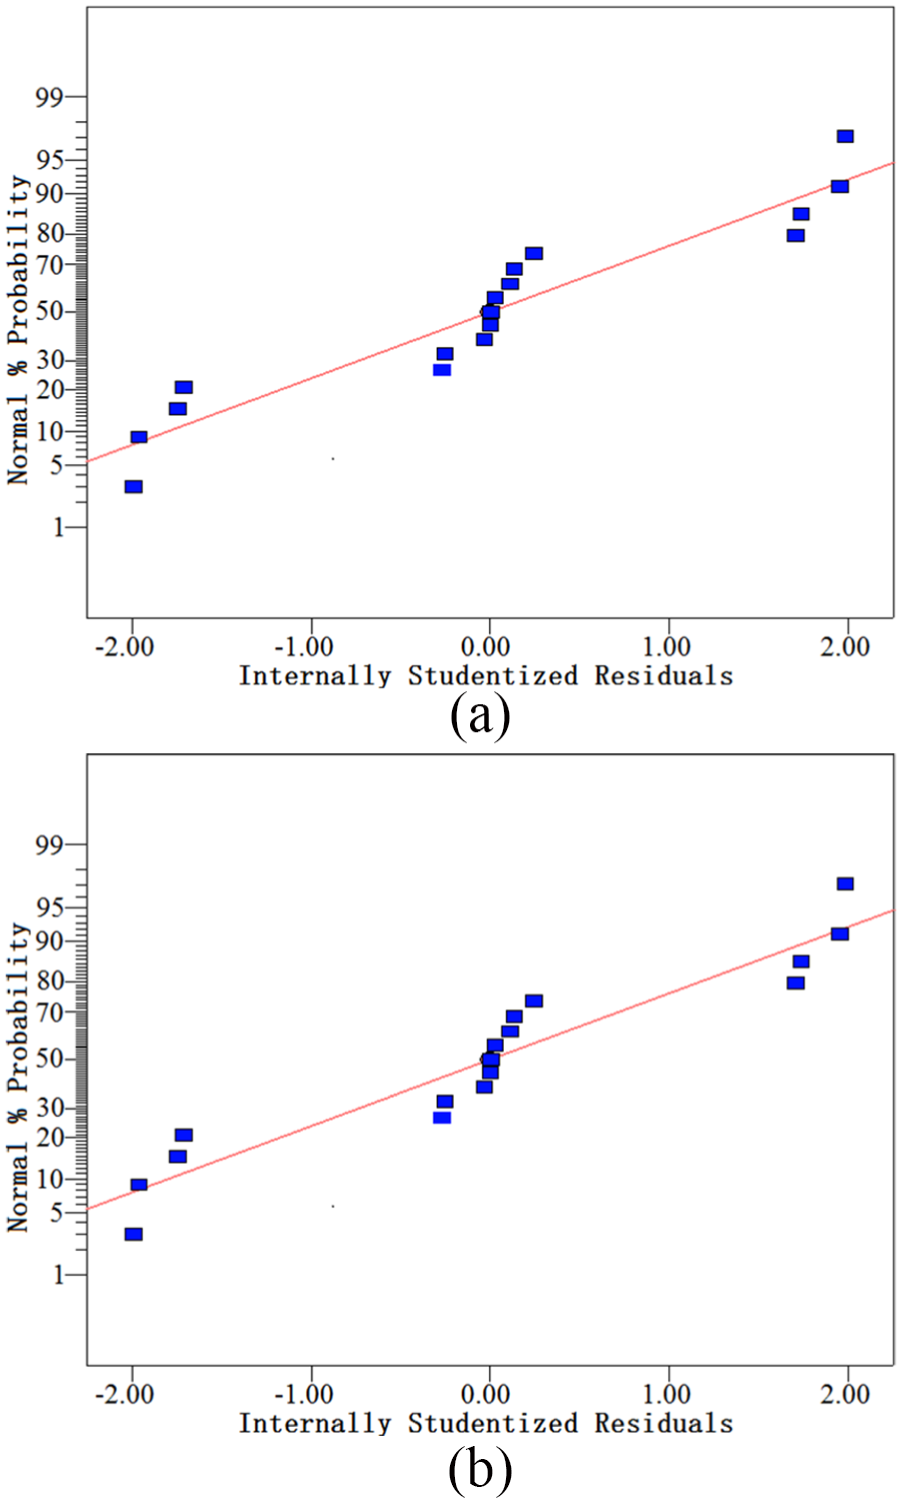
Normalized plot of residuals for the target parameter response surface models: (a) M* and (b) T*.
Two-objective optimization
The objective functions

Design procedure
First stage
There are many methods for solving constrained optimization.16,17 Traditional global optimizations such as genetic algorithms and particle swarm algorithms are the best tools to solve such problems,18–20 but their search and convergence accuracy have yet to be improved. BBO 21 is one of the best intelligent optimization algorithms for global optimization. It is superior to the genetic algorithm and other optimization algorithms in terms of convergence accuracy and velocity and is especially suitable for optimization in practical engineering applications. In function optimization, production scheduling, heart disease diagnosis, and other fields, BBO has been applied successfully. 22
The BBO algorithm seeks an optimal global solution by simulating the mechanism of species migration between habitats. In the BBO algorithm, the biological population lives in different habitats H, and each habitat determines the habitat adaptation characteristics according to the number of species. A habitat suitable for the species has a higher habitat suitability index (HSI). HSI represents the evaluation of fitness according to the objective function. When optimizing, good solutions have a high-HSI habitat, whereas poor solutions have a low-HSI habitat. The BBO algorithm needs to construct multiple groups randomly, and the corresponding suitability index vector (SIV) is the initial solution of the optimization problem. Through evolution of the population, the HSI improves and the optimal solution is obtained.23–25 The evolution process involves population migration and population mutation. In this article, the relationships between the BBO algorithm and lubrication system parameters are shown in Table 4.
Relationships between BBO and the optimization parameters of the lubrication system.

BBO: biogeography-based optimization; SIV: suitability index vector; HSI: habitat suitability index.
The BBO algorithm uses the migration mechanism to complete the exchange of information with other groups; a wide scope search is then performed in the solution space of
In the cosine models, I is the maximum immigration rate, E is the maximum emigration rate, n is the number of species at saturation, and k0 is the number of species when the group moves to a new equilibrium. The expressions of the immigration rate


Each migration operation is determined by the immigration rate
Another evolutionary process is the mutation operation. The BBO algorithm simulates the change of the suitability of the population due to a sudden event. The SIV is mutated according to the probability

The mutation rate of

where
In the mutation operation, according to mi, group
Second stage
The BBO algorithm steps are summarized as follows:
Step 1. Set the number of habitats S and the maximum number of species n. Set the maximum value of the immigration rate function I, the maximum value of the emigration rate E, and the maximum mutation rate
Step 2. Calculate the HSI value of the population and arrange them in ascending order. Based on this, determine the number of species k contained in each group. Calculate the groups’
Step 3. Perform the species migration operation according to the immigration rate
Step 4. Calculate the species probability
Step 5. According to the variation rate of each habitat, the species mutation operation is performed and the HSI is recalculated. The SIV corresponding to the HSI is selected.
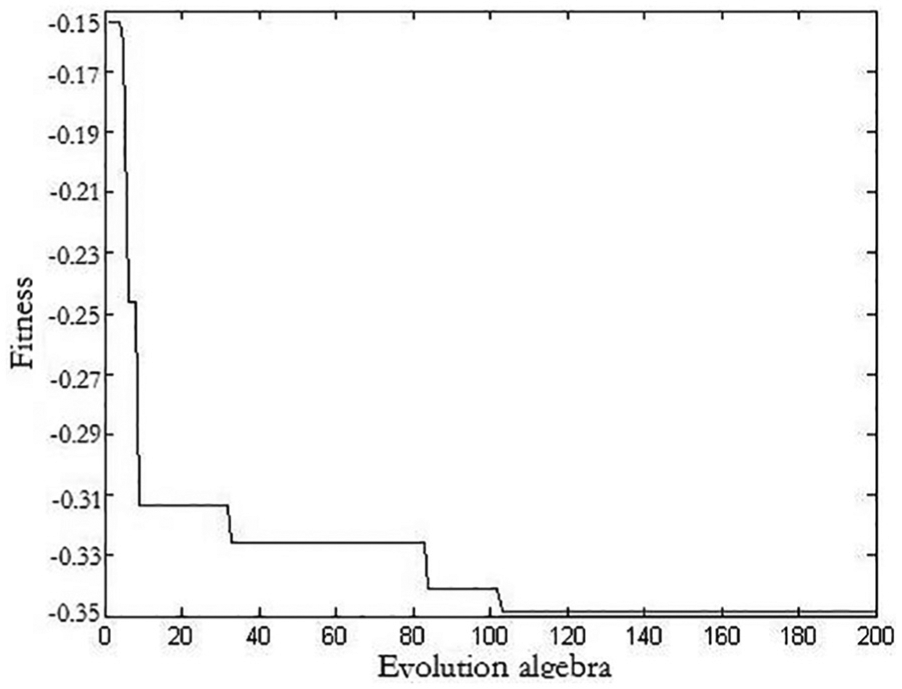
Step 6. Determine whether the termination conditions are met. If the conditions are satisfied, end the cycle and output the optimal solution. Otherwise, return to step 2 to continue the search. Using BBO, the objective functions of
After optimization by BBO, the final optimal parameters were G = 0.38 MPa, B = 6.5 mL/h, and t = 2.98 min. The
Verification of optimization results
BBO and fmincon function method comparison
The conventional solution to this nonlinear constraint problem is to use the fmincon function provided in MATLAB software. According to the model
Optimization results using the fmincon function compared with BBO.

BBO: biogeography-based optimization.
Clearly, the value obtained by the fmincon function was greater than the optimal value
Experimental verification
According to the optimal BBO parameters, that is, G = 0.38 MPa, B = 6.5 mL/h, and t = 2.98 min, the optimized values are
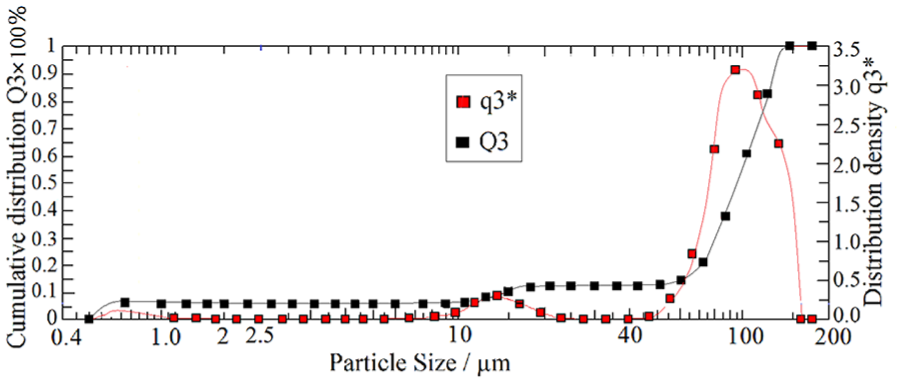
Particle size cumulative distribution and distribution density.
The abscissa in Figure 8 denotes the particle size. The left and right ordinates represent the cumulative distribution Q3 and the density distribution q3*, respectively. As seen in Figure 8, the particle size was 1–40 μm, and the particle size distribution density was maximized at 12.5 μm. The initial temperature of the bearing outer rings of the motorized spindle was 17.8°C then increased to, and remained at, 31.1°C for the duration of the 40-min test. The temperature increase is shown in Figure 9.

Bearing outer rings of the motorized spindle temperature increase.
The particle size distribution density and temperature increase errors were 1.8% and 1.17%, respectively.
Summary and conclusion
In this article, two-target parameter mathematical models were established based on single-factor experiments, using response surface methodology. The air supply pressure, fuel supply rate, and oil supply interval were the independent variables, while the motorized spindle temperature increase and oil mist PM2.5 cumulative volume distribution were the response variables. The accuracy of the model was verified by variance and correlation tests.
The proposed model utilizes the BBO algorithm to optimize the parameters of the motorized spindle lubrication system. The results show a target parameter temperature increase of 13.1°C and oil mist PM2.5 cumulative volume distribution of 0.0628 for lubrication system parameters of G = 0.38 MPa, B = 6.5 mL/h, and t = 2.98 min. The accuracy of the results was experimentally verified.
The proposed model can guide the design of operating parameters during operation of the motorized spindle, ensuring that the spindle system’s dynamic characteristics achieve green environmental goals.
Footnotes
Handling Editor: Xichun Luo
Declaration of conflicting interests
The author(s) declared no potential conflicts of interest with respect to the research, authorship, and/or publication of this article.
Funding
The author(s) disclosed receipt of the following financial support for the research, authorship, and/or publication of this article: This work was supported by the National Science Foundation (51375317 and 51675353), Liaoning Provincial Department of Education Project (LJZ2017005 and LJZ2017035), Science and Technology fund of Liaoning Province (20180550002), and the (local) National Joint Engineering Laboratory for open funds (sjsc-2015-6).