
Abstract
Ball screw is a mechanical device widely used in mechanical field. The reverse clearance of ball screw will reduce its precision. In order to eliminate the reverse clearance, it is necessary to apply preload to the ball screw. It is very difficult to measure the preload in real time, and the data are large and time-consuming. By using machine learning method to predict and supervise preload, the changing trend of working condition of ball screw can be evaluated in advance, and the working precision of screw is controlled, which has important engineering significance. In this article, the relationship between the preload and the friction torque is obtained through theoretical derivation and experimental verification. Then, the support vector machine is used as a tool to model the friction torque of ball screw with the parameters of material, lubrication, and revolution, and predict the value and trend of preload to complete the supervision and prediction of the preload of the ball screw. By comparing the experimental results, it is proved that the support vector machine is feasible in predicting and supervising the attenuation of the preload of ball screw.
Keywords
Introduction
With the progress of science and technology, computer numerical control machine tools play an increasingly important role in modern manufacturing. Ball screw is a key part of computer numerical control machine tool feeding system. Because of its strong bearing capacity, small friction coefficient, high contact stiffness, high positioning accuracy, and good accuracy, it has been widely used in precision linear motion guide parts of computer numerical control machine tools. 1 Roller screw in the manufacturing and practical use will be a certain amount of deformation due to heat generated, resulting in the gap between raceway and rollers. In particular, the reverse clearance directly affects the accuracy of the machine tool. 2 At this time, the application of a certain axial preload can effectively eliminate the gap, improve the screw operation accuracy, and increase the axial stiffness. However, in the long-term operation of the ball screw, the preload of the ball screw will be gradually lost due to the friction, vibration, and environmental changes, which is one of the main reasons for the precision reduction in the ball screw. The loss of preload directly leads to the low accuracy of the ball screw, which seriously restricts the development of high-grade computer numerical control (CNC) machine tools. At present, in our country, the measurement of the preload of the screw is mainly through indirect measurement, that is, to measure a certain parameter related to preload to complete the supervision of preload. For example, L Wang, on the basis of the theory of preload, proposed to use software for finite element analysis and then verify its correctness. He put forward the idea of measuring the preload by the size of friction torque and designed the relevant test bed; 3 S Ding et al. 4 successfully proved that the change in preload of ball screw can be detected by vibration signal of screw nut. In the field of automotive engines, X Zhang et al. 5 made use of the finite element method to calculate the stiffness, establish the three-dimensional solid model, and finally get the preload. In the field of wind power, F Su et al. 6 detected special bolts by ultrasonic bolt detector, which achieved the purpose of accurately measuring bolt preload in large quantities.
However, the attenuation of preload is a long process. It will consume a lot of manpower and material resources to supervise the preload by the above method. If we can find the correlation between these indexes and preload attenuation trend, we can predict the change of preload and evaluate the working state of screw pair. The method of machine learning based on data mainly studies how to find some laws on the basis of existing observational data and can use these laws to predict unknown data, which provides a new way to predict the attenuation trend of preload using existing data about ball screw pairs. Among them, the support vector machine (SVM) is suitable for solving problems such as small sample, over learning, nonlinear, and high dimension. This way has been widely used in the field of mechanical reliability. 7 For example, Z Shen et al. 8 presented a new method based on relative feature and multivariable SVM, which could predict the life of rolling bearing under small sample condition. When dealing with multidimensional problems, W Mao et al. 9 proposed a new loss function to improve the learning performance of the algorithm in the face of the problem of multidimensional output. In addition, they put forward the idea of the limit learning machine in the diagnosis of bearing faults, which improves the accuracy of fault prediction by online sequence prediction. 10 The above researches provide the necessary ideas for using SVM to predict the trend of the preload attenuation. Because the preload attenuation prediction of ball screw is a soft measurement problem of preload with different working conditions or material parameters, it is essentially a regression model of single variable or multivariable input. Therefore, in this article, SVM is first proposed to solve the problem that the preload attenuation of ball screw under finite state data is difficult to estimate.
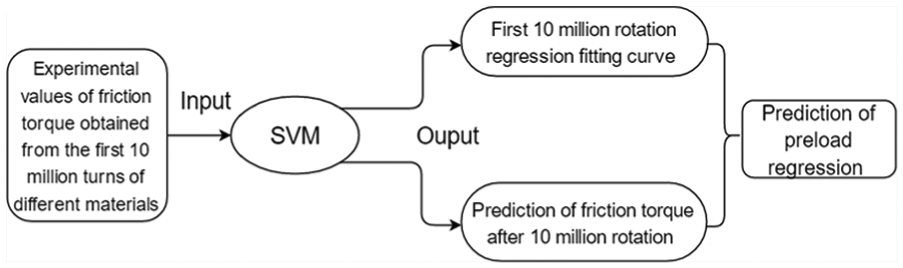
The preload attenuation under these factors is difficult to obtain directly by direct measurement. This article will use the change of friction torque to measure the attenuation of preload. Using SVM to establish the different regression models of friction torque, the variable regression and prediction of the preload of ball screws are carried out for different materials, different lubrication conditions, and the change in the temperature rise of the screw in the practical work. The attenuation trend of preload is obtained by means of such soft measurement. Specific ideas are shown in Figure 1.

Flow chart of preload attenuation prediction.
Correlative theories
Characterization of preload
The friction moment of ball screw is one of the important performances of ball screw. It directly affects the loss of energy, the change of temperature, and the change of sound absorption and vibration. In the research and production of ball screw, people have been working on the measurement and research of the friction moment. At present, there has been a relatively complete set of friction moment testing system in the world. 11 The article acquires the data of friction torque under the theory proposed by C Li et al. 12 that friction torque can be tested by testing the friction torque between the screw and the nut with torque sensor.
According to the analysis of Kragelsky and other people, the total frictional torque between the single ball and nut and ball screw raceway is as follows

From the above analysis, we know that if the effect of machining error is neglected, when the ball screw is not operated by the external load, the friction torque of ball screw without axial load can be approximated as the relative deformation caused by axial preload because the impact of ball and back is very small.
In the study of the loss of preload, the existing comprehensive performance test-bed condition cannot be used to directly measure against preload. It can be seen from the above inference that the size of preload will directly affect the friction moment of ball screws. In addition, the current domestic manufacturers apply the dynamic preload torque to the factory preload calibration, so the method of measuring friction torque to describe the loss of preload is feasible. 13
According to the dynamic preload torque measurement specification recognized and adopted by domestic well-known manufacturers, the ball screw pair dynamic preload torque is
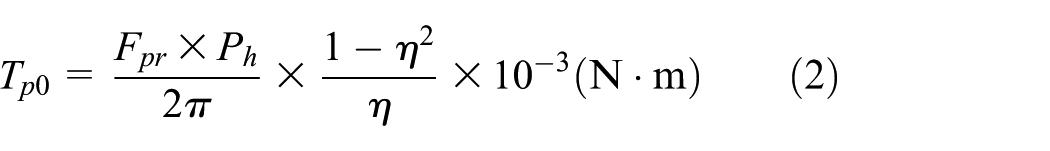
Generally, 1, 2-grade precision ball screws take η = 0.95 and 3,4-grade ones take η = 0.85 (consult the manufacturer’s technical manual
14
). It can be seen from the formula above that assuming that the efficiency η in the process of ball screw is a certain value, the dynamic preload torque
Kernel function of preload regression model
The kernel function of SVM enables the sample data to be mapped from the original space to a higher dimensional feature space, so that the sample can be linearly divided in this characteristic space. Therefore, the quality of feature space is critical to the performance of SVM. 15 However, when you do not know the feature map form, you do not know how the kernel function is suitable. The kernel function only implicitly defines this feature space. Therefore, the choice of kernel function is the maximum variable of SVM. Major kernel functions are linear kernel function, polynomial kernel function, radial basis kernel function, and sigmoid kernel function. 16
The friction torque is used to characterize the preload, and the friction torque has a certain noise with the change of each variable. As a global kernel function, the polynomial kernel function has a good generalization ability to distribute the scattered data, which is suitable for the orthogonal normalization data. But it has more parameters, and when the parameter is too large, the learning complexity will be too high. What’s more, it is easy to have an over-fitting phenomenon. The noise in the Gaussian radial basis check data has good anti-interference ability, also known as the classical robust radial nucleus. Because it can guarantee the full rank of the kernel matrix, it can be guaranteed that there are some solutions in SVM solution. Therefore, the Gaussian radial basis kernel function is used to characterize the frictional moment regression model. The Gaussian radial basis kernel function is

where x and z, respectively, represent two vectors,
The main parameters of Gaussian kernel function are c and gamma. Among them, c is the penalty coefficient, that is, tolerance of error. The higher the description is, the more intolerable the error will be. The smaller it is, the less likely it is to fit. If c becomes too large or too small, generalization ability will become worse. After we select the radial basis function (RBF) as the kernel function, gamma is a parameter that is taken from the function, which implicitly determines the distribution of the data to the new feature space. 17 There are many methods for c and gamma optimization, such as grid search method, cross validation method, and particle swarm optimization (PSO) algorithm. Cross-validation method needs a large data set; the grid search method is more intuitive, but a large number of SVM classifier models need to be trained and tested, which will consume a lot of time; PSO algorithm finds the global optimum by following the current search optimal value, which is easy to implement, and have high precision and fast convergence. 18
PSO is a swarm based on evolutionary algorithm. The PSO is initialized to a group of random particles (random solutions) in which the particle updates itself by tracking two “extremes” in each iteration: the first is the best solution found by the particle itself, called an individual extreme point (with pbest to indicate its position). Another extreme point in the global version of PSO is the best solution currently found by the whole population, called the global extremum point (with gbest to represent its position). After finding the two best solutions, the particle updates its speed and position according to formulae (4) and (5). The information of particle i can be represented by D-dimensional vectors. Its position is described as


where
Basic steps of the algorithm are shown in Figure 2.

Flow of PSO algorithm.
Regression and prediction of preload attenuation for different material screws
The most important cause of the preload loss is the wear between the ball and the raceway. The faster the ball raceway is worn along the axis, the quicker the preload is lost. For the screw itself, the different ball screw material will affect the screw wear, thus affecting the loss of preload. In the study, FYC2D-4010-5 P1 ball screws produced by a manufacturer were used. Domestic material screws and nuts are made with GCr15; imported material screws are made with 50GRMO4; and nuts are made with 100GR6. The screws run for 10 million RPM at the speed of 1000 r/min. The results of the frictional torques measured every 1 million cycles are shown in Table 1.
Results of frictional torque (Nm).

In the process to produce ball screws with different materials, the actual work of the ball screw performance changes will affect the preload. At the same time, there is a linear relationship between the preload of the ball screw and the friction moment. Therefore, in the study of the ball screw pairs of different materials, the data obtained from the previous experiments, that is, the friction torque of the first 10-million RPM of domestic materials and imported materials are taken as experimental input. The regression curve of the 10-million turn is obtained by SVM, and the change of friction moment after 10-million turn is forecasted. In the end, the regression prediction of the preload force and friction torque is completed, as shown in Figure 3.
Establishment of SVM regression model for different materials.
Because the magnitude difference between the number of the rotor and the friction moment is large, if the model is directly modeled, the convergence is difficult and may reduce the precision. Therefore, we first normalized the number of turns. We use the MATLAB mapminmax function to normalize the number of turns to [0,1]. Finally, the regression model is established and the regression prediction results are shown in Figure 4.

Regression model of friction torque of domestic materials.
From Figure 4, we can obtain the following:
First, we calculate the fitting accuracy of the forward stroke regression and then use the mean square error (MSE) to express it. Its value is 0.0395. Then, x = 1 is predicted when the rotating number is 10 million. The measured value of friction torque forward stroke attenuates to 0.587 Nm, while the model predictive value is 0.6242 Nm. It can be seen that SVM has a high precision in which the relative error is only 0.0634.
The MSE of the backward stroke regression accuracy is 0.0032. After 10 million turns, the measured value of friction torque is 0.566 Nm and the predicted value is 0.5917, in which the relative error is 0.0454.
Compared with the above results, we can find that the accuracy of the forward stroke regression fitting is low, that is, the situation of less fitting. In regression modeling of data with certain characteristics, due to the lack of feature items, the result will not fit. At this time, we need to add a feature item or increase the sample to improve the accuracy of fitting; compared with forward stroke, the backward stroke has good regression fitting and prediction precision. Therefore, SVM has the advantage in regression analysis of small samples and nonlinear data.
Established regression modeling of imported materials and regression prediction results are shown in Figure 5.

Regression model of friction torque of imported materials.
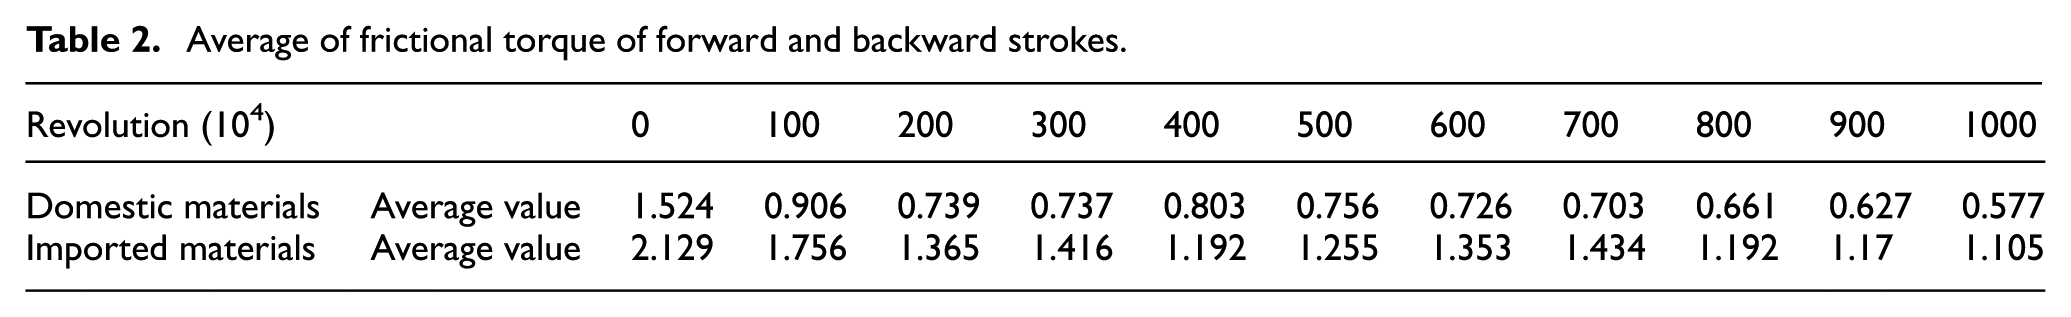
In order to analyze the change of friction torque under different materials, the average value of the frictional torque of the forward and backward strokes of different materials is analyzed. The average frictional torque of the forward and backward strokes is shown in Table 2.
Average of frictional torque of forward and backward strokes.
The model and results are shown in Figure 6.
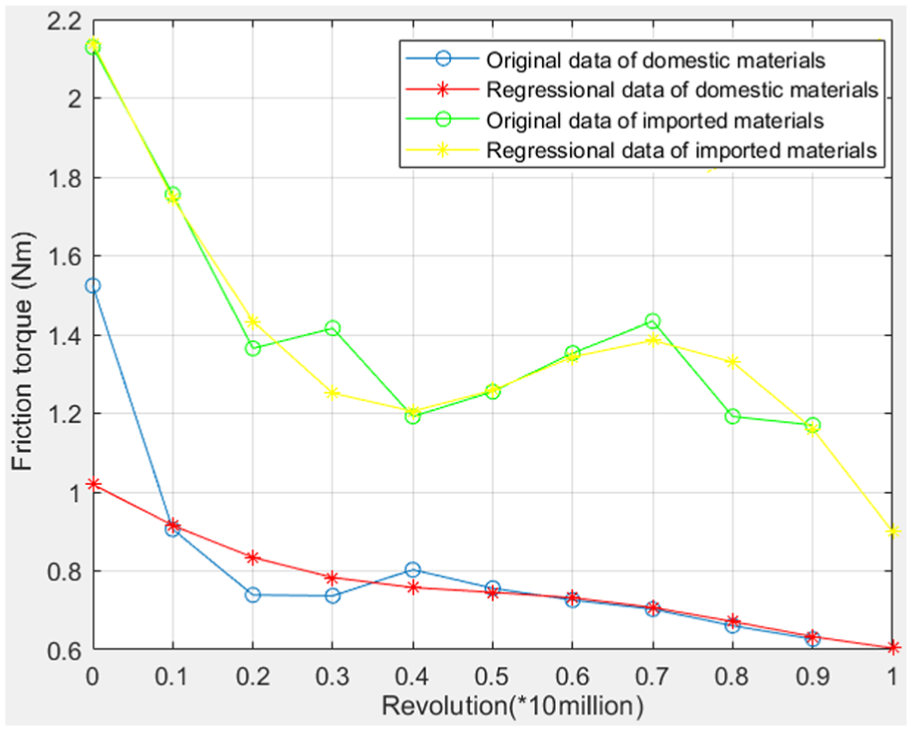
Mean value of frictional value of forward and backward strokes for two materials.
According to the test data and curves, the relationship between friction value and preload can be concluded as follows:
After 10 million turns, the preload of domestic material screws decreases by more than 60% compared with the beginning and the preload of imported material drops by less than 50%.
During 1 million turns of the domestic material, the loss of preload is very obvious and has lost about 40%. The wear resistance of imported materials is obviously better. During the first 1 million turns, the loss of preload is only less than 20% and the loss of 2 million turns preload is only about 36%.
After 2 million turns, the preload of two kinds of materials has both entered a stable trend with a slight decline.
Multivariable regression and prediction of preload attenuation
Variation of the temperature of screws with time
The temperature of ball screws will also change with the work. The FYC2D-4010-5 P1 ball screw produced by a domestic manufacturer is still used here. The screw runs 10 million turns at 1000 r/min speed and the friction torque is measured at the end of every 1 million turns. The temperature rise of the screw is recorded. In order to ensure good lubrication conditions, add the same amount of grease every 1 million turns. The temperature rise changes as shown in Table 3.
Calculation results of temperature rise of lead screw.

After a certain number of turns, the ball screw pair is measured for the frictional torque of the forward and backward strokes. The frictional torque of the ball screw pair after the same number of turns has some relation. Combining the data above measured by the temperature test, we normalize the data of temperature rise. Combined with Table 3, the results are shown in Figure 7.

Variation of each variable.
From Figure 7, it is found that the frictional torque of the forward and backward strokes loses fast at the start of 2 million turns, and then the trend of smooth and slight decline is followed. The measured temperature rise curve coincides well with the variation trend of friction torque, which proves that temperature rise is closely related to friction torque in the case of no external load. Therefore, we can establish a new sample set for the frictional torque of forward stroke and the temperature rise to predict the friction torque of the backward stroke.
Multivariable regression prediction
By combining the temperature rise and the friction torque of forward stroke, it can be used as a reference for the regression prediction of the friction torque of backward stroke. At first, we should create a new sample set. X = (x1, x2), where X1 represents the temperature rise and X2 represents the friction torque of forward stroke. Y represents the friction torque of backward stroke.
After the normalization of the sample set, the regression modeling is done, as shown in Figure 8.

Multivariable regression prediction.
By observing Figure 8, we can find that the regression model fits well with the measured values, with a MSE of 0.0001. The result of x = (18.5, 0.587) is 0.5897, and the measured value is 0.566, in which the relative error is 0.0417. To further compare the advantages of multivariate and univariate regression prediction, the analysis is made in Table 4.
Comparison of regression accuracy for each model.

The following conclusions can be obtained from Table 4:
The regression predictions of friction torque of forward and backward strokes both have high accuracy, and the multivariable regression is more accurate than the single variable.
Because the working speed is constant, the essence of changing the parameter of the revolutions is to change the time parameter, that is, the preload of ball screw pair varies with time. At this time, with the increase in the working time of the ball screw, the parameters such as temperature rise and stiffness of the ball screws will change. At this time, it seems unsuitable to predict its result purely with a single variable. Multivariate prediction is effective for this condition. Because a number of variables will change with time, to establish the model using several variables will make the result better. Therefore, in the establishment of regression model of the preload of ball screws, we should take advantage of single variable or multiple variables; in case of specific circumstances, multivariable SVM takes into account the mutual influence and restriction of multiple variables. It gets rid of many adverse effects and will obtain more accurate prediction results. 8
Regression and prediction of preload attenuation under different lubrication conditions
Ball screw is bound to cause the change of friction torque in different lubricating grease states, and then the preload is changed. Therefore, by establishing the regression model of friction torque and lubrication, the preload is forecasted. The experiment is conducted using the 5005 double-nut gasket ball screws. Fill the grease, record the amount of grease it needs, divide it, and determine the amount of each raise. The test bench sets the rotational speed to 10 r/min. Table 5 shows the measured value of the frictional torque.
Friction torque values at different grease levels.

It can be found that there is a certain nonlinear relationship between the friction torque and the lubricating grease, and it has the characteristic of small sample. It is suitable for SVM to establish the model. A regression model for the maximum value of grease content and friction torque is established, as shown in Figure 9.

Regression model of friction torque maximum and oil content.
First, the regression fitting accuracy of friction torque and grease content are calculated. The MSE is used to indicate the value of the regression. Its value is 0.0075. Then, the oil content of 24 g is substituted into the model, and the predicted value is 0.6233 Nm. The measured value is 0.621, and the relative error is only 0.0037. It can be found that this prediction has very high prediction accuracy. The model is used to predict the change of friction torque with the increase in grease content, as shown in Figure 10.
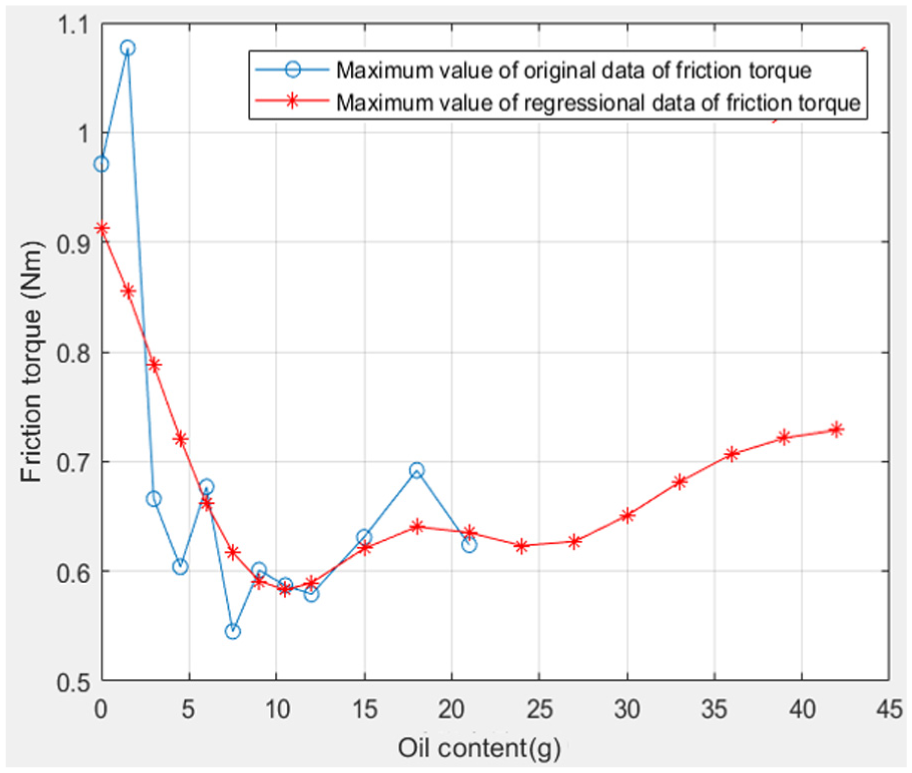
Prediction of maximum friction torque.
In Figure 10, we can find the prediction trend of the model for the second half of the friction torque maximum. The maximum value of friction torque first decreases slightly and then gradually increases and tends to a balance. The reason for the increase in friction torque is that after excessive lubricating oil, the viscosity is too large, which leads to the increase in the friction torque between the ball and the ball and between the ball and the raceway in the movement process. Then, it will lead to the increase in the friction torque. The lowest point of the concave is the proper amount of lubrication when it can produce a thin film between the contact surfaces, resulting in a reduction in the friction torque. Through the regression prediction analysis of friction torque, we can further understand the change of preload force with grease content. 19
Then, we have a try on the study of multivariable regression prediction. In this section, the maximum value of friction torque will be predicted by the minimum value of friction torque, mean, and oil content as multivariable. At first, a sample set containing minimum value, mean value, and oil content is established, and a set of corresponding maximum friction torque is established. For example, X = (x1, x2, x3), where x1 represents the oil content, x2 represents the minimum value, and x3 represents the maximum value. Then, Y means the set of maximum value. After setting up the sample set, the kernel function parameters are optimized and a regression model is established, as shown in Figure 11.

Multivariable regression prediction of maximum friction torque.
Multivariate regression modeling is performed. The MSE of regression fitting is 0.00699. The predicted maximum value of friction moment is 0.6222 Nm. Compare the measured data, univariate, and multivariate regression prediction values. The result is shown in Table 6.
Comparison of univariate and multivariate regression predictions.

Among them, the measured values of the 13 groups are 0.6210 Nm. By comparison, it can be found that multivariable regression prediction is better than single variable in both regression accuracy and prediction accuracy.
Conclusion
In this article, through the study of the preload attenuation test of ball screw of different materials, it is found that one of the important differences between the quality of ball screw at home and abroad comes from preload attenuation, which sets the optimization direction for the domestic ball screw pair.
This article proves the feasibility of prediction of preload attenuation of ball screw by modeling the regression of frictional moment, which solves the difficult problem that the preload cannot be easily measured due to the difficulty of measuring method and large amount of data. Through the study of preload attenuation, we can acquire more data of preload and changing trends in the process of work, which has a great engineering meaning for improving the precision of ball screw.
When the parameter of temperature rise is considered into multivariable regression modeling, we can conclude that there is a better accuracy both in prediction and regression. Because the working condition of ball screw is more complex in the actual work and the factors that affect the change of the friction torque are generally more, the multivariable prediction of the change of the friction torque often has a higher precision.
Because of the constant speed of friction, the relationship between friction torque and revolution can be understood as the change of friction torque with time. Therefore, in the later research, we can combine time series forecasting method with multivariate regression to further improve the accuracy of regression prediction.
Footnotes
Handling Editor: Zengtao Chen
Declaration of conflicting interests
The author(s) declared no potential conflicts of interest with respect to the research, authorship, and/or publication of this article.
Funding
The author(s) disclosed receipt of the following financial support for the research, authorship, and/or publication of this article: This paper was supported by the National Science and Technology Major Project (research and capacity building of functional component test): 2016ZX04004007.