
Abstract
Slug rivet interference-fit riveting is one of the advanced connection technologies which has been widely applied in aerospace manufacture. This article presents an appropriate numerical model simulating the slug rivet upset process with countersunk hole structure. Many previous studies have focused on the riveted lap joints without countersunk hole structure and ignored its related process parameters. The main difference is that the hole expansion would be inhomogeneous through the thickness direction due to the impact of countersunk hole. To improve the riveting quality and reduce the inhomogeneity scale of the interference distribution, the effects of two procedure parameters have been assessed. The analysis results significantly improve knowledge about the slug rivet installation process as well as the effects of the corresponding process parameters. The study will pave the way for further investigations.
Introduction
Modern aerospace manufacture has employed numerous advanced connection technologies to evolve the assembly quality to a higher level with the requirement of long fatigue life, good sealing performance, and high corrosion resistance. 1 Slug rivet interference-fit riveting is one of the advanced connection methods, which can significantly enhance the fatigue life of riveted aircraft structures with good sealing performance. 2 The slug rivet interference-fit riveting technology has been widely used in the field of wing panel assembly.3–5
Figure 1 presents the structures mainly applied in slug rivet connections. The structure of Type 1 is without countersunk hole. While the structure of Type 2 contains the countersunk hole at the upper sheet. Nowadays, many research institutions and scholars have focused on the rivet structure of Type 16–12 since the installation process is more complex with countersunk hole structure. The slug rivet should be upset by automatic drilling and riveting machine. This article presents a numerical model simulating the slug rivet upset process with countersunk hole structure. The study is conducted based on the automatic drill-rivet machine developed by Zhejiang University. The aim is to develop an appropriate model and provide a deeper understanding of the slug rivet installation process.

The connection structures of slug rivet assembly: (a) Type 1 and (b) Type 2.
Moreover, riveting is a particularly sensitive case. There are numerous riveting parameters associated with a riveting process. Incorrect selection of these parameters would seriously affect the riveting quality of a connection. 13 For both of the slug rivet connection structures, the former study has assessed the impacts of riveting parameters on the riveting quality of a slug rivet assembly based on the structure of Type 1. 14 The riveting parameters include squeezing force, clamping force, rivet structure, countersunk hole structure, hole diameter, and sheet thickness. However, because of the countersunk hole structure, the hole expansion and the corresponding interference distribution through the thickness direction will be inhomogeneous. The resulting residual stress state surrounding the countersunk hole will be worse as well. To ensure the riveting quality, two more procedure parameters, movement synchronism of the riveting dies and rivet protruding height, should be taken into account during the rivet installation process.
The other emphasis of this article is to study the effects of the two procedure parameters on the riveting quality of a slug rivet assembly. This article is a further study on improving riveting quality with appropriate riveting parameters. The results improve knowledge about the riveting process and the influences of the procedure parameters.
Baseline model
The series of NAS1321 slug rivet has been employed in the wing panel assembly for ARJ-21 regional jet. Statistics shows that the slug rivet accounts for more than 80% of the riveting work during the wing panel manufacturing process of the ARJ-21 regional jet. 15 Figure 2 presents the actual application of the series of NAS1321 slug rivet for ARJ-21 regional jet wing panel assembly.

The application of slug rivet for wing panel assembly.
Experimental work
The NAS1321AD6E10 slug rivet is adopted in this article. Figure 3 illustrates the rivet structure. The geometric dimensions of the connection can be found in Table 1. The protrusion heights at both sizes are equal, PU = PL. The specimen is 2024T3 Al alloy sheet. The riveting edge and rivet pitch are all larger than 25 mm.16,17
The structural sketch of the riveted lap joint.
The geometric parameters of the riveted lap joint (unit: mm).

The experiments are conducted on the automatic drilling and riveting machine developed by Zhejiang University as illustrated in Figure 4(a). Figure 4(b) presents the automatic drilling and riveting operations. Five rivets are installed. The squeezing force and the clamping force are 38,000 and 500 N, respectively, according to the quality requirements. 16 The automatic drill-rivet machine can provide accurate squeezing force and displacement measurements.

The automatic drilling and riveting machine and its experimental process: (a) the automatic drill–rivet machine and (b) drilling and riveting operation.
Numerical study
A two-dimensional axisymmetric finite element model is built as the baseline model to simulate the riveting process. The force-controlled rivet installation and explicit solution are employed since force-controlled rivet squeezing gives a much more accurate quality control and a more uniform fatigue performance (Figure 5).17,18

The FE model with mesh and boundary conditions.
The FE model consists of NAS1321AD6E10 slug rivet, upper and lower riveting dies, upper and lower pressure feet and upper and lower sheets. The dimensions of the sheets are 50 × 50 × 3 mm3. The clearance between the hole wall and rivet shank is 0.15 mm. Material parameters for the 2117T4 Al alloy slug rivet and 2024T3 Al alloy sheet are summarized in Tables 2 and 3, where ε is the true strain, σ is the true stress, and C and m are obtained by substituting the data of tensile tests into equation (1)

Material properties for 2117T4 Al alloy slug rivet. 19
Material properties for 2024-T3 Al alloy sheet. 19

The FE model is generated using ABAQUS 6.14 with CAX4R reduced integration four-node axisymmetric elements. Three deformable bodies, two sheets and a rivet, are defined in the model. While the riveting dies and pressure feet are defined as rigid bodies. The geometric and surface interaction nonlinearities are included. Surface interactions are defined as contact pairs using the master–slave algorithm. The model includes contacts between the rivet and sheets, the pressure feet and sheets, the riveting dies and rivet, and between the faying surfaces of the upper and lower sheets. The contact interaction is modeled with the Coulomb friction model. A friction coefficient of 0.2 is specified for all interactions. The NLGEOM option is selected, which means a geometric non-linear analysis.
A typical mesh generation technology is applied. Mesh size of slug rivet is 0.06 mm. For the upper and lower sheets, mesh size of the area in the vicinity of rivet hole is 0.08 mm, and mesh size of the region far from rivet hole is 1.2 mm. The sheet surfaces on the far end are constrained in X-direction with the Y-direction nodes constrained at the top and bottom to prevent the sheets’ motion. All degrees of freedom of the upper and lower riveting dies and pressure feet are constrained, except the Y-direction. The riveting forces of 38,000 N are applied at the upper and lower riveting. The clamping forces of 500 N are applied at pressure feet.
The riveting process is simulated in two steps. Step 1 is a loading step. Step 2 is an unloading step. The period of each step is 1 ms, which is appropriate to obtain the quasi-static solution and achieve computational efficiency. 20
Model verification
Energetic analysis
Blanchot and Daidie 21 proposed an essential criterion to validate the numerical simulation: for good calculation, the hourglass energy must not exceed 10% of the internal energy at the end of simulation. The energy ratio is presented in Figure 6. Data are obtained from the history energy output of the FE model. As can be seen, the ratio is less than 7% at the beginning of the simulation. Then, the value falls dramatically and remains under 0.1% during the whole simulation period. A good simulation result is achieved.

The ratio of hourglass energy and internal energy.
Interference comparison
Interference level is considered as the main quality control criterion for riveted assembly.16,17 Figure 7 shows the comparison of the interference condition after riveting process. The experimental data are obtained by measuring the radial expansion of the slug rivet, which had been taken out from the riveted lap joint by milling since the rivet wall and slug rivet tightly fit with each other.
Interference comparison between experiment and simulation.
As can be seen, there is a small gap between FE and experiment results. The difference is caused by measurement error, material property error, and experimental error. But the variation trends and the value of the two curves are approximately consistent with each other. Because of the countersunk hole, the interference level at the upper sheet is less than the lower sheet. But the difference between the experiment and simulation is small. The comparison between the numerical results and experimental measurements is satisfactory in terms of interference condition.
Deformation comparison
The driven head dimension is usually considered as the other quality control criterion for riveted lap joints.13,17,20,22 Figure 8 presents the deformations obtained from the experiment and numerical results. Figure 8(a) and (b) shows the upper and lower side of the specimen. Five rivets were installed. The shape of the driven head obtained from the FE model is consistent with the experiment. The shapes of the driven heads obtained from the specimen and the simulation result (Figure 8(c)) remain the same.

The deformations of experimental specimen and simulation: (a) upper side of the specimen, (b) lower side of the specimen, and (c) simulation prediction.
The permissible minimum diameter and height of the driven head are 6.198 and 1.346 mm, respectively. 16 Table 4 lists the driven head dimensions obtained from experiments and numerical results. All of the driven heads meet the minimum dimensional requirement. The numerical results agree with the experimental measurements. Moreover, the diameter ratio between the driven head and the slug rivet is also considered as the criterion to evaluate the riveting quality. The difference in the diameter ratio between experiment and simulation is small as well. The FE model can provide reasonable rivet deformations.
Driven head dimension comparison.

D is the diameter of driven head and d is the diameter of slug rivet.
The energy analysis demonstrates the effectiveness of the simulation. The comparisons of interference condition and rivet deformation prove that the FE model can simulate the slug rivet upset process reasonably and provide accurate numerical results. The FE modeling technology and verification methods have been applied in Lei et al. 14
Effects of procedure parameters
The previous analysis is conducted to assess the performances of the riveting parameters. 14 As shown in Figure 8, the interference value at the upper sheet is relatively lower due to the countersunk hole structure. To ensure the riveting quality and make the interference distribution more homogeneous, another two process parameters are included in the riveting process. This article focus on the effects of the two parameters on the riveting quality of a slug rivet assembly.
Deformation analysis
Figure 9 presents the deformation process of a slug rivet installation process. For a traditional riveting process, the upper riveting die and lower riveting die will begin to squeeze the slug rivet synchronously during the rivet installation process.

The deformation of riveting process: (a) 0 s, (b) 0.0003 s, (c) 0.0004 s, (d) 0.00065 s, (e) 0.001 s, and (f) 0.002 s.
The diameter of the whole rivet shank becomes larger under the effect of the squeezing force. At 0.0003 s, the slug rivet contacts with the hole wall. Then, an increase in the applied squeezing force gradually leads to the rivet-hole expansion. But, due to the countersunk hole at the upper sheet, the material flow of slug rivet at the upper side will fill the countersunk hole first. While the driven head begins to form and keeps increasing at the lower side. The expansion of the hole wall at the upper and lower sheets will be inhomogeneous. The resulting interference level and the corresponding compressive stress conditions at the upper and lower sheets will be unequal.
Figure 9(c) shows the compressive stress contours during the riveting process. The area of the stress field and the amplitude of the compressive stress at the lower sheet are larger than the condition at the upper sheet. Figure 9(c)–(e) presents the deformation process of the driven head at the upper side when the countersunk hole has been filled. After the unloading step (Figure 9(f)), the compressive stress contours are inhomogeneous between the upper and lower sheets. The related eventual interference level at the lower sheet is better than the upper sheet. Therefore, the countersunk hole structure seriously impacts the riveting quality of a slug rivet assembly.
If the countersunk hole can be filled first, the expansion of hole wall at the upper and lower sheets would be more symmetrical. A more homogeneous interference distribution can be achieved. The interference level at the countersunk hole can be improved. Since the interference level is an indicator of the riveting quality, the approach can improve the riveting quality of a slug rivet assembly with countersunk hole structure.
In addition, earlier researches indicate that the failure of a rivet connection is mainly caused by the combination of three factors: rivet installation–induced stresses, thermal fatigue, and vibration.13,22 Since the thermal fatigue and vibration are difficult to control during a flight. Improving the residual stress state is important to enhance the performance of a slug rivet assembly. If the countersunk hole can be filled first, a larger hole expansion will be achieved at the region. A consequent increase in compressive stress for both radial and hoop stresses would be observed as well. The residual stress is closely related to the fatigue behavior of a riveted lap joint. 23 With the effect of compressive hoop stress, the fatigue performance can be improved by retarding crack growth near the hole wall. 20 Therefore, filling the countersunk hole first is good for the fatigue life of the slug rivet assembly.
Synchronism of the riveting dies
The countersunk hole can be filled first by controlling the squeezing movement synchronism of the upper and lower riveting dies. And then, the interference distribution may be improved. The motion control strategy of the riveting dies can be divided into two parts:
Upper riveting die starts first. The upper riveting die starts moving first. While the lower riveting die remains still at the beginning of riveting. After a while, the lower riveting die begins to squeeze the rivet at a higher speed. The upper and lower riveting dies finish the motion at the same time.
Upper riveting die finishes first. The upper and lower riveting dies start to squeeze the rivet simultaneously. The upper riveting die completes the motion in advance. Then, the upper riveting die keeps still until the lower riveting die finishes the motion.
Upper riveting die starts first
In this section, the upper riveting die starts moving at the normal speed. A short time later, the lower riveting die begins to move at a higher speed. Table 5 gives out the timetable of the upper and lower riveting dies. The duration of each analysis step is 1 ms. In Table 5, baseline is the normal speed which is also used in the baseline model. L-01 means the lower riveting die starts moving 0.1 ms later than the upper riveting die.
Movement time of the riveting dies (unit: ms).

Figure 10 shows the relationship between the completion condition of the squeezing movement and the analysis time. In Figure 10, baseline stands for the normal squeezing speed of the upper riveting die. L-01 to L-05 represent the higher squeezing speed of the lower riveting die in different cases. The start time of the upper and lower riveting dies is different. But the finish time of these riveting dies remains the same.

The completion condition of the squeezing movement for upper riveting die starts first.
Figure 11 presents the interference level and distribution conditions obtained from different cases. The baseline curve is the interference condition gained from the baseline model. Obviously, the fluctuations of distribution curves gradually become greater when the difference of start time between the lower and upper riveting dies are getting larger.

The interference level and distribution conditions.
For the case of L-01, the magnitude of the interference level and the variation trend of the distribution curve approximately remain the same with baseline model. However, for the case of L-05, the situation is totally different. The interference value at the hole edge of the lower sheet becomes larger when the difference of start time becomes larger. But the interference value at the hole edge of the upper sheet is smaller under the same condition. The total interference value of the upper sheet is smaller as well. The fluctuation at the interface between the two sheets is becoming more significant. All the distribution curves fluctuate at the junction of rivet-hole wall and countersunk hole.
Therefore, the case of upper riveting die starts first is undesired. The interference condition may be even worse under the effect of this control strategy.
Upper riveting die finishes first
In this section, the lower riveting die moves at the normal speed. While the upper riveting die moves at a higher speed and finishes moving in advance. Table 6 gives out the timetable. In Table 6, baseline is the normal speed. U-05 means the upper riveting die starts the movement and finishes moving 0.5 ms later. Then, the upper riveting die stays still until the analysis time achieves 1 ms.
Movement time of the riveting dies (unit: ms).
Figure 12 illustrates the relationship between the completion condition of the squeezing movement and the analysis time. The baseline stands for the normal squeezing speed of the lower riveting die. U-05 to U-09 represent the higher squeezing speed of the upper riveting die in different cases. The start time of the upper and lower riveting dies remain the same. But the finish time of these riveting dies are entirely different.
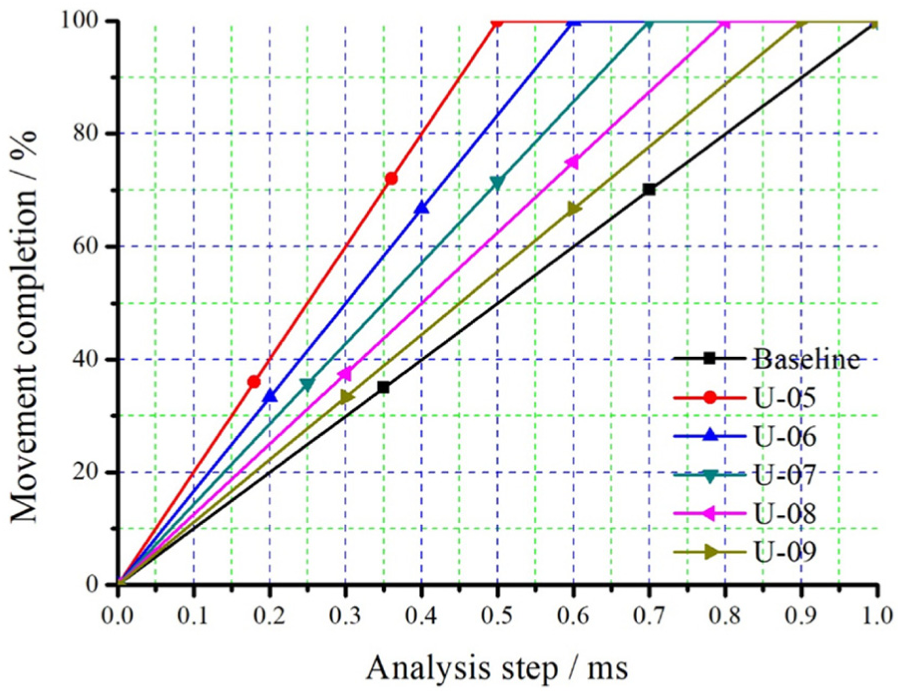
The completion condition of the squeezing movement for upper riveting die finishes first.
Figure 13 presents the interference level and distribution conditions obtained from different cases. The baseline curve is the interference condition gained from baseline model. The inhomogeneity scale of the interference distribution is much smaller compared with the situation of upper riveting die that starts first. All the interference value is larger than the baseline model except the case of U-09. And all the distribution curves fluctuate at the junction of rivet-hole wall and countersunk hole.

The interference level and distribution conditions.
The interference level and the variation trends of the distribution curves vary from different timetables. Among different cases, the interference condition of U-09 is the nearest to baseline model. Then, the magnitudes of the interference level gradually become larger when the upper die moves faster. The motion period is getting shorter from U-09 to U-05 as shown in Figure 12.
However, the effect of continuing reducing the motion period of the upper riveting die is limited. For the cases from U-08 to U-05, the magnitudes of the interference level and the variation trends of the distribution curves almost stay the same with each other. But the inhomogeneity scale of the interference distribution becomes even worse when the upper riveting die moves at a higher speed. The fluctuation at the interface between the two sheets is becoming greater.
The effects of upper riveting dies that finish first on the riveting quality of a slug rivet assembly are remarkable. An appropriate timetable for the upper and lower riveting dies can improve the interference value and make the interference distribution more homogeneous.
For riveted lap joints, a higher interference level means a tighter connection between the slug rivet and hole wall. A better distribution condition means a more homogeneous deformation along the hole wall. As a result, larger residual compressive stresses will be achieved. Figure 14 presents the contours of residual radial stresses obtained from different cases. The residual radial stress is an indicator of the residual interference between slug rivet and hole wall. The magnitudes of the compressive stresses increase with the interference level. In Figure 14, all the maximum residual radial stresses obtained from the situations of upper riveting dies that finish first (U-05 to U-09) are larger than the baseline model. The variation trends of the contours gained from different cases are in accord with the interference distribution presented in Figure 13. The interference value of U-08 reaches a relatively homogeneous distribution. The resulting contour of residual radial stress realizes an approximately symmetric distribution. While the distribution conditions in other cases are asymmetrical.

The residual radial stresses after riveting process: (a) baseline, (b) U-05, (c) U-06, (d) U-07, (e) U-08, and (f) U-09.
The residual hoop stress has a significant effect on the fatigue performance of a riveted lap joint. The fatigue strength of rivet hole can be enhanced by creating compressive residual hoop stress around the hole 24 since the compressive residual hoop stress in the vicinity of rivet hole can reduce the tendency for fatigue cracks to initiate and propagate. 25 Figure 15 presents the contours of residual hoop stresses. The compressive stress zones are balanced by the tensile stress zones away from the hole edge, while the tensile hoop stress is critical for fatigue cracks initiation at the faying surface. 20 A desired rivet connection will push the tensile stress zone from the hole edge as far as possible.

The residual hoop stresses after riveting process: (a) baseline, (b) U-05, (c) U-06, (d) U-07, (e) U-08, and (f) U-09.
Furthermore, the magnitudes of the compressive residual stresses vary through the thickness direction in Figure 14. A uniform hole expansion along the hole wall will observably improve the residual stress condition. In Figure 13, the interference distribution resulted from the case of U-08 is the most homogeneous. Consequently, the contour of residual hoop stress in Figure 15(e) almost reaches a totally symmetrical distribution. The maximum residual stress of U-08 is also larger than other cases. Therefore, the case of U-08 is the optimum selection for the situation of upper riveting die that finishes first.
Protruding height of the rivet
As shown in Figure 3, the protruding heights PU and PL are other procedure parameters analyzed in this article. The riveting deformation process can be controlled by adjusting the protruding height. The material flow of slug rivet can not only fill the countersunk hole but also press the hole wall. If the rivet volume at the upper side becomes larger, the expansion of the hole wall at countersunk hole may be larger. The inhomogeneous scale of interference distribution can be improved with the effect of excess material flow.
Normally, the protruding heights PU and PL are equal to 4.94 mm. The rivet length and sheet thickness are 15.88 and 6 mm, respectively. According to process manual, the variation range of the protruding height is
Figure 16 illustrates the average interference value obtained from the cases of different protruding height PU. The total average interference value exists between the average data obtained from the upper and lower sheets. Obviously, because of the countersunk hole, the average interference value of the upper sheet is smaller than the value gained from the lower sheet. Especially, when the protruding height PU is small. The consequent difference of average interference value between the upper and lower sheets is distinct. But the gap becomes much smaller when the protruding height PU increases.

The average interference value obtained from different protruding heights.
The reason is that the volume of material flow gradually becomes bigger when the protruding height PU becomes larger. More material flow can fill the countersunk hole and press the hole wall. Then, the interference condition at the upper sheet can be improved. While the fluctuation of interference level at the lower sheet is relatively small during the variation of protruding height PU, the change in the gap of average interference value between the upper and lower sheets is significant. The total average interference level increases with the increase in protruding height PU. The total average interference value achieves the maximum value when PU = 5.74 mm.
Figure 17 presents the interference distribution conditions obtained from the cases of different protruding height PU. The baseline curve is gained from the baseline model. The protruding height PU in the baseline model is 4.94 mm. Obviously, except the region in the vicinity of countersunk hole, the interference value and the variation trends of the distribution curves almost remain consistent.

The interference distribution conditions obtained from different protruding heights.
It is clear that the influence of countersunk hole on the improvement of riveting quality is insignificant when the protruding height PU increases. The consequent distribution conditions are more homogeneous. The distribution condition achieves the optimum state when PU is within
Clearly, the effect of protruding height mainly acts on the countersunk hole area. The interference condition in other parts of the rivet hole is seldom influenced by the process parameter. Therefore, the adjustment of protruding height is an effective means for the improvement of riveting quality.
Figure 18 presents the contours of residual radial stresses obtained from different cases. The slug rivet and the upper sheet will have a tighter connection with the increase in protruding height PU. As a result, the contour of residual radial stress gradually achieves a more symmetrical distribution. The difference in the interference value between the upper and lower sheet reaches the minimum scale when the protruding height PU is 5.94 mm as shown in Figure 16. The corresponding interference distribution in Figure 17 almost realizes a symmetrical distribution. The resulting contours of residual radial stresses in the upper and lower sheets are approximately consistent with each other as shown in Figure 18(e). The total average interference value achieves the maximum value when the protruding height PU is 5.74 mm. The corresponding maximum residual radial stress is the largest. Figure 18(f) illustrates the contours of residual radial stresses. The stress distribution conditions are similar between the upper and lower sheets.

The residual radial stresses after riveting process: (a) PU = 3.94 mm, (b) PU = 4.44 mm, (c) baseline (PU = 4.94 mm), (d) PU = 5.44 mm, (e) PU = 5.94 mm, and (f) PU = 5.74 mm.
Figure 19 presents the contours of residual hoop stresses. Similar conclusion can be drawn that the compressive stress zones are balanced by the tensile stress zones. Generally, the contours of residual hoop stresses display a dependence on the interference condition. When the protruding height PU is small, the residual hoop stress is relatively small. The residual stress state is improved with the increase in protruding height PU. The maximum residual hoop stress in Figure 19(e) (PU = 5.94 mm) is a little smaller than the baseline model (PU = 4.94 mm). But the high stress area surrounding the hole wall is larger than the baseline model. The residual hoop stress achieves the maximum value when the protruding height PU is 5.74 mm. However, as shown in Figure 16, the inhomogeneous scale of interference distribution is greater when PU is 5.74 mm compared with the case when PU is 5.94 mm. An unsymmetrical distribution appears in the resulting contours of residual hoop stresses.

The residual hoop stresses after riveting process: (a) PU = 3.94 mm, (b) PU = 4.44 mm, (c) baseline (PU = 4.94 mm), (d) PU = 5.44 mm, (e) PU = 5.94 mm, and (f) PU = 5.74 mm.
Overall, the case of PU = 5.74 mm is better than other cases since the compressive hoop stress has a remarkable effect on improving the fatigue performance of a slug rivet assembly. A homogeneous expansion along the hole wall can realize a uniform fatigue life through the thickness direction. The condition of residual radial stress in the case of PU = 5.74 mm is much better than baseline model.
Conclusion and perspectives
This article presents numerical studies of slug rivet assembly with countersunk hole structure. A finite element model of force-controlled rivet installation process has been built and verified with a series of well-characterized experiments. To ensure the riveting quality, two unique procedure parameters are analyzed in this article due to the countersunk hole structure. The FE model has established a relationship between these parameters and the essence of riveting quality.
The control strategy of the synchronous movement of riveting dies significantly affects the riveting quality. However, the riveting quality may even become worse under the effects of the case “upper riveting die starts first.” The results of the case “upper riveting die finishes first” are somewhat better. But, compared with the other procedure parameter, protruding height of the rivet, the effects of riveting die synchronous movement are limited.
Moreover, the effect of protruding height on the decrement of interference distribution inhomogeneity is remarkable. The interference value becomes larger with the appropriate protruding height. The riveting quality achieves the optimum state when PU is within
This study is complementary with the earlier research without countersunk hole structure. 14 The analysis results deepen the understanding of slug rivet installation process with and without countersunk hole structure. The knowledge about the performance of process parameters has been enhanced as well. The next phase of the study further investigates the combined action of these two procedure parameters.
But the studies still have certain limitations. This article and the previous published paper mainly focus on the effects of procedure parameters on the riveting quality of a slug rivet assembly. In order to find out the optimum parameter combination, the final objective is to conduct parameter optimization with parameterized models since the parameterized model is good at doing sensitivity studies for identifying the best process parameters.
Footnotes
Handling Editor: Shun-Peng Zhu
Declaration of conflicting interests
The author(s) declared no potential conflicts of interest with respect to the research, authorship, and/or publication of this article.
Funding
The author(s) disclosed receipt of the following financial support for the research, authorship, and/or publication of this article: The work described in this paper has been supported by grants from National Natural Science Foundation of China (No. 51775495) and Youth Funds of the State Key Laboratory of Fluid Power and Mechatronic Systems (Zhejiang University; No. SKLoFP_QN_1802).