
Abstract
The dynamic compaction method is effective to reinforce soft soil foundation with a low degree of saturation. However, deep soft soil foundation with high degree of saturation has some different characteristics. It has been widely considered that dynamic compaction method is unsuitable to improve the characters of deep soft soil foundation with high degree of saturation. In this article, we will show that the dynamic compaction method with vacuum well-point dewatering is effective to deep soft soil foundation with high degree of saturation reinforcement. In situ and laboratorial experiments are used to assess the reinforcement effect of the deep soft soil foundation with high degree of saturation. Our results show that the dynamic compaction method causes long dissipation time of pore water pressure, and the dynamic compaction method with vacuum well-point dewatering makes construction time of a project 25% shorter. The effective depth of deep soft soil foundation with high degree of saturation reinforcement using the two experimental methods can reach to 8.0 m. In comparison with the total settlement and layered settlement of the dynamic compaction method with vacuum well-point dewatering, the dynamic compaction method settlement is relatively smaller. For soils with depth of 4 m, the reinforcement effect of dynamic compaction method with vacuum well-point dewatering is obviously superior to dynamic compaction method. Based on these results, we suggest construction procedures for different reinforcement depth of soils and construction time.
Introduction
The dynamic compaction method (DCM) is effective in reinforcement of soft soil foundations. This relies on rearranging the soil structure to improve its strength.1–3 DCM has some special requirements for different types of soils. Generally, it can be applied to gravelly soil, sandy soil, unsaturated silt, clay with low degree of saturation, collapsible loess, miscellaneous, plain fill, and dredged soil.4–9 It is also effective to deep soft soil foundation with high degree of saturation (DSSF_HDS) when combined with auxiliary treatment measures, such as soil replacement and dewatering. For unsaturated silt and cohesive soil with high degree of saturation, reinforcement practice depends on experience and general guidelines are not yet established.
At present, many works conducted by researchers demonstrate that the DCM has many advantages. It involves a simple device, easy to operate, low investment, and significant effect. Therefore, it is widely used in engineering projects.10–13 For DSSF_HDS, backfilling stone, crushed stone, or coarse granular materials are usually selected as cushion layers to improve the reinforcement effect. However, engineering practices prove that the reinforcement effect of soil foundation using DCM alone is very poor. Researchers began to study the DCM reinforcement of soft soil foundation using some auxiliary measures.14–18 Despite these efforts, many problems still exist to reinforce DSSF_HDS using DCM. In the past, people mainly focus on principle and effect of the DCM.19–24 Now, researchers have shifted their attention to DCM technologies. There are little research done on reinforcement effects and mechanisms of the DSSF_HDS using dynamic compaction method with vacuum well-point dewatering (DCM_VWD). The study of the DSSF_HDS reinforcement depends on quality detection of DSSF_HDS by an experienced field technician. For DSSF_HDS, quality detection should be carried out after the experiments of dynamic compaction and the excess pore water pressure (PWP) dissipated completely. Due to limitation of construction time, quality detection needs to be carried out immediately after the experiments of dynamic compaction. To evaluate the improvements of DSSF_HDS reinforced by DCM and DCM_VWD, we select the adjacent experimental zones with similar geological conditions to conduct various field experiments. Both field and laboratory experiments including cone penetration test (CPT), PWP, vane shear test (VST), and physical-mechanical parameter test are carried out.
Field experiment methods and procedures
Geological conditions of field experiment zones
Geological conditions of the field experiment zone are shown in Figure 1. Here is a description of the major units. ① Fill: main cohesive soil with a small amount of loose gravel; ② Mud: organic matter and humus with saturated and fluidal plastic state; ③ Silty clay: iron oxide spots and ferromanganese nodules with moderate strength; ④ Muddy silty clay: mica, organic matter, and thin fine sand with moderate strength and fluidal plastic state; ⑤ Silty clay: mica, organic matter, and thin clay with low strength; ⑥ Muddy clay: mica, shell fragments, organic matter, and thin fine sand with high strength and fluidal plastic state; ⑦ Clay: mica, shell fragments, organic matter, and thin sandy silt with high strength and soft plastic state; ⑧ Silty clay with silt: mica, shell fragments, and sandy silt with thickness of 0.3–3.0 cm and has moderate strength and soft plastic state; and ⑨ Silty clay: mica, shell fragments, and sandy silt with moderate strength and soft plastic state.

(a) Field experiment site and (b) the geological setting of the experiment site.
Pounding energy definition of single round pounding experiments
The pounding experiments are conducted based on different dewatering method, such as dewatering in natural state and vacuum well-point dewatering. The dynamic compaction uses a hammer of 8–30 tones lifted by a crane and then freely falls down from 6 to 30 m of height. The soil will bear a big shock and shock stress will make soil particles compact. The pore water and air in the soil will be discharged at the same time. The strength of soil will be improved and the foundation capacity will be enhanced obviously. To find out variation trends of settlement, we used one zone beside the field experiment site with similar geological setting to conduct the dynamic compaction experiment. We have chosen different pounding energy such as 490, 560, 840, and 1060 kN m. The corresponding rounds of pounding are 3, 4, 4, and 4, respectively. The settlement and uplift of ground surface around pounding pit are measured after each round of pounding.
Figure 2 shows the relationship between settlements and pounding rounds. For four rounds of pounding with energies of 560, 840, and 1060 kN m, the total settlements reached 295.77, 372.27, and 476.78 cm, respectively. The average settlements of a single pounding are 73.94, 93.07, and 119.19 cm, respectively. The settlements of the last round of pounding are 36.20, 53.28, and 69.67 cm, respectively. The dynamic compaction with pounding energy of 490 kN m is carried out in three rounds and the total settlement is 249.32 cm. The average settlement of each pounding is 83.11 cm. The distances between the border of pounding pit and the point where the uplift is over 20 cm are 1.0, 1.5, and 2.0 m, respectively.

Settlements and uplifts under different pounding energies: (a) deformation and (b) relationship between settlements and pounding rounds.
Both the settlements and uplifts are related to the pounding energy and pounding rounds. The variation in the settlement suggests that it will decrease with increasing pounding rounds. Also, we can see that high pounding energy has an obvious effect on soil compaction. However, the soil structure can be damaged if the pounding energy is too big. The selection of pounding energy is very important. This experiment shows that the pounding energy ranging from 500 to 1500 kN m is adequate.
Experiment site and the layout of monitoring and detection points
Figure 3 shows two sub-zones that are used to conduct DCM and DCM_VWD, respectively. We named the two zones as A and B. They both have a dimension of 30 m × 30 m. Low-energy DCM and DCM_VWD are carried out, respectively. We monitored surface settlement, PWP, and layered settlement of soils. The sensor apparatus used in the experiment is vibrating string type of PWP gauge. All apparatus are connected by a dynamic data collection unit. The PWP is collected during dynamic compaction. The pounding pit is bulldozed after each experiment. Pounding is carried out on a 5 × 5 m2 grid.
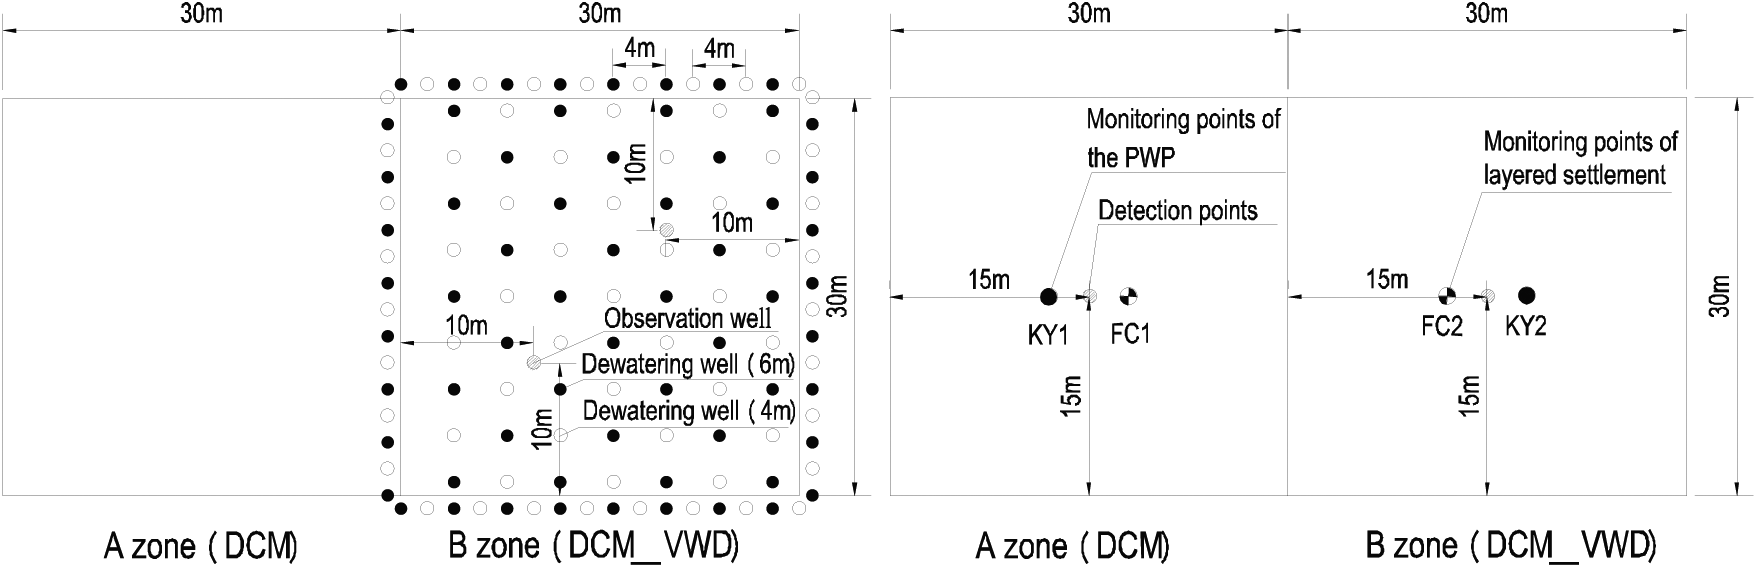
Compaction zones and layout of monitoring and detection points: (a) design scheme of dewatering well and (b) monitoring and detection points.
Field experiment procedures
Construction procedures in A zone
(1) Gravel cushion layer with thickness of 50 cm is paved after the site is leveled. (2) The first round of pounding with energy of 500 kN m is carried out by one time pounding. (3) For the next round of pounding experiment, we must wait for more than 10 days or PWP is dissipated by more than 80%. (4) The second round of pounding experiment has a layout of plum blossom pattern. The pounding energy is 1000 kN m and it pounds two to five times. (5) The same intermission was applied. (6) The third round of pounding experiment is carried out with the pounding energy of 1500 kN m. Four to eight times of pounding were applied. (7) In the fourth round of pounding experiment, we used a pounding hammer which is one-third of the diameter with the pounding energy of 500 kN m. Two to five times of pounding are performed.
Construction procedures in B zone
(1) First, the field is leveled. (2) The well-point pipes with lengths of 4 and 6 m are installed in the field. The pattern of interlaced arrangement for short and long well-point pipes with spacing of 3.0 m is configured. The dewatering period for now is set at about 10 days and the groundwater level is dropped by 2.5 m below the ground surface. (3) Short and long well-point pipes are removed. (4) The first round of pounding experiment is carried out with the pounding energy of 1000 kN m. Two to five times of pounding are performed. (5) Well-point pipes are inserted again as above, and the vacuum well-point dewatering for the second time is carried out for about 8 days and the groundwater level is dropped by 2.5 m below ground surface. 6) Short and long well-point pipes are removed again. The second round of pounding experiment has a layout of plum blossom pattern. The pounding energy is 1500 kN m and 5–10 times of pounding are carried out. (7) The gravel cushion layer with thickness of 50 cm is paved. (8) The third round of pounding experiment uses a pounding hammer of one-fourth of diameter. The pounding energy is 1000 kN m. Two to three times of pounding are performed.
Control standards of materials and construction technologies
Requirements of materials and site leveling
The gravel cushion layers should have properties of high strength. It consists of unweathered and slightly weathered stones. The stone size should be less than 20 cm and the mud percentage content is 5%–25%. The mass of gravel stone with diameters of 2–20 cm should be more than 50% of the total mass. The uniformity coefficient is more than 5.0. The gravel cushion layer should be paved before the experiments. All stone size must be smaller than 20 cm. To avoid loose phenomena and gathering of stones of the same sizes, the gravel cushion layer should be compacted and the thickness of gravel cushion layer should be controlled based on the degree of looseness.
Control standards of vacuum well-points dewatering
The high vacuum dewatering has an adjustable vacuum system with balance equipment. It consists of high vacuum pump, balance equipment, and jet pump. The electric power of high vacuum pump is more than 7.5 kW and the gas displacement is more than 15 L/s.
There are two kinds of well-point pipes with lengths of 6.0 and 4.0 m. The interlaced arrangement pattern of long and short well-point pipes is installed in the experiment site. The spacing is 4.0 m around the experiment zone and 3.0 m in the experiment zone. The diameter of well-point pipe is less than 5.0 cm. The length of filter pipe at the bottom of well-point pipe is less than 1.2 m. The void ratio of filter pipe is less than 15%. Two layers of nylon net with 60–80 meshes are bandaged by iron line outside the filter pipe.
The diameter of wellbore is less than 15 cm and it is within three degrees (≤3°) of vertical deviation. The borehole wall should be smooth. The depth of wellbore should extend 0.5–0.6 m beyond the length of well-point pipe. We first fill the bottom of the borehole with moderately coarse sand. The well-point pipe with filter pipe is then placed in the borehole. The moderately coarse sand is filled to 1.0 m below the ground surface. Finally, clay is used to fill and seal the rest parts of the borehole completely. This guarantees the groundwater discharge from the well-point pipe. All well-point pipes are connected to the collecting pipe on the ground surface, which is hooked to the vacuum pumps.
The number of long well-point pipes connected with every vacuum pump is less than 80. The electric power of the vacuum pump is 15 kW. The number of short well-point pipes connected with every vacuum pump is less than 120. Different types of well-point pipes must be equipped with different vacuum pumps. The groundwater from the collecting pipe should be discharged to the collecting ditches. The water depth in the collecting ditches should be less than 20 cm. The dewatering period is generally 7–10 days. The groundwater level should be lowered to 2.5 m below the ground surface. The well-point pipes around the experiment zone should work continuously during dynamic compaction. The dewatering period should be extended in rainy season.
Technological control standards of dynamic compaction
During the dynamic compaction, the groundwater level should be controlled to 2.5 m below the ground surface. The rain water in the pounding pit should be discharged immediately. To guarantee the pounding energy at every round, the center of pounding hammer should be aimed at the pounding point. The error should be less than 5.0 cm. The pounding energy may be adjusted according to the settlement and displacement of the pounding pit. The pounding energies, rounds, depths, uplifts, and special phenomena should all be recorded. The settlements of the last two rounds should be less than 10.0 cm.
Analysis of results
Variations of PWP
Two observation boreholes denoted as KY1 and KY2 are drilled in A and B zones, respectively. The locations of the boreholes are shown in Figure 2(b). Four monitoring points are fixed in every observation borehole. The depths of monitoring points in KY1 are 1.6, 3.0, 5.5, and 7.6 m, respectively. The depths of monitoring points in KY2 are 1.6, 2.8, 5.7, and 8.4 m, respectively. Each monitoring point will be recorded for each pounding. During the period of dewatering and intermission, the monitoring points will be recorded once in half an hour in the first 6 h, and once in an hour in next 6 h. Afterward, the recording will be done once in a day. The results are shown in Figure 4.

Variations of the PWP with time: (a) A zone and (b) B zone.
The first round pounding is carried out from days 1 to 2 and the dissipation period of PWP is from days 3 to 5. The second round pounding is carried out from days 6 to 7 and the dissipation period of PWP is from days 8 to 13. The third round pounding is carried out from days 14 to 15 and the dissipation period of PWP is from days 16 to 22. The fourth round pounding is carried out from days 23 to 24 and the dissipation period of PWP is from days 25 to 31. The full pounding had been carried out from days 32 to 35. The whole construction period lasts 36 days. After the first round of pounding, the PWP at every monitoring point increases slightly and the PWP dissipated by 80% after 3 days. After the second round of pounding, the PWP at every monitoring point increases as well. The PWP at 5.7 m is the highest and the PWP dissipated by 80% after 6 days. In the third round of pounding, the PWP at 1.6 and 3.0 m increased slightly. The PWP at 5.5 m has a large increase and the PWP at 7.6 m has a decrease during pounding. The PWP dissipated by 90% after 7 days. In the fourth round pounding, the PWP at 7.6 m has a small increase, while the PWP at other three locations have a large increase. The PWP dissipated by 90% after 7 days. For the full pounding, the PWP at all locations have a small increase first and then decrease to a stabilized value in the first day. They continue to decrease from days 2 to 4. In general, we can conclude that the PWP increases gradually with depth under dynamic load. The dissipation time increases gradually with depth.
Figure 5(b) shows the variation of PWP with time in the B zone. The first round of dewatering is carried out from days 1 to 6 and the first round of pounding is from days 7 to 8. The second round of dewatering is from days 9 to 19 and the second round of pounding is from days 20 to 21. The PWP is dissipated from days 22 to 25. The full pounding is at day 26. The whole construction period is 27 days. In the first round of dewatering, the PWP at 1.6 and 2.8 m is dissipated by 90% from days 1 to 2. During the same period, the PWP at 5.7 and 8.4 m is dissipated by about 80% and 50%, respectively. In the first round of pounding, the PWP at 8.4 m has a small increase, while the PWP at other three locations have a large increase. In the second round of dewatering, the PWP at all locations is dissipated by 90% after 6 days. For other PWP behavior, the B zone is very similar to A zone described above.

Relationship between pounding rounds and PWP dissipation: (a) A sub (b) B sub.
From the variations of the PWP observed for two kinds of reinforcements, we can conclude that the excess PWP increases immediately after dynamic compaction. This sudden increase will not dissipate quickly. This makes the soft clay as a “Rubber Soil.” When low-energy dynamic compaction is implemented, the PWP dissipates slowly and it usually takes 4–5 days to achieve 80% dissipation. There are remarkable differences between the traditional DCM and the low-energy DCM_VWD. The vacuum well-point dewatering system is set to actively drain and quickly dissipate. The PWP can be dissipated to about 90% after 1 or 2 days. In comparison with DCM, the construction period of DCM_VWD can be 25% shorter. This conclusion applies to highly saturated soft clay, which has high water content, void ratio, and poor permeability.
Comparison of the PWP before and after the experiment
Figure 6 shows the PWP before and after the experiment. Variations of PWP before and after the experiments in the A and B zones are very similar. However, the variation range of the PWP in the A zone is obviously smaller than in the B zone. The main reason is that discharge velocity of the PWP in zone B is faster due to dewatering measure. There are small differences of PWP before and after the test in A zone at the depth of 7.0 m. The big change of PWP for B zone occurs at depth of 7.0 m. PWP before and after experiments in B zone are nearly two times. It is obvious that vacuum well-point dewatering has a great effect on decreasing of PWP. The PWP increases when the well-point pipes are removed. The PWP in the A zone is smaller than in the B zone. We conclude that the soil strength reinforced by DC_VWD is much better than by DCM.
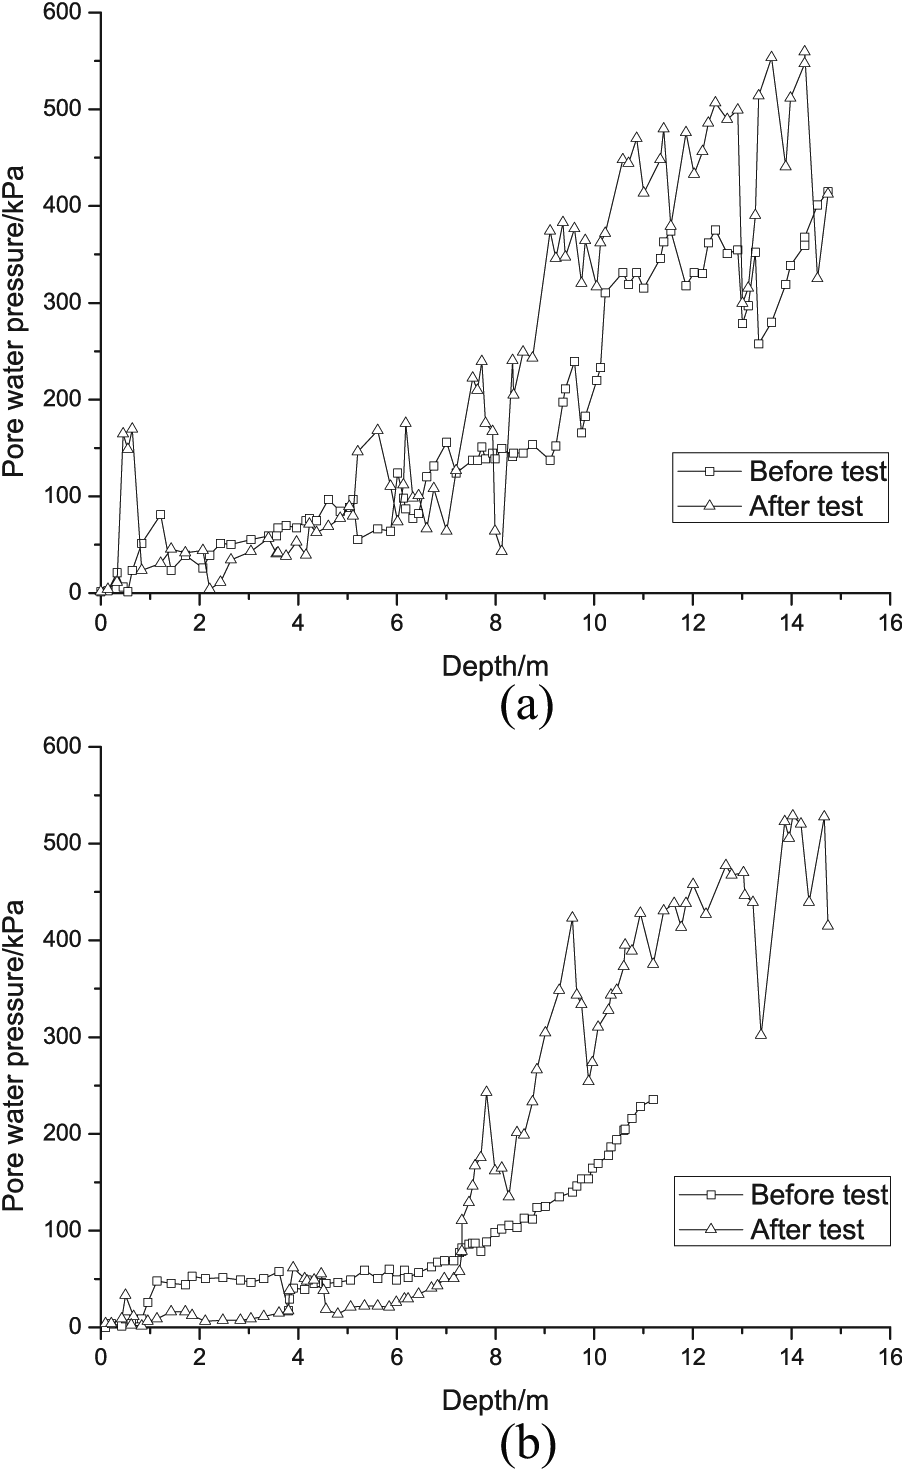
PWP before and after experiment: (a) A zone and (b) B zone.
Settlement of soil layers under dynamic compaction
Two monitoring boreholes in A and B zones are named FC1 and FC2, respectively. The settlements of soils at different depths are monitored during pounding and dewatering. During dewatering and intermittent period, we monitor once a day. The results are shown in Figure 7.

Settlements of soft soil at different depths: (a) A zone and (b) B zone.
In the process of pounding in A zone, the settlements of soils at depths of 2 and 3 m reached maximum. After the pounding, the soil rebounds because of the increase in PWP. Rebound is large after the first three rounds of pounding. The rebound becomes small after the fourth round of pounding. There is a small change in settlement after full pounding. In the B zone, the settlement of soil is insignificant in the first round of dewatering. However, the settlement becomes significant after the first round of pounding. Due to the vacuum well-point dewatering, there is no settlement rebound. We observed changes in settlement within a small range during the second round and full pounding. The settlements of different soil layers stabilize gradually. The settlement of soils at depths of 5.5 and 8.0 m occurred because of the pounding in A zone. The soils rebound obviously at the first round of pounding due to the increase in PWP.
For low-energy DCM, the settlements of soils occur and that generate the excess PWP immediately at dynamic compaction. The PWP dissipates slowly and soils experience rebound. For low-energy DCM_VWD, the PWP reaches its maximum after dynamic compaction. The pore water then discharges and the excess PWP released quickly. Soils are consolidated immediately and settlements occur. Soils settle more with DCM_VWD than with DCM.
Total settlements in the A and B zones
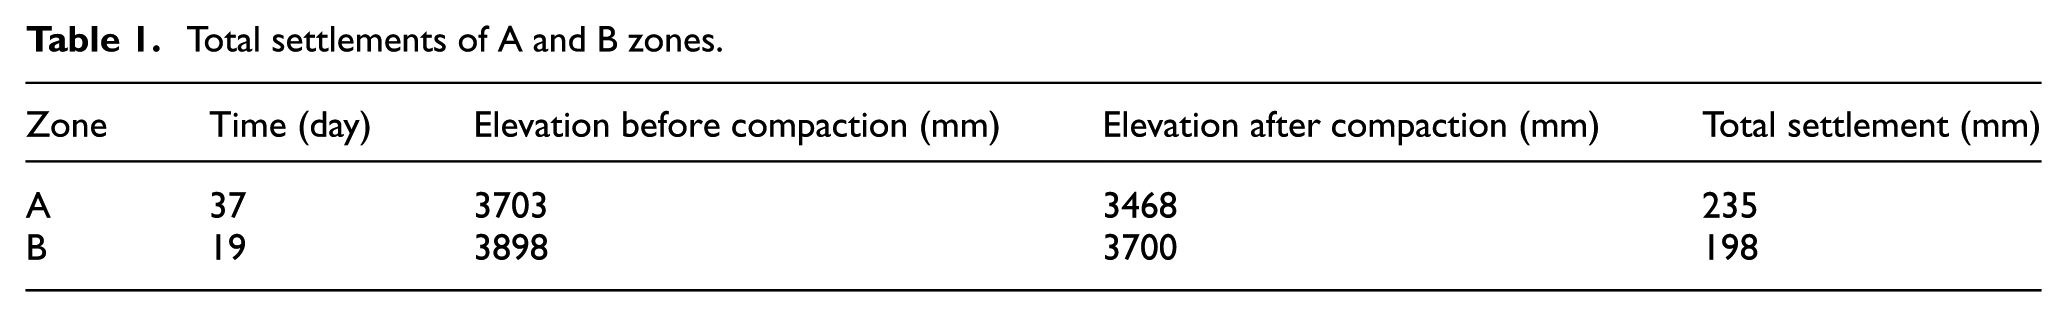
Table 1 shows the total settlements in the A and B zones. The settlement in A is larger than in B. However, the time of dynamic compaction for B is about half of A. It is obvious that the reinforcement of DCM_VWD is superior than DCM.
Total settlements of A and B zones.
Analysis on reinforcement mechanism of the DCM_VWD
We interpret the reinforcement mechanism of the DCM_VWD as follows: (1) the first step of decompression makes the groundwater level to go down and negative pressure forms in the soil layers. The excess PWP goes down to a constant value. (2) The second step of pounding mobilizes soil particles under the initial negative pressure. This changes the structure of the soil and excess PWP increases. (3) The third step is the deformation of soils where the soil particles rearrange themselves to form plastic deformation and a small part of elastic deformation. This is the main reason why big settlement occurs at the contacting moment of dynamic compaction. (4) The fourth step is soil consolidation. When the deformation completes, the excess PWP will reach a maximum. The pore water discharges then and the excess PWP decreases gradually. (5) The last step is the time accumulation. Sandy soil has good water permeability, and the excess PWP can dissipate quickly and do not nearly accumulate. However, cohesive soil has poor water permeability and the excess PWP cannot dissipate completely before next round of dynamic compaction. When the excess PWP increases to the weight of the overburden soils, liquefaction of upper soils will occur. The effective stress of soil will disappear completely. The excess PWP dissipates slowly in cohesive soil and soil strength increases with the excess PWP dissipating.
Reinforcement of soft soils based on experiment results
Reinforcement evaluation based on CPT
Penetration resistance is the ratio between probe resistance and probe area. It has three terms, penetration resistance (Ps ), tip resistance (Qc ), and lateral side friction (f c). For the soils in the experiment site, the penetration resistances are related as follows

According to the properties of soil layers and detection results of CPT in the experiment site, we can write the foundation bearing capacity as follows

where α and β are the modified coefficients of different soils. Their values are listed the Table 2.
Modified coefficients α and β of different soils.

Two CPT points are collected in zones A and B, respectively. Each point is at the center of each zone. Figure 8 shows the comparative results of two CPTs. Static point resistance and foundation bearing capacity before and after the experiments are shown. The results of the two CPTs are listed in Table 3.
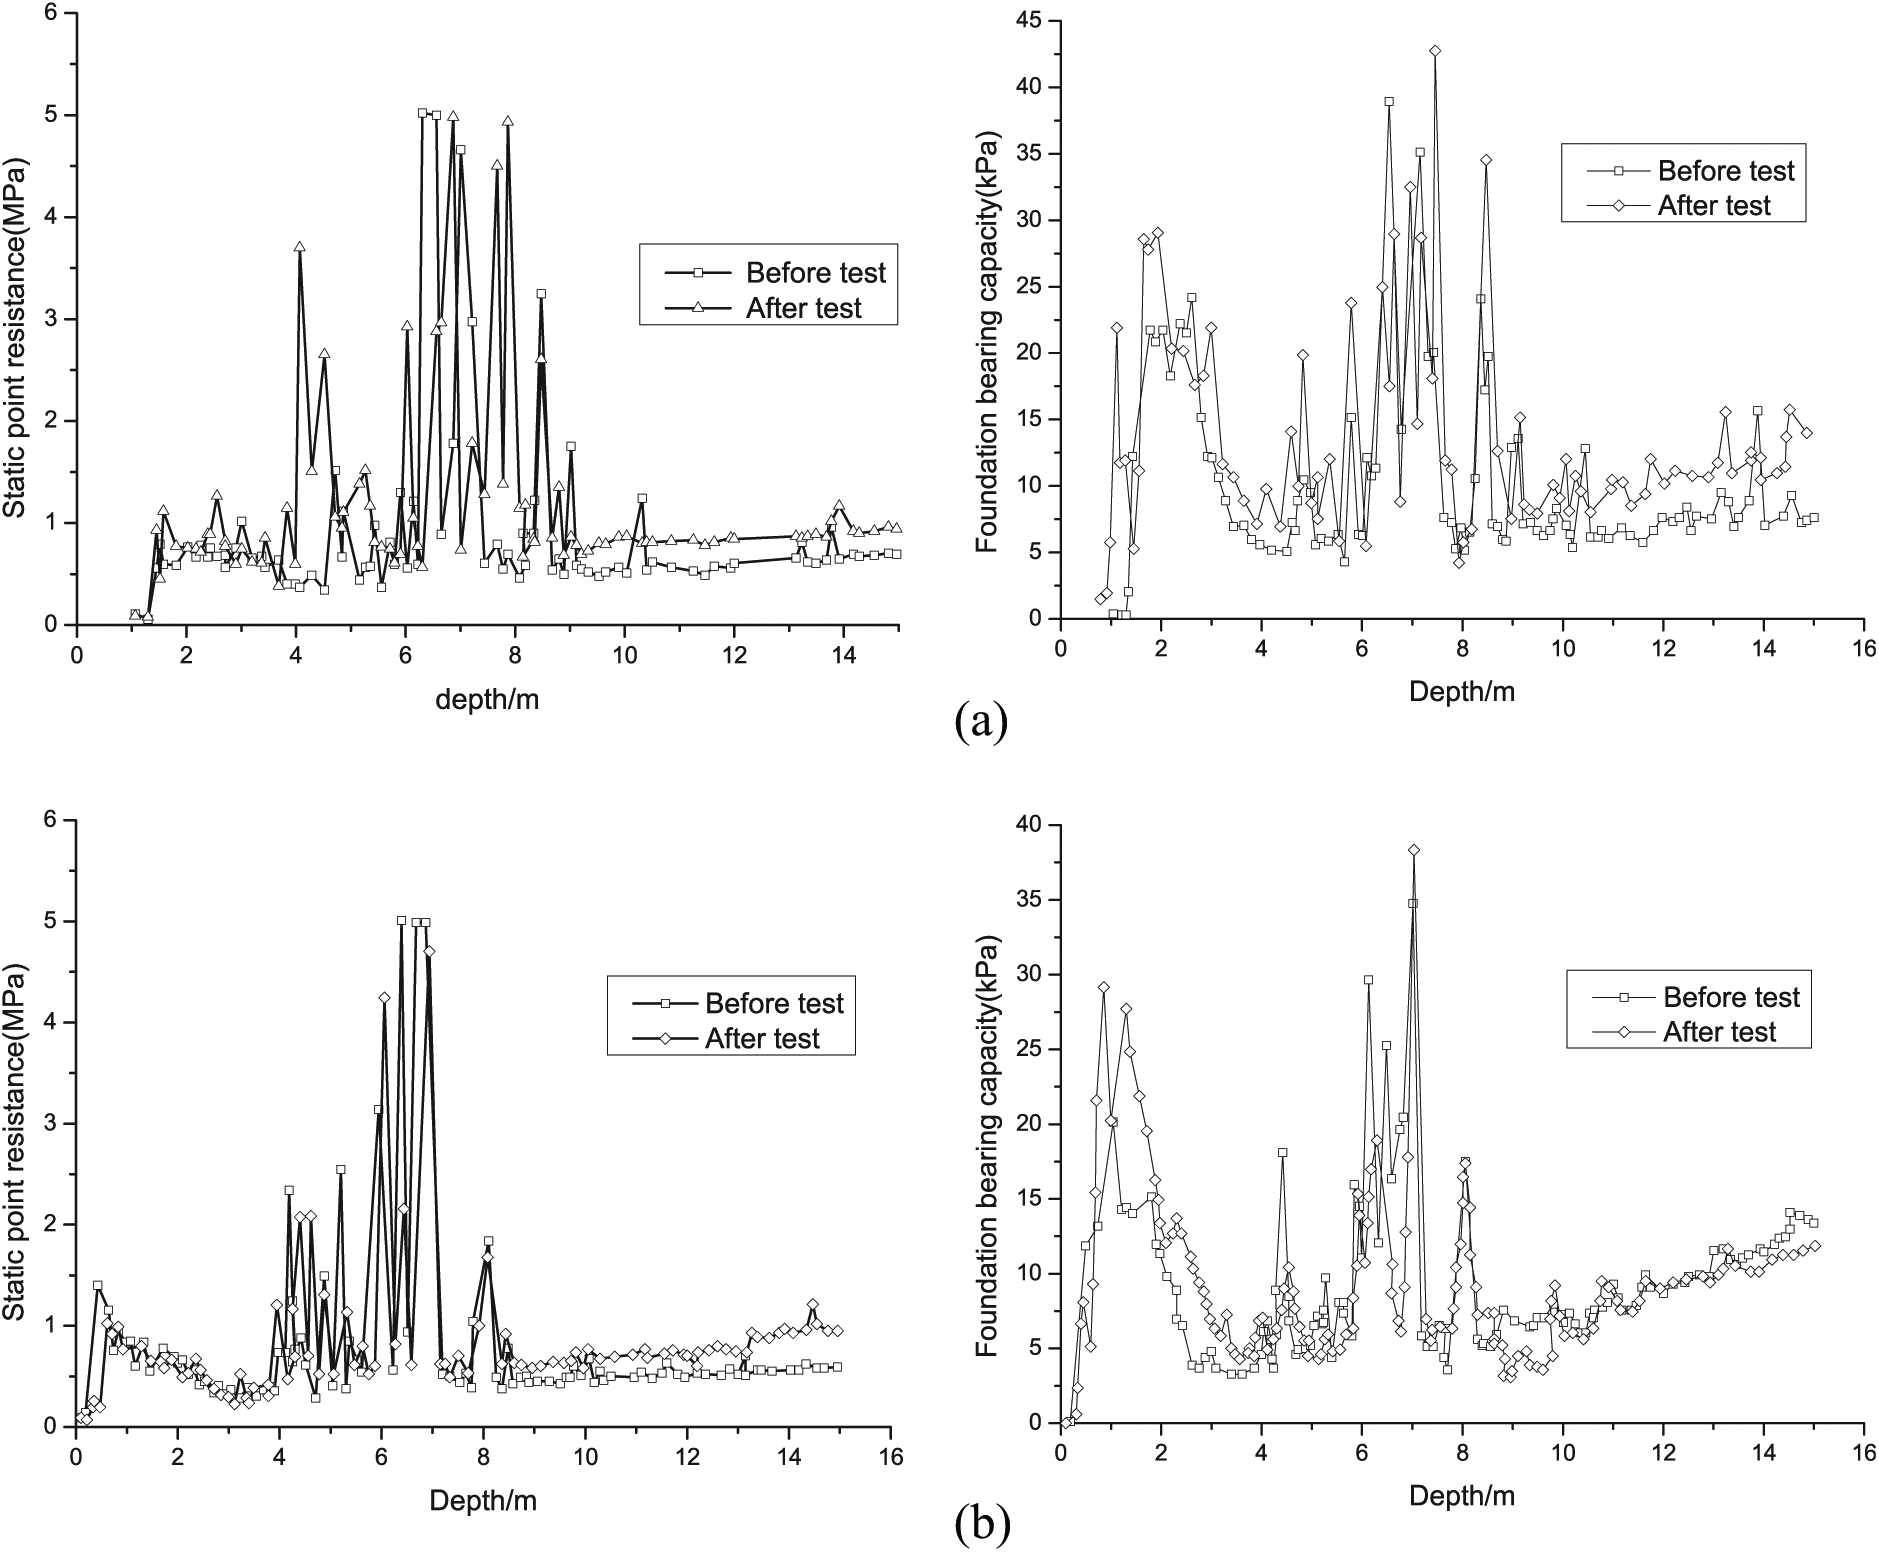
CPT results for (a) A and (b) B zones.
CPT results before and after the DCM_VWD.

CPT: cone penetration test; DCM_VWD: dynamic compaction method with vacuum well-point dewatering.
According to Figure 8(a) and Table 3, we can estimate the improvement in foundation bearing capacity by DCM. The foundation bearing capacity for muddy silty clay is enhanced by 7.4%, from 136 to 146 kPa. The foundation bearing capacities for clay silt, muddy silty clay, and muddy clay are enhanced by 9.6%, 25.9%, and 9.6%, respectively. The average cone resistances for silt clay, muddy silty clay, clay silt, and muddy clay are enhanced by 14.3%, 20.0%, 38.5%, and 20.0%, respectively. It is obvious that the improvement of clay silt is better than that of other soil layers. Within the depth of 8 m in A zone, the penetration resistance and foundation bearing capacity improved significantly after DCM.
From Figure 8(b) and Table 3, the tip resistance and foundation bearing capacity of muddy silty clay are 0.6 MPa and 125 kPa, respectively, before DCM_VWD. Their capacities increased by 17% after DCM_VWD. The foundation bearing capacities for muddy silty clay, clay silt, and muddy clay are enhanced by 24.8%, 43.3%, and 9.6%, respectively. The average cone resistances for silt clay, muddy silty clay, clay silt, and muddy clay are enhanced by 33.3%, 50.0%, 66.7%, and 20.0%, respectively. The improvement of clay silt is better than other layers. The strength improvement of DCM_VWD is far more than DCM. This proves again that dewatering during dynamic compaction is very efficient to enhance the strength of the soil. Within the depth of 8 m in the B zone, the penetration resistance and foundation bearing capacity increased significantly after DCM_VWD.
Table 3 shows the CPT results before and after the reinforcement. Specific penetration resistance and foundation bearing capacity of muddy silty clay are increased by 25% after DCM_VWD. Specific penetration resistance and foundation bearing capacity of other layers are relatively less increased. Specific penetration resistance and foundation bearing capacity of muddy silty clay and silty clay are increased by 25% after the DCM_VWD. The effective reinforcement depth is about 8 m.
Reinforcement evaluation based on VST
At the center of zones A and B, we choose to conduct VST to evaluate the reinforcement. Figure 9(a) and (b) shows undrained shear strength. The improvement of shear strength of muddy silty clay and silty clay is remarkable by DCM. The average peak and residual strength of silty clay before DCM are 30 and 13 kPa, respectively. The strengths increase to 36 and 16 kPa after DCM. The average peak strength is increased by 20% and average residual strength is increased by 23%. The average peak and residual strength of muddy silty clay before DCM are 36 and 16 kPa, respectively, and these strengths are increased to 44 and 20 kPa. The peak strength is increased by 22% and residual strength is increased by 25%. The undrained shear strength has small changes for muddy silty clay before and after DCM.

VST evaluation of reinforcement: (a) A zone and (b) B zone.
Figure 9(b) shows the VST results using the DCM_VWD enforcement in the B zone. The average peak strength and residual strength of silty clay before DCM_VWD are 42 and 14 kPa, respectively, and these strengths are increased to 42 and 18 kPa after DCM_VWD. The residual strength is increased by 29%. The average peak strength and residual strength of muddy silty clay before DCM_VWD are 60 and 16 kPa, respectively. The average peak strength and residual strength of silty clay after DCM_VWD are 48 and 18 kPa, respectively. The peak strength is decreased by 22% and the residual strength is increased by 13%. The undrained shear strength of muddy clay has a small change. DCM_VWD improves the undrained shear strengths of shallow soils. However, such improvement is not significant for deep soils. DCM_VMD enforces soil better than DCM.
Reinforcement evaluation based on physical-mechanical properties of soils
Table 4 shows the physical and mechanical parameters 25 of soft soil layers before and after the reinforcement. DCM has a small impact on specific weight and saturation of soil layers. The optimized rate best ratio of soil indicators before and after DCM is less than 5%. The DCM does have a great effect on water content. The optimized rate is more than 5%. In comparison with DCM optimized rate, DCM_VWD is larger. The DCM has a larger influence on cohesion than the internal friction angle, especially for the muddy clay. The optimized rate of cohesion reaches 20% in the A zone (DCM) and 30% in the B zone (DCM_VWD). The effect on silty clay and muddy clay ranges from 10% to 20%. For internal friction angle, muddy clay in the B zone (DCM_VWD) has the highest change of 9.38%. The optimized rate for compressibility of the soil in the B zone (DCM_VWD) is larger than that in the A zone (DCM). The optimized rate of tip resistance and side friction in the A zone (DCM) is larger than in the B zone (DCM_VWD). The optimized rate of tip resistance in the A zone is more than 50% than in the B zone. The excess PWP in the A zone is increased by two times after DCM. Because of dewatering in the B zone, there is no excess PWP increase after DCM_VWD. For undrained shear strength, the improvement of silty clay in the B zone is better than in the A zone. The optimized rate of clay silt reaches to 34.14% in the A zone. For soil sensitivity, the optimized rate is the highest for muddy clay and clay silt among other soils. In general, DCM_VMD has better reinforcement effect on muddy clay, clayey silt, silty clay, and muddy silty clay than DCM.
Physical and mechanical parameters of soil layers before and after reinforcement.

①: after reinforcement; ②: before reinforcement; ③: optimized ratio.
Conclusion
Both settlement of pounding pit and uplift around pounding pit are closely related to pounding energy and pounding rounds. High pounding energy is easier to lead to destroy the soil structure. To decrease the influence of soil structure and enhance the strength of DSSF_HDS, we selected the pounding energy from 500 to 1500 kN m based on trial at the site.
DCM_VWD can quickly dissipate the excess PWP. This shortens the construction period by 25% in comparison with DCM. For both DCM and DCM_VWD, the effective reinforcement depth can reach up to 8.0 m. In general, the improvement is superior for DCM_VWD than for DCM.
Footnotes
Acknowledgements
The authors gratefully acknowledge Dr Haifeng Tang, in China Southwest Architecture Design and Research Institute Co. Ltd (Shanghai), for his contribution to the field experiment.
Handling Editor: Xin Li
Declaration of conflicting interests
The author(s) declared no potential conflicts of interest with respect to the research, authorship, and/or publication of this article.
Funding
The author(s) disclosed receipt of the following financial support for the research, authorship, and/or publication of this article: This research is financially supported by the Natural Science Foundation of China (grant no. 41672258, 41102162, and 41472241).