
Abstract
The rock mass has special properties, such as inhomogeneity, anisotropy, discontinuity, and nonelastic, due to various internal or external stress in the process of its formation. In this study, similar materials are considered to simulate the rock mass and analyze the failure law using laboratory tri-axial tests based on the similarity principle. The rock mass and discontinuity are constituted in the process of model construction by considering the influence of the orientation, spacing, and number of discontinuity, respectively. Then, the influences of the orientation, spacing, number of discontinuity, and the combination of different discontinuous strength on rupture mechanism of the rock mass are analyzed by considering lots of numerical test schemes using the discontinuous deformation analysis method. Finally, considering water conveyance tunnel in Jurong Pumped Storage Power Station in China as a test case, the tunnel stability under different discontinuities combination is analyzed using discontinuous deformation analysis method. The influence of the optimal tunnel axis and tunnel shape on the stability of surrounding rock is studied by comparative analysis of surrounding rock stability under different tunnel axis and tunnel shapes. The stress concentration in case of the circular tunnel with corner is somehow less than that of the rectangular one.
Introduction
The strength and deformation properties of rock masses with discontinuities are critical for the design of engineering structures, such as tunnel and slope.1–6 However, complicated discontinuity patterns, anisotropic and inhomogeneity in a rock mass make the strength estimation difficult. At present, most laboratory rock mechanics tests only involve a one-piece rock masses. No considerations are given to the rock mass discontinuity. It has been shown that a number of major rock mass engineering accidents around the world are due to discontinuities.
To assess the influence of discontinuities, some researchers have developed the rock mass structure control theory. They have conducted systematic and comprehensive studies on the basic laws of rock mass deformation and destruction.7–17 Kulatilake and Wu 18 studied the estimation of mean trace length of discontinuities. Kulatilake 19 estimated the elastic constants and strength of discontinuous rock. Sturzenegger and Stead 20 presented the quantifying discontinuity orientation and persistence on high mountain rock slopes and large landslides using terrestrial remote sensing techniques. Wu et al. 21 studied the comparison of rock discontinuity mean trace length and density estimation methods using discontinuity data from an outcrop in Wenchuan area, China. Lato and Vöge 22 carried out the automated mapping of rock discontinuities in three-dimensional (3D) lidar and photogrammetry models. Umili et al. 23 used a new method for automatic discontinuity traces sampling on rock mass 3D model. Cacciari and Futai 24 studied the mapping and characterization of rock discontinuities in a tunnel using 3D terrestrial laser scanning. The general methods presently used to study the rock mass mechanics parameters and properties may be divided into several methods depending on their research approach, such as empirical method, engineering analogy, laboratory and field test, analogy simulation test, and numerical test. Among these, the analogy simulation test and numerical test methods are the most suitable for using in rock mass mechanics tests, due to the fact that they can consider the combined characteristics of the discontinuities.
In this article, the laboratory simulation and numerical tests were carried out. Materials are found to simulate the rock mass and analyze the failure law based on the similarity principle. The discontinuities are constituted in the process of model construction and their influence on rock mass strength is studied by analyzing the extension process of cracks during rock mass damage. The strengths are assessed using laboratory tri-axial tests. The results of numerical experiment schemes using the discontinuous deformation analysis (DDA) was analyzed. Finally, a water conveyance tunnel in Jurong Pumped Storage Power Station in China was tested. Based on the geometric features measured in the field and mechanical parameters measured in laboratory, the DDM model is established to analyze the tunnel stability under various discontinuities combinations. The optimal tunnel axis and shape for the stability were investigated.
Sample preparation and test methods in laboratory
In this article, in order to study the strength parameters of rock mass with stochastic combination discontinuities, the analog simulation tests are considered. According to the analog simulation principle, rock-like material is usually used to simulate the jointed rock mass.
Selection of rock-like material
The rock-like material are two kinds. One is aggregate, such as sand, clay, iron powder, aluminate powder, sawdust, barite, and so on, and the other is cementing material, such as gypsum, cement, paraffins, resin, kaolin, and so on. These materials are mixed to certain proportion to make rock-like samples with various strength and deformation properties. In this article, we use concrete mixed with different aggregate and cementing materials.
The surrounding rock of the water-conveyance tunnel in Jurong pump-storage hydropower station in China has a compressive strength of 36–66 MPa, elastic modulus of 5–8 GPa, and Poisson ratio of 0.15–0.30. Based on these parameters, a certain ratio of cement, sand, water, and other filling material is selected based on engineering analogy method. Three groups of uniaxial compressive tests, tri-axial tests, and direct shear tests were performed to select a sample which matches the surrounding rock of the water-conveyance tunnel. The size of samples used for uniaxial, triaxial, and direct shear tests is ∅54 mm × 108 mm, ∅54 mm × 108 mm, and ∅54 mm × 54 mm, respectively. The selected one has uniaxial compressive strength of 45.36 MPa, elastic modulus of 5.6 GPa, Poisson ratio of 0.2, cohesion (c) of 10.82 MPa, and internal friction angle (φ) of 47.7°.
In nature, the discontinuity is not persistent and has small strength. In this study, the polyamide resin and epoxy resin were used to bind the isolated discontinuities in order to guarantee existence of strength for the discontinuity during the tests. Therefore, the strength of binder is very vital to the strength of sample with combination discontinuities. For confirming the strength of binder, some standard samples are used to test the strength of discontinuity with binder. The granite sample, whose rigidity was strongly bigger than the similar material, was cut into two parts paralleled to the end face. They were bonded by the binder (configured epoxy resin glue). The mechanical parameters of the binder were measured by direct shear test indirectly (Figure 1).

Determination of simulated structural plane parameters of epoxy resin cements: (a) Granite sample, (b) direct shear test, and (c) Specimen after direct shear test.
After trial experiment for several times, the mix proportion between polyamide resin and epoxy resin is confirmed. It is very suitable to simulate the strength of discontinuity because it can meet requirement with no thickness and certain strength. The strength parameters of discontinuity with this binder are c = 3.29 MPa and φ = 23.6°.
Sample preparation
The samples were prepared directly through a precast mold. The edges of a sample may have poor strength due to uncompacted concrete. The size may be improper for the test due to contraction of concrete in condensation. To avoid these drawbacks, large-scale concrete sample will be poured in a mold with steel slice used to modeling discontinuity. After the concrete condensation, the steel slice is removed and bonding takes place with the mixture of polyamide and epoxy resins. Samples for laboratory tests are drilled off from the concrete block and then cut (Figure 2).

Sample preparation: (a) drilling holes machine and (b) cutting machine.
In the process of sample preparation, the vaseline will be used to paint the inner side wall of mold in order to decrease the influence of binding. Concrete will be poured in a layered manner into the mold and the poured concrete will be vibrated on the vibrator for 5–10 min. Meanwhile, to minimize the difference among samples, all the samples are prepared using the same mold, mix-proportion, curing condition, and period. The cement used is ordinary Portland cement with number 42.5R, and the water–cement ratio is 0.45, the curing period is 28 days under moist conditions. The precast samples are processed into test samples with the diameter being 54 mm and height being 108 mm. All the test samples need to meet the requirement of its inclination for the top and bottom surface of the sample to be less than 3°.
Test methods
Four groups of rock mass samples were prepared with a single discontinuity having different dip angles of 0°, 30°, 45°, and 60°. Six groups of combination discontinuity with dip angles of 30°, 45°, and 60° having spacing of 30 and 45 mm, respectively, were prepared. Three samples in each group were tested in tri-axial tests to obtain the average value.
The tri-axial tests were conducted using equipment produced by ELE (England). It has the maximum confining pressure, maximum stroke, and accuracy of 70 MPa, 50 mm, and 1%, respectively. The confining pressures of 1, 1.5, 2, 2.5, 3, and 6.0 MPa were used. During the process of tests, initially, the confining pressure was preloaded from15 kPa/s to 0.45 MPa. After that, the axial pressure was loaded at a rate of 8 kN/min to 2 kN, and then the confining pressure was loaded to the designed value at a rate of 15 kPa/s. Finally, it was loaded at a rate of 8 kN/min until the rock sample got damaged. Based on the relationship between the confining stress and the axial stress, the strength parameters were obtained by the following equations

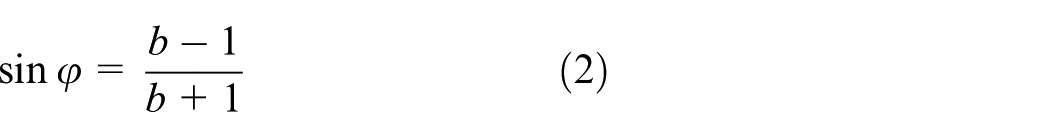

where y is the axial stress, x is the confining stress, b is the fitting linear equation parameter of the slope, a is the fitting linear equation parameter of the intercept, c is cohesion, and φ is internal friction angle.
Laboratory tests and results
Influence of discontinuity dip angle on rock mass strength
Three groups of samples were prepared introducing a discontinuity with its dip angle 30°, 45°, and 60°, separately. Under different confining pressures, tri-axial tests on a series of samples were conducted. The axial stress was recorded when the sample got damaged. The test results are shown in Figure 2. From equation (1), the strength parameters of samples are presented in Table 1.
The strength parameters of samples in laboratory tests.
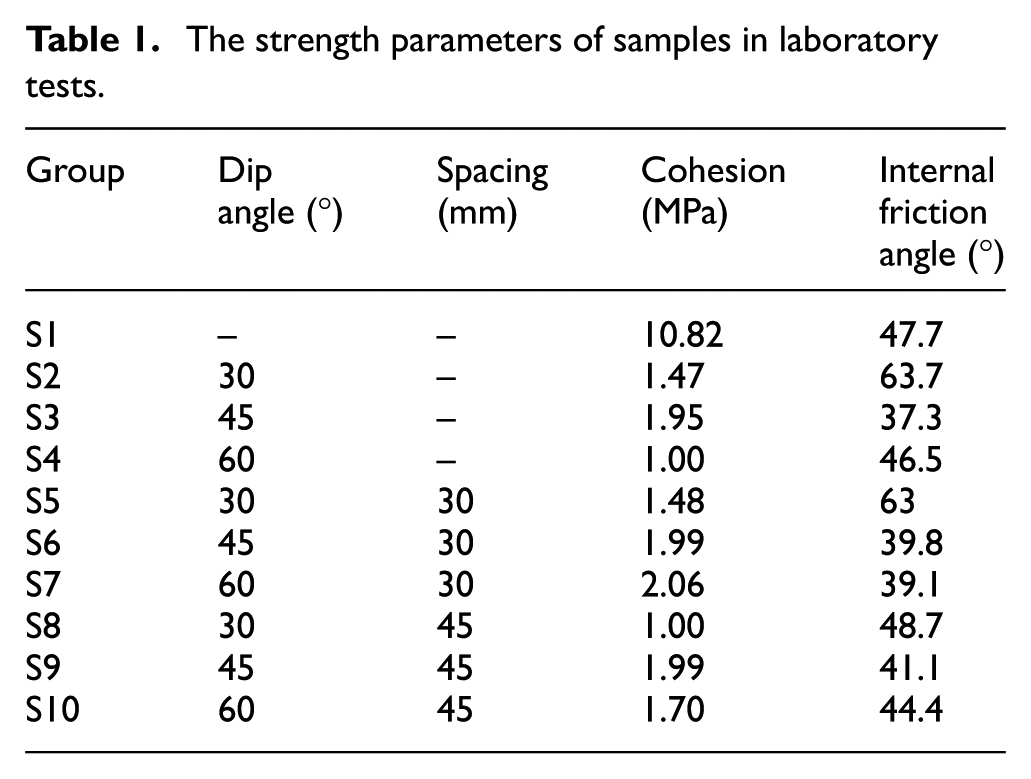
It can be seen from Figure 3 and Table 1 that the strength parameters of samples with single discontinuity having its dip angles 30°, 45°, and 60° are c = 1.47 MPa and φ = 63.7°, c = 1.95 MPa and φ = 37.3°, c = 1.00 MPa and φ = 46.5°, respectively. Figure 4 shows the failure maps of samples with different dip angles. According to Figure 4, it can be found that the strength of sample with low dip angle is close to that of intact samples and the failure of part samples is not along discontinuity but appear in intact rock-like material. The strength parameters of sample with moderate angles are close to that of discontinuity. The strength parameters of samples with high dip angles are greater than those of samples with moderate dip angles, but are less than those of samples with low dip angle. It indicates that the influence of discontinuity with different dip angles is very obvious.

Relationship between confining stress and axial stress for different dip angles.
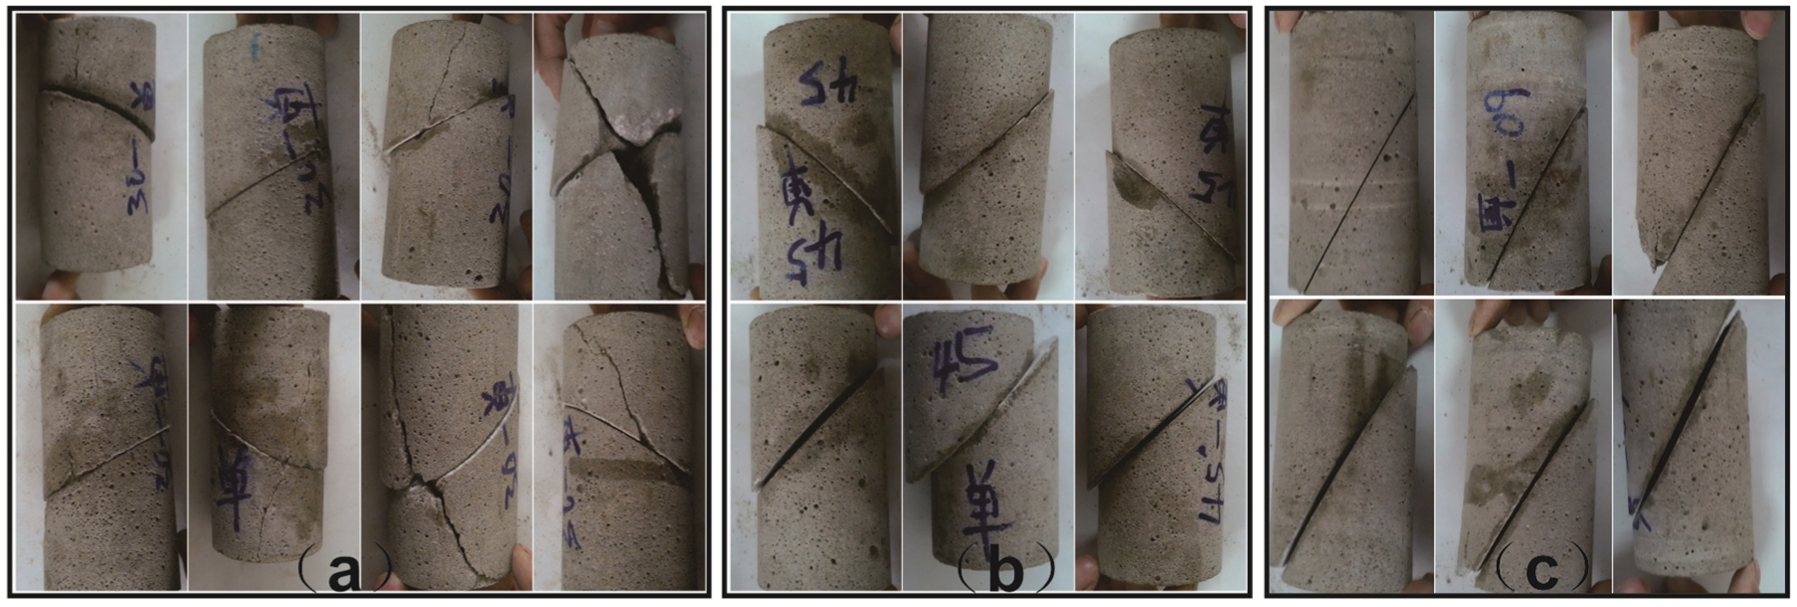
Failure maps of samples with different discontinuities: (a) 30°, (b) 45°, and (c) 60°.
Influence of discontinuity spacing on rock mass strength
Keeping in mind the sample size, two discontinuities with spacings 30 and 45 mm are introduced in the samples. The dip angles of discontinuity are 30°, 45°, and 60° separately. The test results are shown in Figure 5. Based on the fitting linear equation (1) between the confining stress and the axial stress, the strength parameters of samples are presented in Table 1. It can be seen from Figure 5(a) and Table 1 that the strength parameters of samples with spacing 30 mm and dip angles 30°, 45°, and 60° are c = 1.48 MPa and φ = 63°, c = 1.99 MPa and φ = 39.8°, c = 2.06 MPa and φ = 39.1°, respectively. Figure 6 shows the failure maps of samples with spacing 30 mm and different dip angles. When the dip angle is low and moderate, the failures of samples with two discontinuous planes are along the discontinuous planes. It indicates that there are some differences in failure mode between sample with two discontinuous planes and sample with single discontinuous plane. The combination characteristics of discontinuities play a dominant role to the failure modes of the samples. For the high dip angles, the failure of samples is not only along the discontinuous plane, but also some small cracks appear near the discontinuity, which intersect the discontinuous plane at an acute angle. It indicates that the failure of sample presents “X” shape.

Relationship between confining stress and axial stress for different spacings: (a) 30 mm and (b) 45 mm.

Failure maps of samples with spacing being 30 mm and different angles: (a) 30°, (b) 45°, and (c) 60°.
According to Figure 5(b), the strength parameters of samples with spacing 45 mm and dip angles being 30°, 45°, and 60° are c = 1.00 MPa and φ = 48.7°, c = 1.99 MPa and φ = 41.1°, c = 1.70 MPa and φ = 44.4°, respectively. Figure 7 shows the failure maps of samples with spacing 45 mm and different dip angles. According to Figure 7, the angle between failure face and axial stress is less than 30°. The dip angle of discontinuity has little influence on strength of rock mass. Its strength is close to that of rock mass. The failure modes of sample with dip angle 45° are either along discontinuous plane or in the rock. It indicates that discontinuity has certain degree of influence on the strength of rock mass. The failure mode of sample with high dip angle is mainly damaged along the discontinuous plane under certain conditions.

Failure maps of samples with spacing being 45 mm and different angles: (a) 30°, (b) 45°, and (c) 60°.
Numerical test and result analysis
The laboratorial tests failed to simulate the deformation and failure of rock samples with several sets of discontinuities with different dip angles due to limitation of sample size. To avoid this deficiency, numerical modeling, which is widely applied in rock mechanics tests with large scale sizes nowadays, is used to realize the simulation process of tests. The non-continuum media analysis method will be selected as the tool of numerical test due to its rationality for simulating rock mass in this article. In order to guarantee the veracity of simulation results, the test scheme in the laboratory test will first be simulated based on the same test conditions. Thus, the result comparison between laboratory test and numerical modeling test will decide whether the result of numerical test is rational or not. The sample size for numerical test is ∅54 × 108 mm. The confining pressure is transferred to sample through steel plate and axial pressure is also loaded through a steel plate (Figure 8(a)). On the surface of sample, several measurement points are used to monitor the change of displacement with the increasing normal load. The judgment standard of sample loading and failure is based on displacement development with load change (Figure 8(b)).
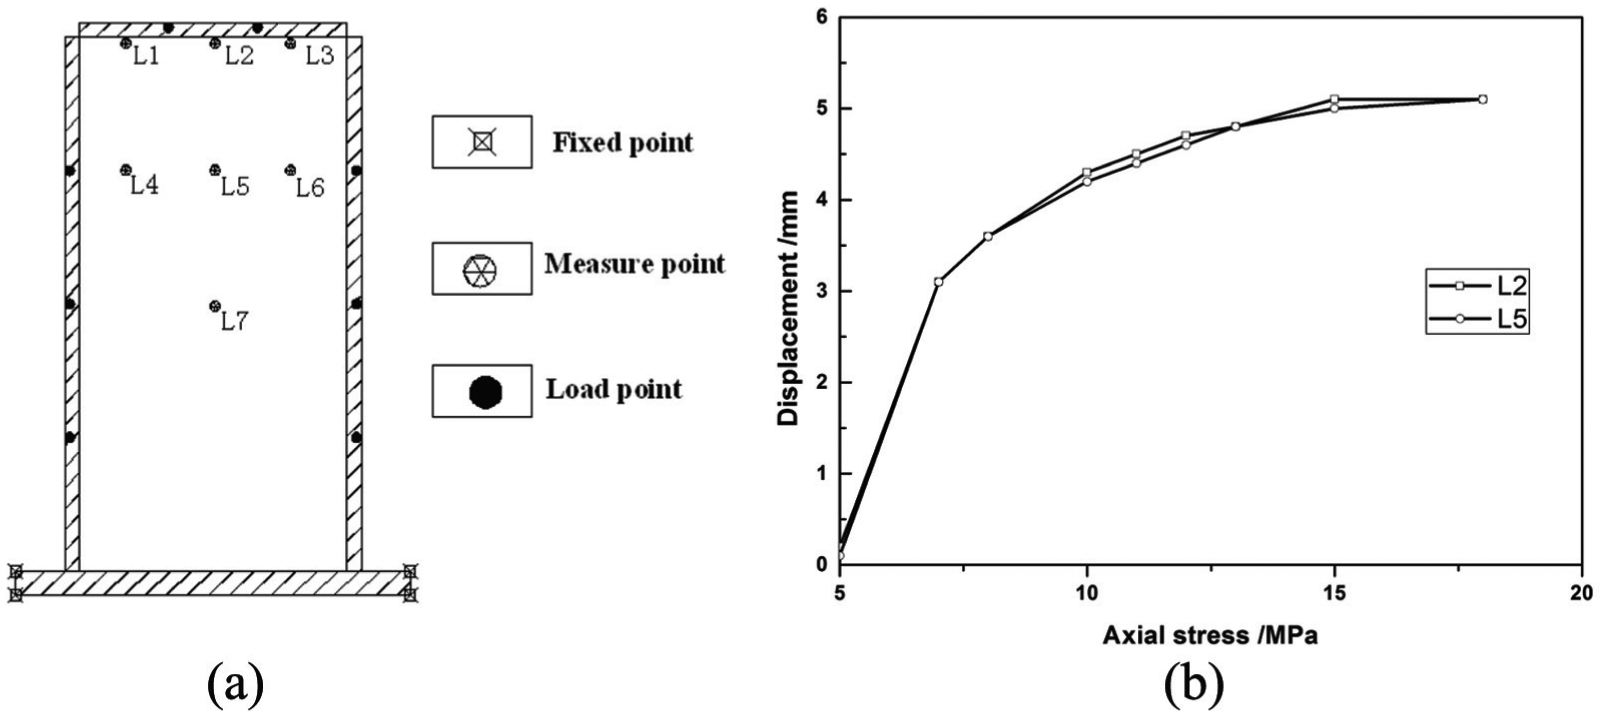
Model of numerical experiment and judgment standard of sample failure: (a) model and its measure point of numerical experiment and (b) the relationship between axial stress and displacement for the sample with dip angle 60° and confining stress 1.5 MPa.
Results comparison between numerical and laboratory tests
To verify the reliability of numerical modeling results for multiple discontinuities, the laboratory tests are modeled by software called DDA. The displacement monitoring points are setup as shown in Figure 8(a). The comparison between numerical simulation and laboratory test is shown in Figure 9. The failure maps for various dip angles and spacing of discontinuity are shown in Figure 10.

Comparison between numerical modeling and laboratory test: (a) dip angle with 30°, 45°, and 60°; (b) spacing with 30 mm; and (c) spacing with 45 mm.

Failure maps of samples under numerical simulation: (a) different dip angles, (b) spacing with 30 mm, and (c) spacing with 45 mm.
According to Figures 9 and 10, it can be observed that there is greater uniformity in the results between numerical simulation and laboratory test. So far, it proves that the numerical simulation using DDA method is an efficient method to study the deformation laws and strength parameters of rock mass with complexity in combination discontinuities.
There are more than three groups of structural planes in the rock mass, which was affected by multiple tectonic action. The interlaced structural planes form the rock mass with the structural body. According to this, the effect of two groups of structural planes was considered first in this article. The dip angle of two groups of structural planes was set in eight types including 15°, 30°, 45°, 60°, −15°, −30°, −45°, and −60° in the DDA model. Twelve combinations were selected by orthogonal combination method to carry out numerical experiments. These were used to illustrate the view that different combinations of structural planes in rock mass led to different mechanical properties of rock mass. The model was built on the basis of the actual structural plane and the model was basically consistent with the actual rock mass in the case study. Therefore, the mechanical parameters of the rock mass determined by the model were more reasonable which were used for the stability evaluation of the surrounding rock in the later stage.
Influence of dip angle on strength of rock mass
In this test, the confining pressure of samples is 1.5 MPa. The dip angles of discontinuities are varied as 0°, 15°, 25°, 30°, 40°, 45°, 50°, 55°, 60°, 65°, 70°, 75°, and 90°, separately. The strength parameters of discontinuity is c = 3 MPa and ϕj = 25°. The spacing is d = 28 mm, elastic modulus is E = 5 GPa, the weight is γ = 2.1×10³ kN/m3, and the Poisson ratio is µ = 0.2. Taken the measurement points L2 and L5 as examples, the relationship between axial pressure and axial deformation is shown in Figure 11. This relationship presents different types under different dip angles. The curves for the rock samples with moderate dip angles (about 30°–60°) appear more flat than those with low and high dip angles when the axial stress reaches certain degree. The main reason is that the failure of sample with moderate dip angle of discontinuities is along the discontinuous plane rather than in the rock. The results can be seen in Table 2 and Figure 12.

Relationship between axial pressure and axial deformation under different dip angles: (a) L2 and (b) L5.
Failure patterns of rock mass with different dip angles.


Influence of dip angle on strength of rock mass: (a) relationship between axial stress and dip angle, (b) failure maps under different dip angles, and (c) failure maps of rock samples.
According to Table 2 and Figure 12, it can be observed that the dip angle of discontinuous plane has great effect on the strength. The failure load of rock mass varies with dip angle of discontinuous plane. The failure patterns of rock mass are divided into three types, such as failure along discontinuous plane, rock failure, and both of them. The failure types of rock mass with low and high dip angles of discontinuous planes are of rock failure type. And the failure type of rock mass with moderate dip angles (30°–75°) of discontinuous planes is along the discontinuous plane. When the dip angle of discontinuity is 30° and 75°, the failure type of rock mass includes both rock failure and failure along the discontinuous plane. The minimum value of strength appears when the dip angle of discontinuity is 55°. To sum up, the rock failure appears when the internal friction angle of discontinuity is greater than that of dip angle of discontinuity. The strength of rock mass will decrease gradually with the increase in the dip angle of discontinuous plane. The minimum value of strength appears when the dip angle of discontinuity is equal to 45° + ϕj/2, which is in agreement with the theoretical analysis. Afterward, the strength of rock mass will increase with the increase in the dip angle of discontinuity.
Influence of spacing on strength of rock mass
In order to study the influence of spacing on the strength of rock mass, three types of spacing, such as 10, 28, and 40 mm, are selected to conduct the numerical simulation tests. The strength parameters of discontinuity are c = 3 MPa and ϕj = 25°. The confining pressure is 3.0 MPa and the dip angles of discontinuity is 40°, 45°, 55°, 60°, and 65° separately. Figure 13 shows the failure maps of rock samples with different spacings. According to the failure maps, it can be observed that the failure of rock samples is along the discontinuous plane when the dip angle of discontinuity is more than the internal friction angle of discontinuity. Taken the measurement point L5 as example, the relationships between displacement and axial stress under different spacings and dip angles are shown in Figure 14.

Failure maps of rock samples with different spacings: (a) 20 mm and (b) 40 mm.

Relationship between displacement and axial stress under different spacings and dip angles (L5): (a) dip angle 40° and 45°, and (b) dip angle 55°, 60° and 65°.
From Figure 14, it is observed that the strength of rock sample will increase with the increase in the spacing of discontinuity. Because the dip angle of discontinuity is greater than the internal friction angle of discontinuity, the failure of rock sample nearly occurred along the discontinuities. The minimum value of rock mass strength appears when the dip angle of discontinuity is 55°. The influence of spacing on strength is small when the dip angle of discontinuity is low, and the change of displacement is very close to each other. The displacement of rock sample with large spacing is greater than that of rock sample with small spacing when the dip angle becomes large gradually. The reason is that the block size will become larger with increasing spacing. The failure of rock mass is constituted by the deformation of rock block and sliding along discontinuity. When the moderate dip angle of discontinuity appears in the rock mass, the influence of spacing on the strength of rock sample is obvious. The strengths of rock samples with spacing 10 and 28 mm are lower than that of rock sample with spacing 40 mm. The failure pattern of rock sample is observed to be rock damage when the dip angle and spacing of discontinuity are large. The less the spacing of discontinuity, the less the strength of rock mass.
Influence of strength of discontinuity on strength of rock mass
To study the influence of strength of discontinuity on that of rock mass, four different types of discontinuities, such as (1) c = 0.3 MPa, ϕj = 10°; (2) c = 0.3 MPa,ϕj = 25°; (3) c = 0.3 MPa, ϕj = 35°; and (4) c = 0.3 MPa, ϕj = 45°, are selected to carry out the numerical simulation tests. The confining pressure is 3 MPa and the dip angles of discontinuity are 40°, 50°, 55°, and 60°, separately. Figure 15 shows the relationship between displacement and axial stress under different discontinuity strengths and dip angles.

Relationship between displacement and axial stress under different discontinuity strength and dip angles: (a) dip angle 40° and 50°, and (b) dip angle 55° and 60°.
According to Figure 15, the strength of rock mass has close relationship with the combination of strength and dip angle of discontinuity. When the internal friction angle of discontinuity is low, the strength of rock mass is also low. For the high internal friction angle of discontinuity in case of moderate dip angle of discontinuity, the strength of rock mass is also low. The reason is that the dip angle of discontinuity plays an important role on the strength of rock mass.
Influence of discontinuities combination on strength of rock mass
Two sets of discontinuities with same strength parameters
Combination with different dip angles of discontinuity has great influence on strength of rock mass. Two sets of discontinuities are considered in this section. The dip angle of discontinuity is 15°, 30°, 45°, and 60°, separately. Taken the measure point L5 as an example, the relationship between axial pressure and displacement is shown in Figure 16. The failure maps of rock samples are shown in Figure 17.

Relationship between displacement and axial stress under different combination of dip angles (L5).
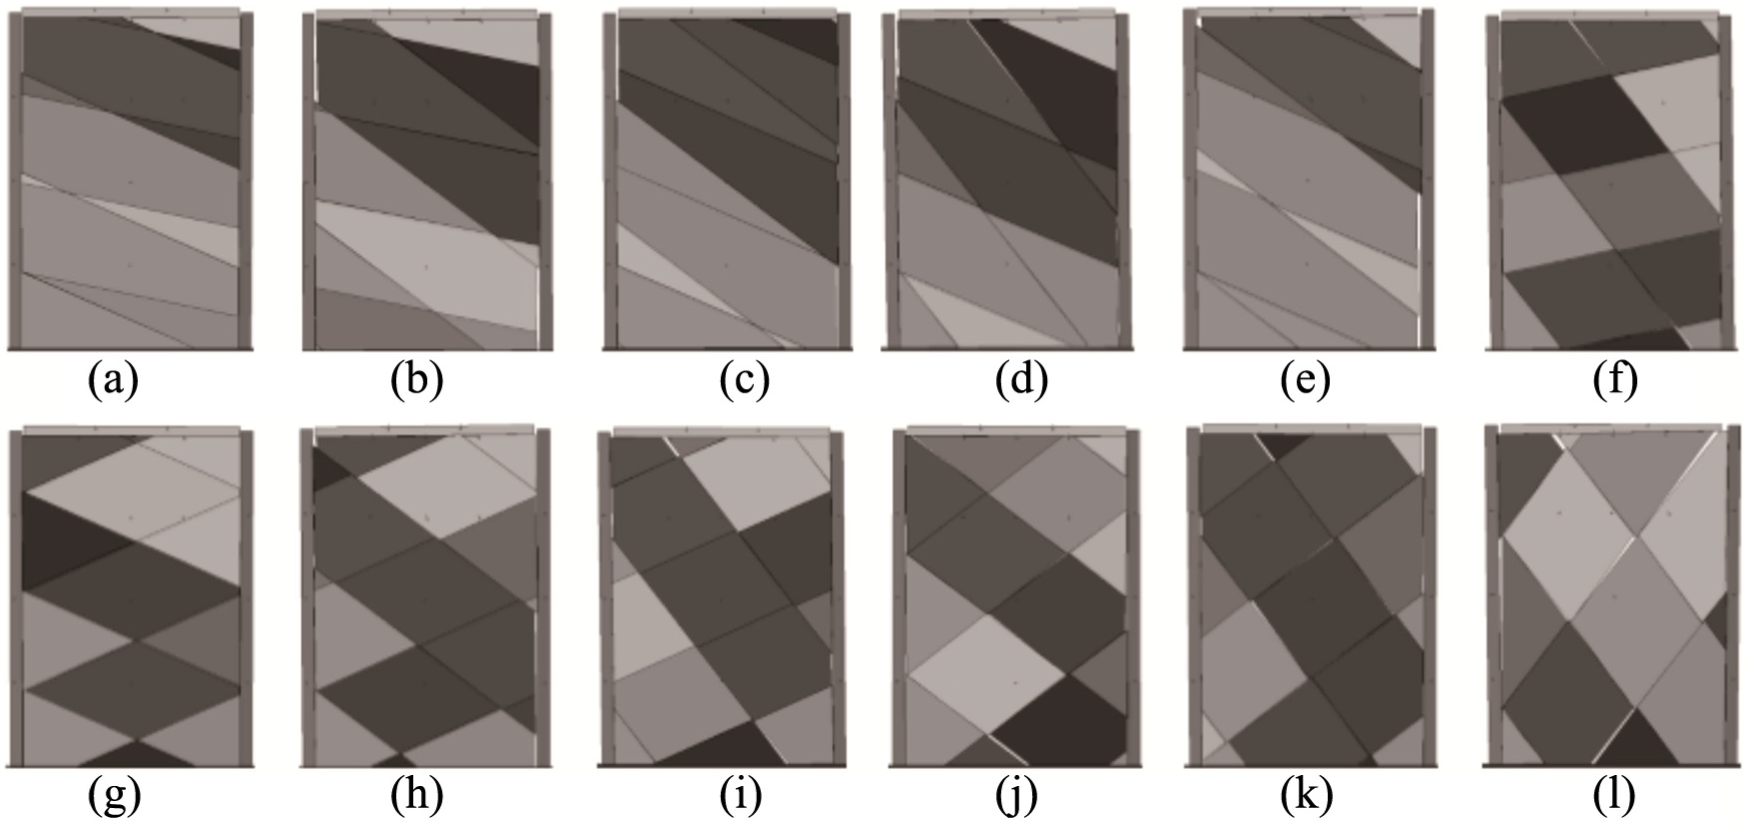
Rock failure maps under different combination of dip angles: (a) 15° to 30°, (b) 15° to 45°, (c) 30° to 45°, (d) 30° to 60°, (e) 45° to 60°, (f) −15° to 60°, (g) −30° to 30°, (h) −30° to 45°, (i) −30° to 60°, (j) −45° to 45°, (k) −45° to 60°, (l) −60° to 60°.
According to the Figures 16 and 17, the deformation of rock sample with different combination of discontinuity presents certain pattern. For same dip, the maximum strength appears at 15°–30°. The failure of rock mass mainly takes place in the rock mass. The discontinuity with dip angle being 30° presents minor displacement when the axial pressure reaches certain degree. The failure of rock mass is caused by rock failure and sliding along discontinuity. The strength of rock mass with combination of discontinuity being 15°–45° and 15°–60° decreases and their failure occurs along the greater dip angle. Comparing with the combination of discontinuity being 15°–60°, the strength of rock mass for combination of discontinuity of 15°–45° is bigger. For combination of discontinuity of 30°–45° and 30°–60°, the failure plane is along the greater dip angle. The discontinuity with smaller dip angle is relatively stable. The strengths for both of them are smaller than that of aforementioned combination for the discontinuity. The strength of rock mass of combination of discontinuity being 45°–60° is greater than that of rock mass with combination of discontinuity being 30°–45° and 30°–60°.
For two sets of discontinuities with opposite dip directions, the whole strength of rock sample is less than that of discontinuities with same dip direction. Generally, the failure plane of rock sample is along the discontinuity with greater dip angle, especially for the rock samples where there is greater difference in the dip angles. The strength of rock sample with discontinuity combination being −30° to 30° is more than that of rock sample with discontinuity combination being −30° to 45° and −30° to 60°. According to Figure 17, it can be observed that some fissures appear in the rock samples. The strength of rock samples with larger dip angle is greater than that of rock samples with low dip angle obviously. At the same time, the fissure development appears in case of two sets of discontinuities, while it does not appear in case of one set of discontinuity and this is the main reason why the strength of rock sample with two sets of larger dip angle discontinuities is low.
To sum up, there is a close relation between rock sample failure and dip angle for two sets of discontinuity combination. In this test, the rock sample with dip angle being less than 30° is relatively stable. The strength of rock sample with moderate dip angle is lower, especially for the rock sample with opposite dip direction discontinuities.
Three sets of discontinuities with different strength parameters
Two kinds of discontinuity combinations are selected to study the deformation and failure behavior of rock sample in this section. Three sets of discontinuities are included in every rock sample and the strength parameters of every set of discontinuity are different. Table 3 shows their strength parameters with different discontinuity combinations.
Strength parameters of discontinuity with different combinations.
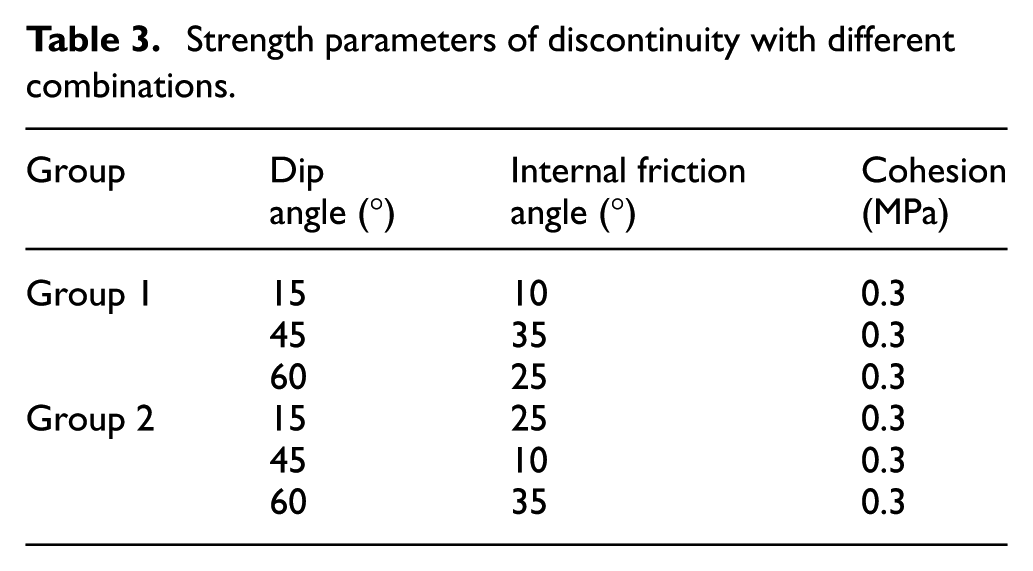
The measurement points L2, L5, L7 for group 1 and L2, L3, L5 for the group 2 are selected to monitor the displacement change with axial pressure. The relationship between axial stress and displacement is shown in Figure 18.
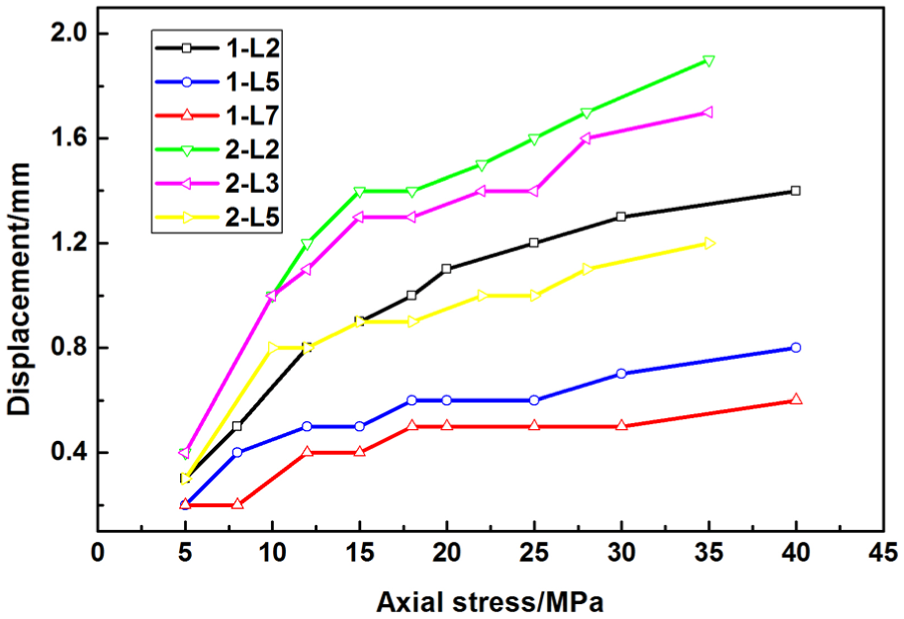
Relationship between displacement and axial stress under different combination of dip angles.
Based on Figure 18, the strength of sample of group 1 is observed to be greater than that of group 2. The strength of group 1 is about 20 MPa and that of group 2 is about 15 MPa.
Figure 19 shows the failure processes of the rock samples. It can be observed that three sets of discontinuities have great influence on the shape of rock blocks in the samples. For set 1, the strength of discontinuity with dip angle of 15° is low and the strength of discontinuity of dip angles 45° and 60° is high. According to Figure 18, the displacements at monitoring points are small when the axial stress is small and the deformation behavior in rock block is plastic in nature. The embedded phenomenon does not appear between rock blocks. With the increase in axial pressure, the sliding takes place in the rock block. The sliding process takes place along the discontinuity with dip angle being 60° in the initial stage. Then the sliding process occurs along the discontinuity with dip angle of 15° due to its lower shear strength. Finally, the failure of the whole rock sample takes place. For the sample with the second discontinuity set, the strength of dip angles 15° and 60° is very high and that of 45° is low. The deformation of rock sample belongs to plastic deformation in the initial stage. The failure process of rock sample occurs along the discontinuity with dip angle 45°initially. The discontinuity with dip angle 60° has no change with the increase in axial pressure. The failure of rock sample happens suddenly when the axial pressure reaches certain degree. The failure plane of rock sample is along the discontinuity with dip angles 45° from initiation to end. Therefore, the failure of rock samples depends on the dip angle and strength parameters of discontinuity. If the discontinuity with low strength and adverse dip angle (moderate dip angle) appears in the rock mass, the strength of rock sample is very low. The failure process of rock mass depends on this discontinuity.

Failure processes of rock samples: (a) group 1 and (b) group 2.
Case study
In this section, a water conveyance tunnel in Jurong pump-storage hydropower station in China is selected as a study area (Figure 20). The hydropower station is located in east of Nanjing city, Jiangsu Province, China. The dam project is composed of concreted faced rock-fill dam. Upper storage reservoir dam is about 172.0 m high and lower storage reservoir dam is about 35.0 m. Designed upper reservoir storage is about 1.461 × 10⁷ m3 corresponding to a water level of 263.5 m and lower reservoir storage is about 1.411 × 10⁷ m3 corresponding to a water level of 82.1 m. A water conveyance tunnel of length 667.55–692.73 m was proposed. The water conveyance system is situated in the southwest part of the Tanglun anticline, encompassing four different formations, namely, the Sinian Upper Series Dengying formation (Z2dn) for which the predominant lithology is dolomite, the Cambrian lower Series Mufushan formation (∈1 m) for which the predominant lithology is argillaceous dolomite, the Cambrian lower Series Paotaishan formation (∈1p) for which the predominant lithology is dolomite and limestone, and the Cambrian Middle and Upper Series Guanyintai formation (∈2–3gn) for which the lithology includes dolomite with limestone. Water conveyance tunnel runs across the Lun Mountain from North to South. The lowest and highest altitudes for the tunnel are about 97.7 and 300.0 m, respectively.
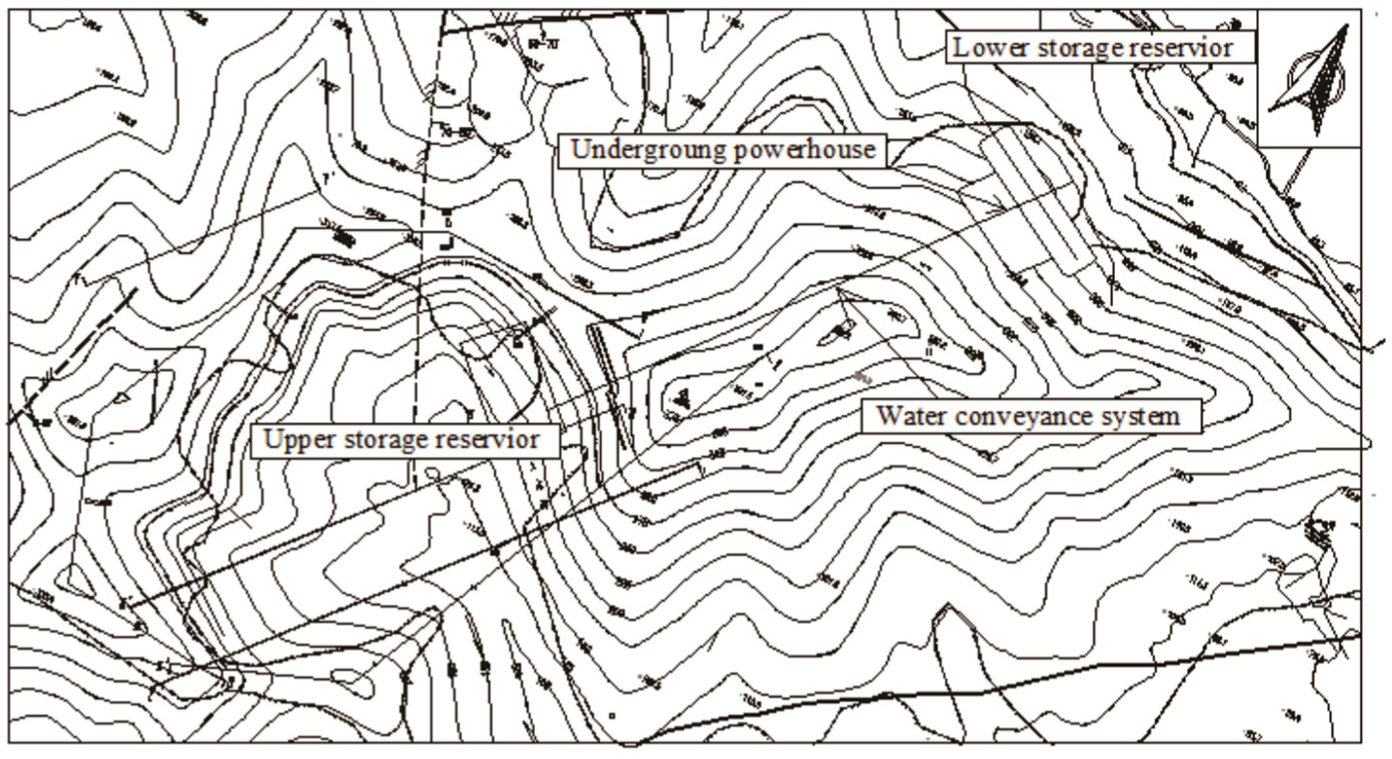
Research region.
Characteristics of discontinuity in the study area
Based on the survey and analysis of geometrical characteristics of discontinuity in the field, the stretch of discontinuity is about 1–3 m, which is poor. The aperture is about 0.5–5.0 mm and the spacing of discontinuities is 10–60 cm. The weathering degree is weak to moderate. The surface morphology of the discontinuity is plane and smooth. And no ground water seepages observed from the discontinuity. These characteristics show the intactness of rock mass as very good. Figure 21 shows the characteristics of rock mass in the water conveyance tunnel.

Characteristics of rock mass in the water conveyance tunnel: (a) entrance to the tunnel, (b) in the tunnel, and (c) side wall.
The geometrical characteristics of discontinuities are analyzed by using probabilistic and statistical methods. Based on the analysis results, there are five sets of discontinuities in the study area and orientations of discontinuities follow normal distribution. The results are shown in Figure 22 and Table 4.

Orientation statistics of discontinuity: (a) dip direction, and (b) dip angle.
Confidence interval of discontinuity orientation.

The spacing of discontinuities follows a negative exponent distribution. The confidence interval of spacing is 43–53 cm and trace of discontinuity is about 2–5 m. Dip angle of discontinuity in this area is high and most of them are bigger than 70°. The results are shown in Figure 23.

Rose graph of discontinuity.
Identification of strength parameters of rock mass based on geometrical characteristics
According to the geometrical characteristics and strength parameters of discontinuities, the stability of surrounding rock in tunnel can be analyzed using DDA method. In the past study, the strength parameters for single discontinuity are uniform, which is in fact not consistent. The same discontinuity can be assigned different parameters using DDA program which means the strength parameters of discontinuity can be assigned randomly. It is very reasonable for the same discontinuity with different properties. Due to the presence of a number of discontinuities in the rock mass and limitations in the calculation ability of the computer, it was impossible to consider all the discontinuities in the rock mass to calculate the stability of tunnel. To overcome these limitations, the calculation elements in the rock model should be selected properly so as to guarantee the veracity of numerical modeling results. Based on the report of engineering geology survey, the weight of rock mass in the study area is 27–28 kN/m3, the Poisson ratio is 0.15–0.3, and the elastic modulus is 5–8 GPa. The strength parameters of discontinuity are c = 0.06–0.2 MPa and φ = 20°–30°.
To avoid the boundary effect of the model, the size of numerical model is 40 × 30 m, and the shape of tunnel is arch rectangular corresponding to the width and height of 4 and 6 m, respectively. The geometrical and strength parameters for five sets of discontinuities are considered in the DDA pro-procession program. The random discontinuities and blocks are generated as shown in Figure 24(a) and (b), separately.

Construction of numerical analysis model: (a) generation of random discontinuities and (b) generation of random blocks.
Through trial simulation, the average size of rock block is 0.4–0.6 m2. Because of the elastic nature of the rock block in the DDA method, its parameters include elastic modulus and Poisson ratio. Based on the aforementioned results, the rock samples corresponding to the size of 0.7 × 0.7 m are selected to conduct numerical simulation tests. The strength and deformation parameters can be obtained by analyzing the results of numerical simulation. The model of numerical test is shown in Figure 25 and the corresponding curve of axial stress and displacement is shown in Figure 26.

Model of numerical test: (a) initial state and (b) finish state.

Relationship between axial stress and displacement.
The confining pressure of the samples is 2.0 MPa. Three measurement points are selected for every sample to monitor the displacement of the sample under different axial pressures. According to Figure 26, the failure loads for every sample are 33, 25, 35, and 25 MPa, separately. The average compressive strength of the sample is about 30 MPa. Through monitoring the lateral displacement, the deformation parameters can be calculated using equations (4) and (5)


where ε1 is the axial strain and ε3 is the lateral strain; B = ε3/ε1.
The deformation parameters of the rock sample are E = 5.0 GPa and µ = 0.25. Based on the aforementioned calculation results, the rock block can be viewed as intact if the size of block is about 0.5 m2. The blocks in the DDA method are looked upon as elastic block and the strength parameters of discontinuities are assigned in the interface between blocks.
Stability evaluation of surrounding rock in the tunnel
Stability analysis of surrounding rock with different discontinuity combinations
Discontinuity combination has a great influence on the stability of the tunnel. The failure of surrounding rock is caused by discontinuities with weak strength and adverse combination of discontinuities. In this project, the reason of surrounding rock failure was studied by considering three kinds of combination of three sets of discontinuities, such as (1) orientation: 20°∠75°, spacing: 0.45 m, strength parameters: c = 16° and ϕ = 0.03 MPa; (2) orientation: 156°∠55°, spacing: 0.5 m, strength parameters: c = 22° and ϕ = 0.1 MPa; and (3) orientation: 336°∠80°, spacing: 0.52 m, strength parameters: c = 31° and ϕ = 0.2 MPa. In which, 1-1 to 1-2 presents one set of discontinuity; 2-1 to 2-3 presents two sets of discontinuities with their combination includes (1)(2), (1)(3), and (2)(3); and 3-0 presents three sets of discontinuities. Figure 27 shows the deformation map of surrounding rock of the tunnel.

Deformation of tunnel under different discontinuity combinations: (a) 1-1, (b) 1-2, (c) 2-1, (d) 2-2, (e) 2-3, and (f) 3-0.
In order to analyze deformation of surrounding rock, 14 monitoring points are set up at the surface section of the surrounding rock. Five monitoring points are setup on the top section, four monitoring points are setup on the left and right sidewall, separately, and three monitoring points are setup at the bottom of the tunnel (see Figure 28(a)). The displacements of monitoring points are shown in Figure 28(b).

Monitoring points and deformation of tunnel surrounding rock: (a) monitoring points and (b) deformation of tunnel surrounding rock.
According to Figures 27 and 28, deformation of surrounding rock is small under one set of discontinuity. In this case, the strength of discontinuity plays an important role to deformation and failure of surrounding rock. For the combination 1-1, the deformation is similar for all the monitoring points around the surrounding rock and the deformations are caused mainly by elastic deformation of the rock mass. For the combination 1-2, the deformation on the right sidewall is large because of the adverse combination of discontinuities on the right sidewall. Comparing with deformation of surrounding rock with one set of discontinuity, many small blocks generate in the surrounding rock. It does not mean deformation of surrounding rock is greater than that of aforementioned combination. The deformation of surrounding rock does not depend completely on the size of rock blocks but sometimes on combination of discontinuities. Both the combination 2-1 and 2-2 have discontinuity (1) which has low strength. Therefore, rock blocks will fall out of the surrounding rock. For the combination 2-1, two sets of discontinuities are adverse to support the stability of surrounding rock. There is a big difference in strength for two sets of discontinuities in the combination 2-2. The sliding pattern of the combination 2-2 is along the discontinuous plane with low strength. For the combination 2-3, the deformation of rock samples is very small due to great strength of two sets of discontinuities. In addition, despite rock blocks are very small due to the intersection of three sets of discontinuities in the combination 3-0, the deformation of surrounding rock is still small. The reasons are that there is no adverse combination of discontinuities or great strength for adverse discontinuities. Based on the aforementioned facts, the strength of rock mass mainly depends on combination patterns and strengths of discontinuities.
Stability analysis of surrounding rock with different alignments of tunnel
Due to the influence of discontinuity orientation, stability of surrounding rock will depend on the alignment of the tunnel. To find out the optimum direction of tunnel, the stability of the tunnel with different alignments will be analyzed by using DDA method. The burial depth of tunnel is supposed as 100 m and the direction of tunnel is divided per 5°. Figure 29 shows the typical deformation of tunnel with different alignments. In the figure, the solid line represents initial state of tunnel and dotted line represents final state of tunnel.

Deformation of tunnel surrounding rock: (a) better stability, (b) well stability, (c) general stability, and (d) poor stability.
There are different deformations for the tunnel with different directions. Table 5 shows the stability state of tunnel under different directions.
The stability of tunnel under different directions.

L: left wall; R: right wall; T: top; B: bottom.
According to Figure 29 and Table 5, there are small deformations for the tunnel with better stability. It can maintain the stability by itself and it need not to be supported. It indicates that the tunnel with this direction is stable. For the tunnel with general stability, small deformation appears in the surrounding rock. However, the blocks do not fall out from the top and sidewall of tunnel. For the tunnel with general stability, local blocks can fall out from the top and sidewall of the tunnel. It requires to be supported by random anchors, which is used to reinforce local unstable blocks. For the tunnel with poor stability, the deformation is very big and the tunnel needs reinforcement by systemic anchors. During calculation of tunnel models, the deformations of surrounding rocks are monitored simultaneously by setting up some monitoring points on the surface of the surrounding rock. The monitoring results are shown in Figure 30.

Deformation of surrounding rock under different tunnel direction: (a) left sidewall, (b) right sidewall, (c) bottom of tunnel, and (d) top of tunnel.
According to Figure 30, it can be observed that the deformation of left sidewall is greater than that of right sidewall. The left sidewall of tunnel with direction being N60°–70° and N160°–175° is unstable and that of tunnel with direction being N80°–90° is stable. For the right sidewall, the stability of tunnel with direction being N0°–10°, N60°–70°, and N160°–175° is poor, while it is stable for the tunnel with direction N80°–90°. The lower parts of the tunnel are more stable than the upper parts of the tunnel. As far as the section of tunnel top is concerned, three directions, such as N60°–70°, N125°–140°, and N155°–175°, are adverse to the stability of the tunnel, especially for the left side of tunnel top section. At the bottom section of the tunnel, big deformations with direction being N70°W–N5°W appear at two sides of the bottom section. Based on the aforementioned analysis, the optimum direction for the tunnel is N10°E–N55°E and N80°E–N5° W. However, the selection of tunnel direction does not depend on the geological factors completely. When the direction of tunnel is not the optimum one, it should consider the stability of tunnel based on the analysis results. In this project, the deformation of surrounding rock for the tunnel with direction N60°E–N70°E and N20°W–N5°W is relatively large. Hence, some reinforcement measures should be taken so as to guarantee the safety of tunnel during excavation. In addition, the stability of left sidewall is worse than that of right sidewall. It is consistent with the fact that the direction of tunnel is considered preliminary as 25°. It also proves that the DDA is an efficient method to select the direction of tunnel and evaluate its stability.
Stability analysis of surrounding rock with different tunnel shape
In actual water conservation and hydropower project, there are many tunnels with different shapes to meet the requirement of their engineering function. In this section, four kinds of tunnel shapes, such as circular, arch rectangular, rectangular and circular with flat bottom, were considered to analyze the stability of tunnels under the same discontinuity combinations. Five sets of discontinuities have the same strength parameters and the size of tunnel. Figure 31 shows the initial state and final state of the tunnel. Three monitoring points for every side are set up on the border of the tunnel (Figure 32).

Failure of tunnel surround rock: (a) circular, (b) arch rectangular, (c) rectangular, and (d) circular with flat bottom.

Monitoring points of tunnel surround rock: (a) circular, (b) arch rectangular, (c) rectangular, and (d) circular with flat bottom.
Figure 33 shows the deformation of surrounding rock for the tunnel with different shapes. The horizontal coordinate represents four kinds of tunnel shape using number 1, 2, 3, and 4, separately. According to Figure 33, the stability of the circular tunnel is better than that of the tunnel with other shapes. The stability of rectangular tunnel is worst compared to other tunnel shapes. The stability of tunnel with circular with flat bottom is worse than that of tunnel with arch rectangular. The reason is that the combination of discontinuities in this project is a main factor to influence the stability of the tunnel.

Deformations of monitoring points: (a) top and bottom of tunnel and (b) left sidewall and right sidewall.
Figure 34 shows the stress of surrounding rock for the tunnel with different shapes. According to Figure 34, there is no stress concentration phenomenon appearing in the surrounding rock for the circular tunnel. The size of broken rock zone is very small when compared with other tunnel shapes. However, the size of broken rock zone is great for the tunnel with arch rectangular and rectangular shapes. The stress in the top section is mainly tensile stress. For all the tunnels with different shapes, there is no stress concentration phenomenon which is different from the results with other continuous media analysis method. The reason is that DDA is a DDA method. The results based on DDA fit more close to the actual engineering conditions than other analysis methods.

Stress of surrounding rock under different tunnel shapes: (a) circular, (b) arch rectangular, (c) rectangular, and (d) circular with flat bottom.
It should be noted that since the hydropower station in the study case is still in construction, the simulated tunnels are the exploration adits which are used to detect geological conditions but not the permanent tunnels. These tunnels do not need to be monitored. So, there is no monitoring data. But, according to the position of the falling block around the tunnels, the simulation results are in good agreement with the actual situation in the field.
Conclusion
The failure mechanism of rock mass is evaluated by analyzing the influence of discontinuity combinations on the strength of rock mass in this article. By utilizing the ways of laboratory tests, the failure law and strength of rock mass are analyzed from the perspective of dip angle, spacing, and number of discontinuity. The deformation and failure mechanism of rock mass with different dip angles, spacings, strength of discontinuities, and combinations of discontinuities are analyzed using DDA method. In addition, considering a water conveyance tunnel in Jurong pump-storage hydropower station as an example, the direction of tunnel is optimized and stability of the tunnel is examined. The conclusions are listed as follows:
Based on the results of laboratory and numerical simulation tests, the dip angle of discontinuity has great influence on the strength of rock mass. When the dip angle is low and high, the rock mass is damaged, but not along the discontinuous plane. When the dip angle is moderate, the failure plane is observed along the discontinuous plane. The rock mass with greater spacings of discontinuity has great strength due to well intactness of rock mass. When the dip angle is low and high, the influence of spacing on the strength is small. On the contrary, when the dip angle is moderate and spacing is small, the strength of rock mass is very low. The results indicate that spacing of discontinuity increases the scope of rock mass failure along the discontinuous plane. Similarly, the strength of discontinuity has great influence on the strength of rock mass. Generally, the strength of rock mass will increase with the increase in the strength of discontinuity. However, the strength of rock mass relates not only to the strength of discontinuity but also to the geometrical characteristics and combination characteristics of discontinuities.
The deformation behavior and failure mechanism of the rock mass with combination of discontinuities are very complex. The strength of rock mass will decrease obviously. Especially for the discontinuity with opposite dip direction, the rock mass presents remarkable reduction effect. The adverse conditions to the rock mass in terms of strength, spacing, dip angle, and combination characteristics of discontinuities are some crucial factors to the strength and deformation of rock mass.
Considering a water conveyance tunnel in Jurong pump-storage hydropower station in China as an example, the stability of the tunnel is evaluated. The failure of the surrounding rock in the tunnel is related to the free face, slip face, and weak discontinuities in the rock mass. In addition, the optimum tunnel directions such as N10°E–N55°E and N80°E–N5°W are obtained by analyzing the stability of tunnel under different directions. At the same time, the adverse tunnel directions such as N60°E–N70°E and N20°W–N5°W are also obtained. Besides, the influence of tunnel shapes on the stability of tunnel is also examined. Based on the results, it can be stated that the tensile stress appears in the top section of the tunnel. The circular tunnel will cause small broken rock zone in comparison with other tunnel shapes. The unstable parts for different tunnel shapes are also obtained. It provides a basis to the selection of tunnel direction and also attention to the potential unstable parts of the tunnel.
Footnotes
Acknowledgements
The authors gratefully acknowledge M.S. Wei Shi and Yinlong Han in School of Earth Sciences and Engineering, Hohai University, China, for their contribution to the laboratory test.
Handling Editor: Michal Kuciej
Declaration of conflicting interests
The author(s) declared no potential conflicts of interest with respect to the research, authorship, and/or publication of this article.
Funding
The author(s) disclosed receipt of the following financial support for the research, authorship, and/or publication of this article: This research work was supported by the Natural Science Foundation of China (grant numbers 41672258, 41102162, and 41472241) and the Fundamental Research Funds for the Central Universities (grant numbers 2016B05914).