
Abstract
To improve the effectiveness and efficiency of bit cutter design, a new reverse design method is put forward based on the geometry of a polycrystalline diamond compact bit. The polycrystalline diamond compact bit design parameters (cutter parameters and polycrystalline diamond compact bit profile) are calculated based on the data obtained by three-dimensional scanning technology. The main calculation work is realized using MATLAB. Compared with using point cloud data, using the three-dimensional model based on calculated cutter parameters also provides accurate results. Then, the cutter parameters are optimized according to the minimum lateral force principle, minimizing the maximum wear rate principle. The lateral unbalance force of the bit decreases from 7.55%, for the original bit, to 3.17%, for the optimized bit, and the wear of the optimized drill bit is more uniform. The field data show that the optimization models create bits with a longer life and a higher rate of penetration.
Introduction
A polycrystalline diamond compact bit is referred to as a PDC bit. The PDC cutters on a PDC bit are used to shear rock with a continuous rotary motion. The shear strength of rock is usually lower than its compressive strength. Therefore, in soft formation drilling, PDC bits have a high rock breaking efficiency. With the improvement of material technology and PDC bit design technology, PDC bits are increasingly applied in hard formation drilling. In recent years, PDC bits were the industry’s workhorse, accounting for approximately 75% of the total footage drilled in worldwide oilfield applications. 1
The design variables of PDC cutters are the core of the bit design and include cutter size, cutting angles, number of cutters, cutter distributions and bit profile. In the past, to extend the life of the drill bit as much as possible, the main principles for designing PDC bits were focused on balancing the cutting volume, cutting power and wear amount of each cutter as much as possible. 2 With the development of PDC bit dynamics, some researchers have proposed force-balance PDC bit design principles.3,4 The interaction model between drill and rock is the basis of these design principles. Many scholars have studied the interaction model between drill and rock through theory, experimentation and simulation.5–8 Based on the interaction model between bit and rock and the design principle of the cutter layout, some scholars have studied the design and optimization of PDC bit cutter layout. Liu and Jun-Li 9 based on utilizing ANSYS APDL optimize the angle of PDC bit cutters to ensure the strength of the PDC bit. Based on the equal cutting volume principle, Song et al. 10 optimize the location parameters of PDC cutters. Chen and colleagues11–13 put forward a series of cutter layout methods to adapt to different working conditions; his main idea is that cutters of a PDC bit are divided into several groups when laid out in a circular direction. Each group of cutters form a force-balance system, so the lateral force of the bit is very small. Experience has shown that using a force-balance design method to lay out cutters can improve the performance of the drill bit.
For some used PDC bits, according to the bit performance, it is possible to predict the performance of the same PDC bit in a similar stratum. It is very important to use the technology of reverse engineering to rapidly obtain the design parameters. For a PDC bit with good performance, reverse design can be used to analyse its effectiveness. The calculated design parameters could reflect the design philosophy and should be recorded in the database with the stratum parameters. For a defective PDC bit, which cannot provide an ideal performance, the calculated design parameters should be optimized. Therefore, the optimization model and reverse design of a PDC bit can improve the effectiveness and efficiency of PDC bit design. Moreover, the reverse design of cutter parameters can detect machining errors of the drill bit.
Previous research on reverse engineering mainly includes data processing and reconstruction of computer-aided design (CAD) models. The focus of this research is the reconstruction of a complex CAD model, such as a three-dimensional (3D) surface reconstruction;14–16 in contrast, the geometric model of a conventional PDC cutter is simple. Efforts should be focused on how to calculate design parameters accurately. Reinstating initial design parameters is the premise of optimization design.
In this article, we use 3D scanning technology and the principle of PDC bit geometry to develop reverse design technology for PDC bit parameters and optimize the reverse parameters according to the design principle of the bit.
Rationale
Geometry model of a PDC cutter
Generally, a PDC cutter can be simplified as a cylinder. In mathematics, a cylinder can be described by four parameters: centre point, face vector, radius and height. In the design of the drill bit, more parameters are used to directly represent the mechanical properties of cutters. A PDC cutter is often described in a reference point coordinate system (cylindrical coordinates) by a normal angle, side rake angle, back rake angle, radius and length. The reference point is the fixed point for the rotational operators. If the reference point is not the centre point of the cutter, another parameter is used to describe the position of the reference point. In this article, this parameter is called the offset distance. The mathematical description and engineering description of a PDC cutter can be linked; their relations can be represented by a series of orthogonal transformations. The parameters of the initial cutting plane are shown in Figure 1 and Table 1. The processes of the orthogonal transformations are shown in Table 2.

The parameters of the initial cutting plane.
Parameters of initial cutting plane.

Processes of the orthogonal transformations.

In Tables 1 and 2,
For every translation step, the rotation axis vector remains unchanged, while for every rotation step, all the rotation axis vectors are changed by the left multiplicative transformation matrix. The final outer normal vector and reference point coordinates are as follows
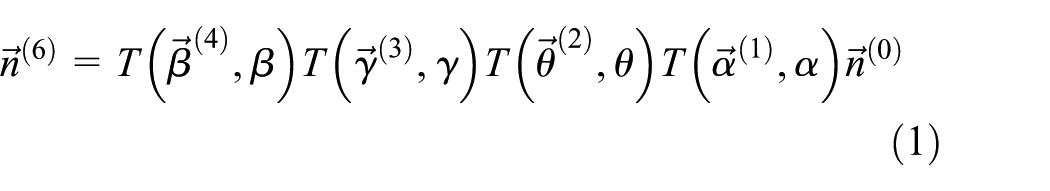
The product of the unit axis vector and corresponding angle is called the rotational vector. It is convenient to calculate the rotation matrix using the rotational vector 17


where T denotes the rotation matrix,
3D scanning technology
3D scanning technology uses an optical principle and device to obtain 3D coordinate information of the surface of an object. Its output data are point cloud data. After handling the point cloud data, the CAD model is reconstructed.
The efficiency and practicality of optical 3D scanning technology is greater than that of a coordinate measuring machine (CMM). Although the precision of a CMM is higher, the number of measurement points is limited. Due to the manufacturing error, solder layer, impact failure and wear, the reconstruction model cannot meet the expected accuracy requirements due to the limited number of measurement points. In contrast, the accuracy of 3D scanning technology has reached 0.01 mm. This article used 3D scanning technology for data acquisition of the PDC cutters. The 3D scanning device used is a Creaform HandySCAN 3D 700, which is an efficient, portable 3D scanning device (Figure 2). Its main technical parameters are shown in Table 3. It is convenient for on-site measurement and timely recording. Before measurement, the device can be calibrated to ensure the accuracy of the output data. The output data are provided in multiple formats. In our research, stereolithography (STL) is the file format used for the output data. The STL file includes the handled and packaged point cloud data.

Creaform HandySCAN 3D 700.
Main technical parameters of a Creaform HandySCAN 3D 700.

Technical method
The method consists of three steps: creation of a reconstruction model, calculation of design parameters and optimization design of the cutters. The reconstruction model rebuilds the CAD model of the PDC cutters based on the data obtained using the 3D scanning technology. Then, the design parameters can be solved by the mathematical equation based on the reconstruction model. The cutter parameters are calculated efficiently and accurately. According to the actual drilling parameters and failure conditions, the cutter parameters are optimized by the optimization model. The reverse design and optimization design processes of PDC cutter parameters are shown in Figure 3.
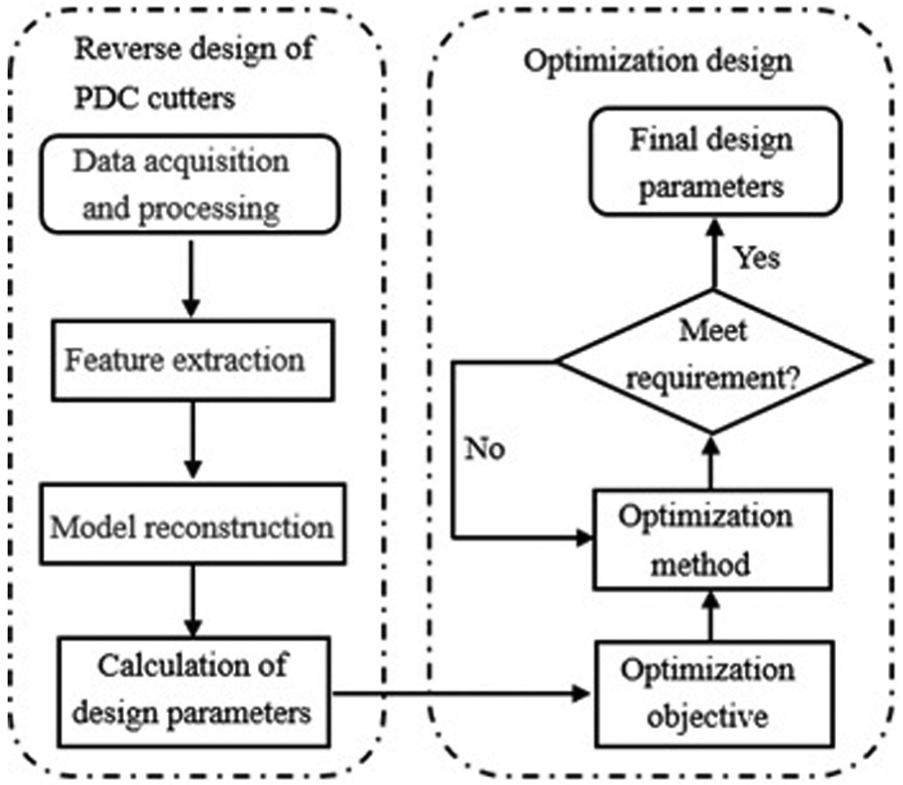
The reverse design and optimization design processes.
The method of reverse design for PDC cutters
Extracting the geometric features of cutters
It takes approximately 10 min to measure a PDC bit with the HandySCAN 3D 700. With this 3D scanning device, the output data are point cloud or STL data. The output STL Model 1 can be imported in reverse design software (Geomagic Design X) to extract the geometric features of the cutters.
First, the global coordinate system of the drill bit is established. The central axis of the PDC bit is fitted by the Design X software; the Z axis is the central axis of the drill bit. According to the right-hand rule, the rectangular coordinate system OXYZ is established.
Second, the geometric features of the cutters, which are cylindrical PDC cutters, are extracted to the coordinate system. As show in Figure 1, the cutting edge is in the cutting plane. The cutting plane can be fitted on the cutter surface in the STL model by a function provided in Design X. Although some impact failure of the cutters on the bit occurs, a part of the cutter surface is intact. The cutting plane can be fitted through the intact surface. The cutting edge of the PDC cutter is a circle. In the cutting plane, the profile curve is fitted by a function provided in the software. In general, only a few cutter diameters, such as 13.44, 15.88 and 16 mm, are used in PDC bit design. Then, according to the diameter and height of the cylinder, the cutter type is matched. In 3D, an arc represents the cutting edge of the cutting plane, while a cylinder represents the PDC cutter.
Taking a six-bladed PDC bit as an example, the PDC bit is measured by the 3D digitizer (Creaform HandySCAN 3D). The features of the cutter profile and cylindrical cutters in the STL model are shown in Figure 4. The new STL Model 2 of the cutters is established from the cylinders (cutting edges).

The model of PDC bit cutters.
The model reconstruction of PDC cutters
An STL model of cutters can be imported into MATLAB by some MATLAB functions. In an STL file, every 3D model is described as a series of raw and unstructured triangulated surfaces by the unit normal vector and vertices (ordered by the right-hand rule) of the triangles using a 3D Cartesian coordinate system. The unit normal vector and vertices of every triangulated surface are obtained by reading the STL file. According to the geometric characteristics of the PDC cutters, the cutter density (number of cutters), the cutter size (the radii of the cutters) and the position parameters (the centre coordinates) are obtained by MATLAB functions.
According to these parameters, a CAD model can be reconstructed by Unigraphics NX (UG) [Siemens PLM Software]. Comparing the STL Model 2 with the CAD model, the average 3D deviation distance of each cutter is obtained by Geomagic Qualify software. For the example of the six-bladed PDC bit, the average 3D deviation distance of the cutters on the blade is shown in Figure 5. The average deviation of the six cutters ranges from +0.06 to –0.08 mm. Considering the existence of the welding layer and wear on the surface of the bit, the reconstructed CAD model is in accordance with the accuracy requirement in the reverse engineering.

Error analysis of reconstruction model.
The calculation of cutter parameters
According to the above analysis, the radius of the cutter and the centre coordinates and outer normal vector of the cutting plane are obtained. However, the spatial direction of the cutter is also described by the azimuth angle, normal angle, back rake angle and side rake angle. 7 How to accurately calculate the cutting angles is the key to obtaining the design parameters of the cutters. Considering different design benchmarks (e.g. the cutter’s rotation reference point is not the same point as the centre point of the cutter), calculation of these parameters becomes difficult.
The calculation of cutting angle
According to the above workflow, the mathematical description of the cutter parameters is obtained. To calculate the normal angle, side rake angle, back rake angle and azimuth angle, the bit profile needs to be calculated first. If the offset distance is zero, a smooth curve through all the centre points can be treated as the bit profile, if not, the bit profile is a smooth curve through all the reference points. However, the reference point coordinates are unknown. In this case, the iterative method and optimization method are used to calculate the angles; a flowchart of these processes is shown in Figure 6.

Flowchart of the calculation of cutter parameters.
The offset bit profile is obtained by offsetting the centrelines of all cutters several times. At the first offset curve, d1 is the offset distance. Then, a constant is used as the offset distance. For each offsetting, the offset direction is the average of the two adjacent point offset directions. Therefore, the curve becomes smooth after offsetting, as shown in Figure 7. The reference point is the point that creates a minimum distance to the offset bit profile, and the normal angles increase from the bit centre outward. The reference points are calculated and shown in Figure 8.

Offset crown curve.

Calculation of reference points.
Taking Bit 1 as an example, the normal angle, back rake angle and side rake angle are calculated in MATLAB. The normal angle, back rake angle, side rake angle, number of cutters, radii of the cutters and centre coordinates are used as modelling parameters. The CAD model (Model 3) of the cutters is established in UG. Comparing Model 3 with Model 2 (reconstruction model of the PDC cutters), the average 3D deviation distance of the cutters is obtained by Geomagic Qualify software. 16 The results can verify the accuracy of the cutting angles. The average 3D deviation between Model 2 and Model 1 is shown in Figure 9. The average deviation ranges within ±0.0004 mm. Therefore, the calculated cutting angles are highly accurate. The results verify the effectiveness of the calculation method.
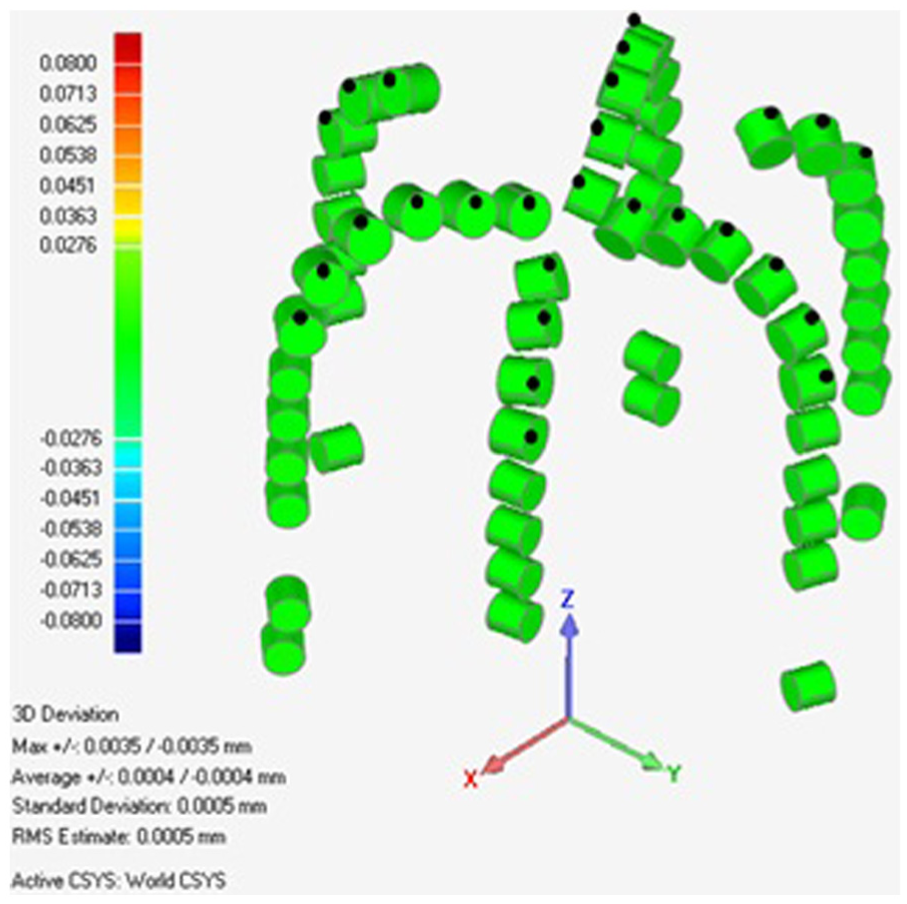
Error analysis of calculated cutting angles.
The reconstruction of PDC bit profile
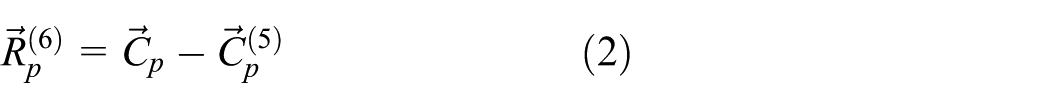
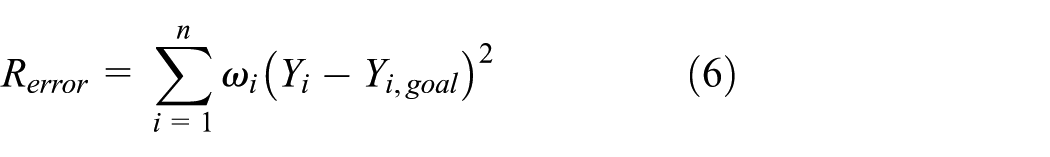
The bit profile reflects the coverage of all the cutters at the bottom of the hole. According to the reference point coordinates, the bit profile is calculated by theorems for calculus of variations. 18 Through the rotation projection, all reference points are projected onto the plane XOZ. By orthogonal transformation, the first and last reference points are on the X axis. At this step, the bit profile is a continuous curve. The error function can be defined as follows

However, only the
The function Y can be written as follows
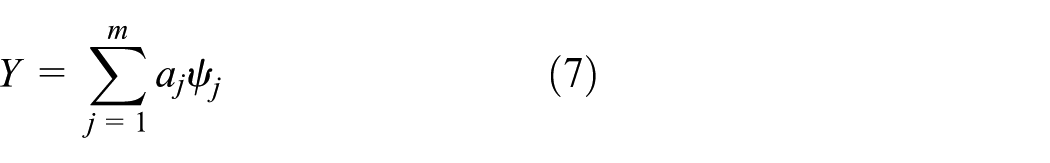


Therefore, an orthogonal trigonometric function system, such as the following expression,
18
can be chosen for


Crown curve fitting results.
After determining the optimal curve of the bit profile, the reference point coordinates

where

Reference points and crown curve.
The design optimization of the bit
Cutter–rock interaction model
The cutter–rock interaction model is the core of bit evaluation and optimization. To calculate the cutting force, the cutter geometrical parameters should be calculated. In this article, the cutter geometrical parameters are calculated by the method described in Chen. 19 The axial force and cutting force of the cutter are calculated according to the cutter geometrical parameters and the rock compressive strength. The formulas are as follows 5


where
If the cutter is worn, the calculations of the axial force and cutting force of the cutter need to be corrected. The corrected axial force and cutting force are calculated as follows 21

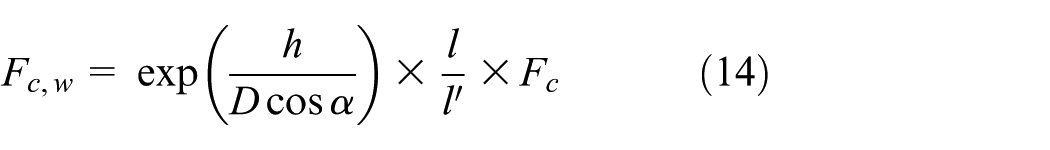
where
Wear rate prediction model of a cutter
Cutter wear has a significant impact on the life of a drill bit. Abrasive wear is the main wear form of PDC bit cutters. 22 The Rabinovich model is a classic abrasive wear model. According to the Rabinovich model, cutter wear rate is determined by the loads acting on the cutter and the properties of the rock and cutter. Considering the working conditions of the drill bit, a prediction model of bit wear is obtained based on the Rabinovich model and verified by experiments. The prediction model of cutter wear rate is as follows 23

where
According to the analysis above and substituting formula (13) into formula (15), the wear rate of the worn cutter is calculated as follows 23

Optimization model of wear rate
The cutter optimization model is established based on the wear rate prediction model. The location parameters (locating radius and axial height) and back rake angle of each cutter are optimized.
Through the method of Chen, 19 the effective cutting arc length, axial force and tangential force of each cutter can be calculated under the condition of the given cutting depth and cutter parameters.
Assuming that the drill bit has n cutters, the cutters are sequentially numbered from the core to the outside of the bit. The optimization model of the total wear rate is as follows

where
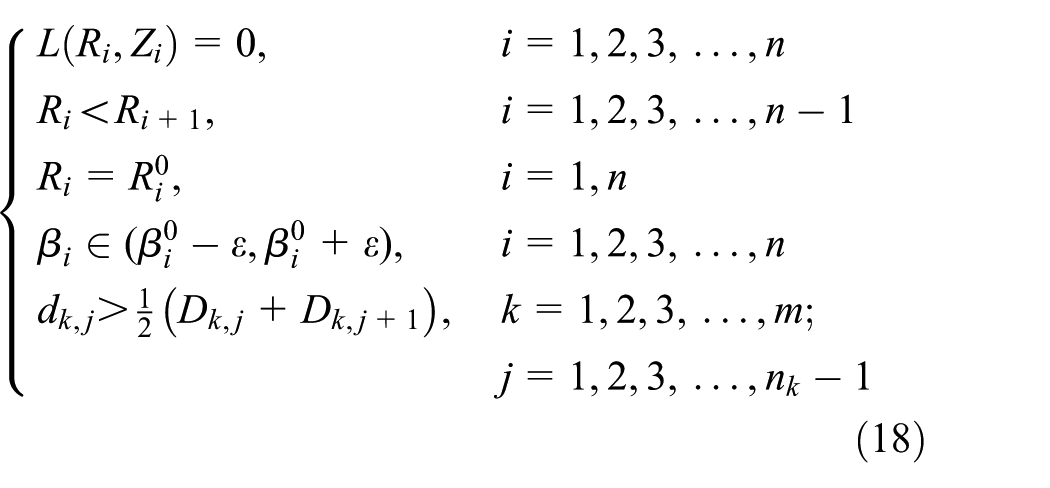
where
The above constraints have clear physical meanings. The first constraint represents the reference points on the crown curve. The last constraint condition ensures that adjacent cutters do not interfere with one other. Moreover, other constraints limit the scope of the decision variables.
Optimization model of lateral force
The theoretical and experimental results show that impact failure due to whirl is the primary cause of premature failure of PDC bits. The phenomenon of irregular change in the instantaneous centre of the bit is referred to as irregular whirl. The large lateral force acting on the drill bit causes irregular whirl at the bottom of the hole. With this large lateral force, the drill bit is in contact with the borehole wall. Therefore, the friction and scraping force cause reverse torque. The instantaneous centre and the motion state changes irregularly because of the large lateral force.
The unstable motion of the bit is caused by whirling, so the cutters are subjected to intense and irregular impact, resulting in impact failure of the cutters, and ultimately leading to premature failure of PDC bits. The rotation speed of the drill bit is also not stable due to the lateral force. Determining how to reduce the lateral force of the bit is the key to improving bit life.
PDC bit design optimization is achieved by varying a set of design variables for a set of predefined constraints. This article, however, focuses only on bit life. The theoretical results and field data show that the adaptability of the bit to the formation is determined by the bit profile, number of cutters, cutter density and cutter size. The cutting angles of the cutters have an important effect on the cutting force for a given set of formation properties.
The mechanical model of a PDC bit cutter is shown in Figure 12.


where


The force analysis diagram for a PDC bit.
According to formula (21), the total lateral force
Based on the geometry of the PDC bit, the azimuth angle of each blade can be evaluated by the azimuth angle of the first cutter on the blade. This relationship can be described as formula (23)

where
Assuming that

Optimization results
Two PDC bits are shown in Figure 13. Bit 1 is the original drill bit, and Bit 2 is slightly reversed and optimized, based on the properties of Bit 1. The results of the optimization are shown in Tables 4 and 5 and Figure 14. The lateral force percentage is reduced from 7.55% to 3.17%, from Bit 1 to Bit 2.

The two evaluated PDC bits: (a) Bit 1 and (b) Bit 2.
Azimuth angle of each blade.

PDC: polycrystalline diamond compact.
Mechanical performance comparison of PDC bits.

PDC: polycrystalline diamond compact; WOB: weight on bit.

Wear rate of Bit 1 and Bit 2.
For this analysis, both bits are used in actual drilling scenarios. The drilling location of Bit 2 is near the drilling location of Bit 1. The lithology and strata of the two wells are similar: the lithology is mainly composed of sandstone, and the strata is soft-to-medium hard. The drilling parameters are shown in Table 6. In addition, the drilling depth and rate of penetration (ROP) of the PDC bits are shown in Figure 15. The drilling time (bit life) of Bit 1 is 89 h, for a drilling depth of 459 m. The bit life of Bit 2 is 106 h, for a drilling depth of 563 m. The drilling depth of the optimized bit increases by 23% over that of the original bit, and the ROP improves by 3.7%.
The drilling parameters of the PDC bits.

PDC: polycrystalline diamond compact.

The drilling depth and ROP of the PDC bits.
As shown in Figure 16, the main failure form of Bit 1 is impact failure, and the main failure form of Bit 2 is wear. However, the wear of Bit 2 is very slight.
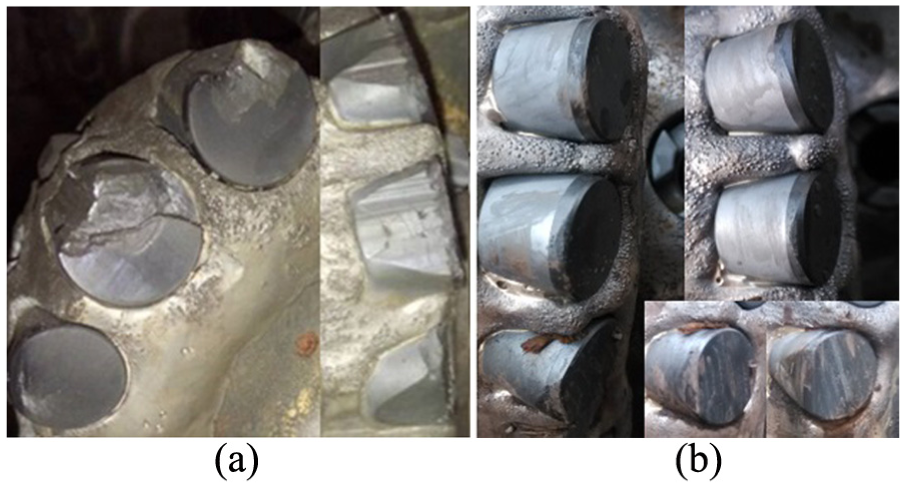
Wear condition of the two bits: (a) Bit 1 and (b) Bit 2.
The ROP of the optimized PDC bit improves due to the following reasons:
The initial unbalance force of the drill for Bit 1 is large, resulting in poor stability. In addition, the uneven wear of Bit 1 resulted in premature failure of some of its cutters, further aggravating the failure of the other cutters. The coupling of these factors ultimately leads to the low drilling efficiency of Bit 1.
On one hand, the movement of the optimized bit is relatively stable because of the smaller lateral unbalance force; on the other hand, all the cutters wear evenly in the wear rate optimization model, avoiding the shortening of the overall life of the drill bit due to excessive wear of several cutters.
Conclusion
This article integrates the reverse and optimization methods for PDC bit design. Based on the results of the reverse and optimization work and the field data, the following conclusions can be drawn:
The method of reverse design can determine the design parameters with high accuracy. According to the results, the manufacturing error of a PDC product can be analysed. In addition, the actual design parameters can be used in the optimization design. Furthermore, the method of reverse design can shorten the design cycle.
The lateral force optimization model improves the stability of a drill bit by reducing the lateral force of the drill bit. By optimizing the circumferential position of each blade, the azimuth angle of each cutter on the blade is optimized. Moreover, the proposed method is an effective method to minimize the total lateral force. The wear rate optimization model can effectively prolong the life of the optimized bit. Through optimization, the lateral force of the drill bit decreases from 7.55% to 3.17%, and the wear around the drill bit is more even. According to the field data, the bit life and drilling distance of the optimized PDC bit have been improved. The drilling depth of the optimized bit increases by 23% over that of the original bit, and the ROP similarly improves by 3.7%.
Footnotes
Handling Editor: David R Salgado
Declaration of conflicting interests
The author(s) declared no potential conflicts of interest with respect to the research, authorship and/or publication of this article.
Funding
The author(s) disclosed receipt of the following financial support for the research, authorship and/or publication of this article: This work was supported by the National Major Projects of Oil and Gas of China (2016ZX05038-005-LH001).