
Abstract
The article examines the behavior of flexural reinforced concrete members, strengthened with fiber-reinforced polymers (FRP), under the ultimate loading conditions (in fracture stage). One of the main problems of such elements is sudden and brittle failure mode caused by FRP debonding. The method for the calculation of load-bearing capacity of the normal section of flexural reinforced concrete members, strengthened with various types of FRP, is proposed in this article. This method is based on the theory of fracture mechanics of solids. The reduction of overall member stiffness due to the slip between concrete and FRP is estimated by reducing the FRP stress according to the built-up bars theory. Such reduction allows the prediction of load-bearing capacity of strengthened members sufficiently precisely even for sudden and brittle FRP debonding failure mode. The numerical results are compared with experimental ones. In total, 55 reinforced concrete beams, strengthened with externally bonded or near surface mounted carbon fiber-reinforced polymer and glass fiber-reinforced polymer sheets, plates, strips, and rods, are analyzed in this comparison. Experimental results were collected from various scientific publications. A focus is made on the depth of the crack in critical normal section and FRP strain–stress relationship.
Introduction
There are many buildings, bridges, and other structures worldwide in bad or even critical condition. Such condition could be caused by aging, poor maintenance, corrosion, design, and construction mistakes. Therefore, the strengthening of such structures is often required. The use of fiber-reinforced polymer (FRP) materials for the strengthening of reinforced concrete (RC) structures became quite popular since its development in 1980s.1–4 FRP materials are lighter and easier to install in comparison to the traditional strengthening materials such as concrete jackets, and steel plates. The use of FRP leads to the reduction of labor cost, although the cost of material itself is higher. FRP materials are thin (good for esthetical and design requirements) and more resistant to corrosion in comparison to the steel (durability requirements).5–16 Three common types of fibers are used for FRP systems: aramid, carbon, and glass fibers.1,6,8,17,18 Glass fiber–reinforced polymer (GFRP) is the most popular type for its low cost, but more-expensive carbon fiber–reinforced polymer (CFRP) gains the popularity for its higher strength and tensile modulus of elasticity. Generally, we can classify FRP systems into two categories: externally bonded reinforcement (EBR), when FRP sheets, plates, or strips are bonded to the surface of the concrete; and near-surface-mounted (NSM), when circular or rectangular FRP bars or strips are installed and bonded in the grooves of the concrete surface.19–30
Seven typical failure modes could be distinguished for RC structures strengthened with FRP: 18 (1) flexural failure caused by FRP rupture, (2) flexural failure caused by crushing of compressive concrete, (3) shear failure, (4) separation of concrete cover of tensile reinforcement, (5) interfacial debonding in FRP plate end, (6) interfacial debonding caused by flexural crack in midspan of the beam, and (7) interfacial debonding caused by intermediate flexural shear crack. Failure mode caused by FRP rupture (mode 1) is appreciated, because, in such case, the full strength of FRP would be used. The most common failure modes are related to sudden and brittle FRP debonding (modes 4–7).18,31,32
The prestressing of FRP could be a solution for the use of full potential of high tensile strength of FRP.9,33 Other benefits of prestressing FRP are reduced deflection, controlled cracks, restored prestress losses in a prestressed concrete beam, higher concrete cracking and tensile reinforcement yield loads of strengthened beams, and stress redistribution.8,34–40 For the practical applications in the field, it is easier to prestress FRP sheets/plates by bonding them to concrete surface (EBR)27,35–40 in comparison to prestressing FRP rods/strips installed into the grooves on the concrete surface (NSM).19,22,24 Moreover, it is necessary to access the ends of the beams in order to use the prestressing devices when strengthening by NSM method. In many cases, such access is limited or not possible at all. However, no matter which strengthening method is chosen, the main problem will be FRP debonding failure modes. Debonding can be delayed or prevented by anchoring the FRP composite in the interface zones where debonding is expected to initiate.1,41 There are several most common anchoring systems for FRP: FRP spikes (for externally bonded sheets), transverse wrapping (wrapping the beam with FRP clamps), transverse strips (FRP strips bonded in transverse direction), interlocking grooves (grooves made on concrete surface in transverse direction and filled with epoxy resin), and steel plates (plates bolted to the beam).1,11,17,42–44 Most researchers found out that FRP anchors shown the best results in delaying/preventing debonding or minimizing the slippage between concrete and FRP.
This article deals with the assessment of fracture stage of flexural reinforced concrete structures, strengthened with FRPs. The science of fracture mechanics allows us to analyze the start of fracture of flexural reinforced concrete beams by evaluating the critical parameters of normal cracks. The method for the calculation of normal section load-bearing capacity of flexural RC members, strengthened with different kinds of FRP, is proposed in this article. The method is based on fracture mechanics of solids. Numerical results are compared with experimental ones from the tests of 55 RC beams, strengthened with CFRP and GFRP sheets, plates, strips, and rods, mounted by EBR or NSM methods. The experimental results are collected from different scientific publications.19,20,22–27 A focus is made on the assessment of crack depth of critical normal section and evaluation of FRP strain–stress relationship. The stiffness of strengthened flexural RC members is reduced because of the slippage between concrete and FRP. Such reduction is evaluated by reducing the stress in FRP through built-up bars theory.45–49
Load-bearing capacity of flexural RC members strengthened with FRP
Flexural strength of RC members
When stress in steel reinforcement is close to its yield strength, the carrying capacity of the concrete in compressive zone of flexural RC members is underused, especially in lightly reinforced elements. Therefore, triangular diagram of stress distribution within the concrete compression zone is acceptable. Further preconditions for calculation: tensile concrete above the crack is disregarded, but compensated by the assumption of plastic deformations of compressive concrete and disregarding of compressive reinforcement. Then, the flexural strength of RC beam could be obtained from the condition of equilibrium between the external and internal forces (Figure 1(a))50,51


State of stress when using: (a) triangular concrete compressive zone diagram and (b) curved concrete compressive zone diagram. 59
The similar results of the flexural strength of RC beams, calculated according to the methods provided by EC2,52,53 ACI 318, 54 H Rüsch, 55 I Židonis,56–58 and V Jokūbaitis and colleagues,50,51 are obtained. 59 It shows that the distance between the inner resultant forces is very similar when assuming triangular, curved, or equivalent rectangular diagrams of concrete stress distribution in compressive zone (see Figure 1).
When assuming triangular distribution of concrete stresses within the compressive zone, the internal forces shown in Figure 1(a) and (b) could be calculated using the equilibrium conditions


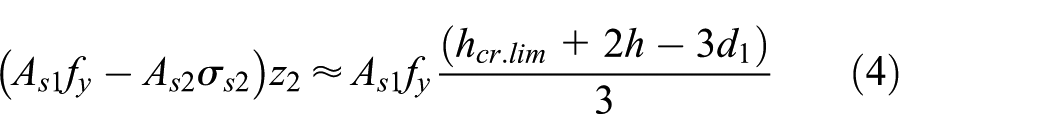
Limit crack depth could be obtained from equation (4)

The relation between the limit crack depth and the distance between inner resultant forces is evaluated in equation (5). The latter could be determined by both cases of curved or equivalent rectangular diagrams of concrete stress distribution within the compressive zone. In case of singly reinforced beams or when compressive reinforcement is neglected

The limit crack depth also could be calculated by combining the relationships given in EC2 and equation (6)

Thus, it is possible to calculate the flexural strength of reinforced concrete structures according to the limit crack depth calculated by equation (7).
Flexural strength of RC members strengthened with FRP
Similar methodology could be used for flexural RC members strengthened with FRP. Although there will be additional member in all equations. Two different strengthening methods will be examined:
EBR (Figure 2(a));
NSM (Figure 2(b)).
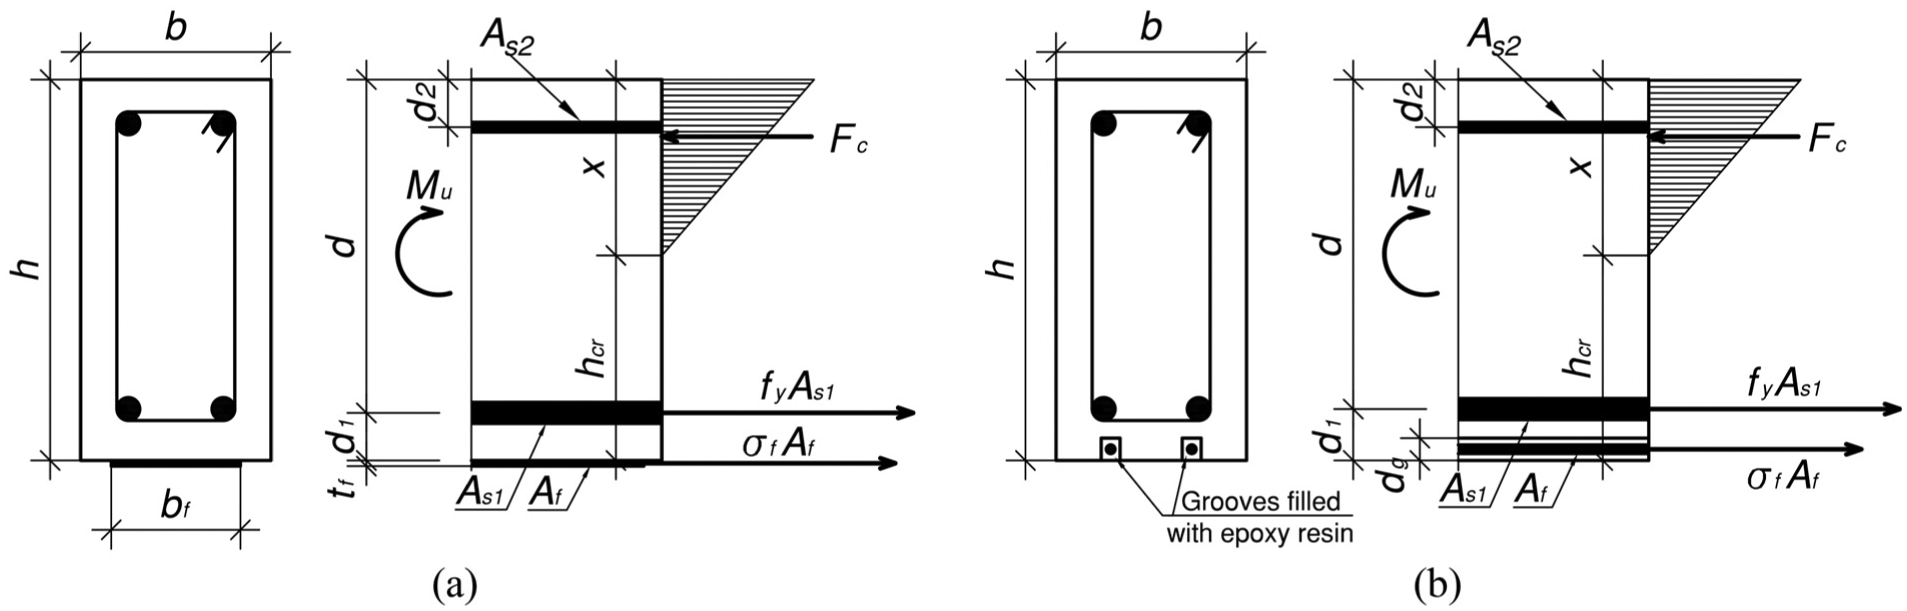
State of stress in RC beam strengthened with (a) externally bonded FRP and (b) near-surface-mounted FRP.
The tensile reinforcement stress will reach yield strength at elements failure stage, but FRP stress will not reach its ultimate stress. So, iterative calculation is proposed. FRP ultimate stress will be taken for the first iteration, when limit crack depth and FRP strain will be calculated, which will be used for second iteration and so on. In both cases shown in Figure 2, equation (7) could be written in such way

Here, Af is the cross-sectional area of FRP; σf.i − 1 is FRP stress, evaluated by previous iteration. For the first iteration, it will be equal to FRP ultimate stress, that is, σf.0 = ff. Compressive reinforcement is neglected.
FRP stress σf.i in each iteration could be evaluated by Hooke’s law

But σf.i ≤ ff. Here, Ef is FRP modulus of elasticity; εf.i is FRP strain. When σf.i < ff, the structure will fail because of crushing of compressive concrete, and when σf.i ≥ ff, the failure will be resulted by the rupture or debonding of FRP.
FRP strains could be obtained by assuming the limit state of strain in the member (see Figure 3)


Limit state of strain in the flexural member: (a) when FRP is bonded to the concrete surface (EBR) and (b) when FRP is bonded to concrete in the grooves (NSM).
Here, εfe.i is FRP strain caused by external loads; εp is FRP strain caused by prestressing force.
According to EC2, the limit strain of the compressive concrete εcu could be taken as 3.5‰ when concrete strength fck < 50 MPa and
The use of built-up bars theory allows the evaluation of reduction of stiffness in the interface between RC member and FRP. 45 The reduction factor could be used in the further calculations46–48
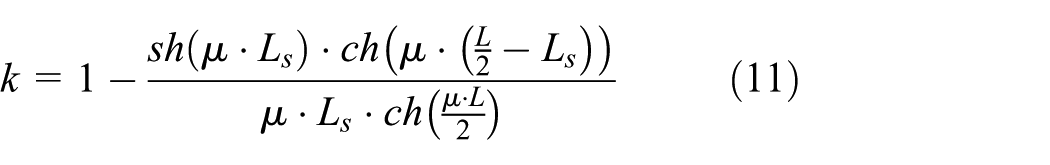
Here, L is a midspan length; Ls is the distance between a support and a nearest loading point.
Factor μ evaluates the stiffness of the interface and could be calculated as follows

Stiffness of the interface between separate members

Here, bbond is the width of the interface between concrete and FRP; a is the distance between the centroids of RC beam and FRP; and Geff is effective shear modulus 48

Here, Ecm is the secant modulus of elasticity of concrete; K is coefficient evaluating the anchorage of FRP. K = 1 when FRP is not anchored, K = 1.5 when steel plates are used for the anchorage, and K = 2.0 when FRP wraps or interlocking grooves are used for the anchorage.
Factor γ could be calculated as follows

Here, Ac.eff and Ic.eff is the area and the moment of inertia of cracked concrete cross section, respectively. For rectangular cross section


k = 1.0 when both conditions are satisfied

Here, σf is FRP stress of last iteration; Ab.eff is the area of the interface between FRP and concrete in one meter length of the beam,
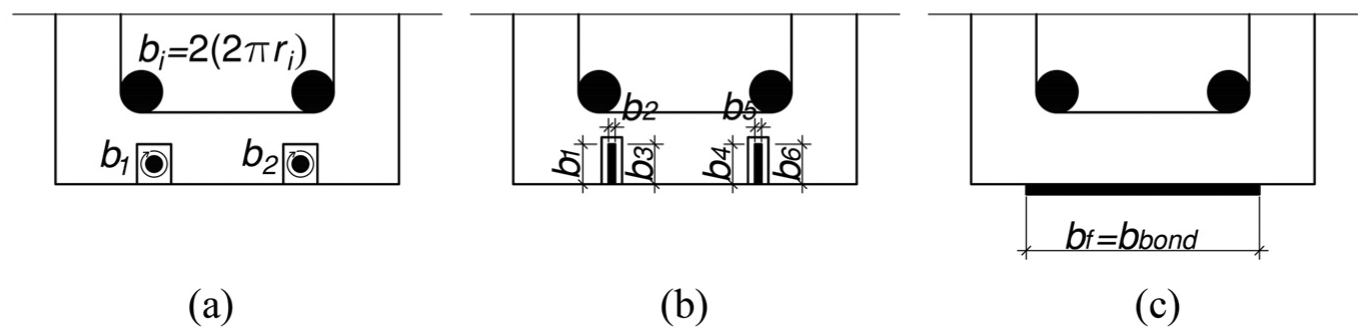
The width of the interface between FRP and concrete: (a) FRP rods (NSM), (b) FRP strips (NSM), and (c) FRP plates/sheets (EBR).
Then, limit crack depth can be recalculated by assuming stiffness reduction

Subsequently, the flexural strength of the member can be determined by assuming either triangular or equivalent rectangular compressive stress distribution diagrams (see Figure 5).

State of stress of RC beam strengthened with FRP: (a) using triangular diagram of stress distribution within compressive zone (EBR), (b) using equivalent rectangular diagram of stress distribution within compressive zone (EBR), (c) using triangular diagram of stress distribution within compressive zone (NSM), and (d) using equivalent rectangular diagram of stress distribution within compressive zone (NSM).
Flexural strength of RC beam strengthened with externally bonded FRP using triangular diagram of stress distribution within compressive zone (Figure 5(a))

Flexural strength of RC beam strengthened with externally bonded FRP using equivalent rectangular diagram of stress distribution within compressive zone (Figure 5(b))

Flexural strength of RC beam strengthened with NSM FRP using triangular diagram of stress distribution within compressive zone (Figure 5(c))
Flexural strength of RC beam strengthened with NSM FRP using equivalent rectangular diagram of stress distribution within compressive zone (Figure 5(d))
Here, η and λ are the reduction coefficients for compressive strength of concrete and depth of compressive zone, respectively. These coefficients could be calculated using the techniques proposed by E Dulinskas et al. 60 (see Figure (6)).

Stress distribution diagrams for concrete in compression: (a) curvilinear: 1—ascending part and 2—descending part; (b) strain in cross section; (c) curvilinear concrete’s compressive zone stress diagram and centroids of its parts: c—whole stress diagram, c1—ascending part, c2—constant (rectangular) part, c3—separated part from rectangular by curved descending line, and xc, xc1, xc2, xc3—the coordinates of centroids of stress diagram parts, respectively; and (d) rectangular stress diagrams: 3—equivalent and 4—inequivalent.
The areas of separate parts of curvilinear concrete’s compressive zone diagram
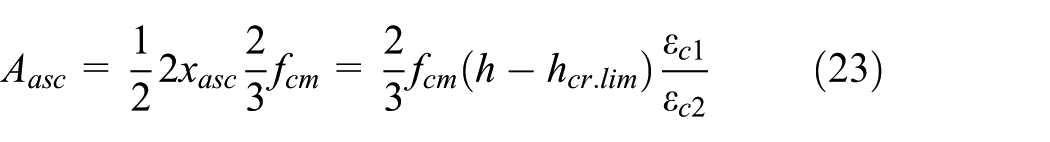


Here, concrete’s strain at peak stress (EC2):
The area of the whole curvilinear concrete’s compressive zone diagram

When


Here, xc is the coordinate of centroid of curvilinear concrete’s compressive zone diagram:
When
The calculation method proposed above allows the calculation of normal section load-bearing capacity of RC beams strengthened with FRP and the evaluation of state of stress and strain in FRP in the fracture stage. Using this method, civil engineers could choose the rational strengthening material and avoid unexpected sudden and brittle failures of the members subjected to the lower than design loads.
Comparison between the experimental and numerical results
A number of RC beams, strengthened with CFRP and GFRP sheets, plates, strips, and rods, and tested by different researchers, were analyzed. All tested beams were loaded by two concentrated forces. The main parameters of tested beams are presented in Table 1 while the main experimental results are shown in Table 2.
Main parameters of the tested beams.
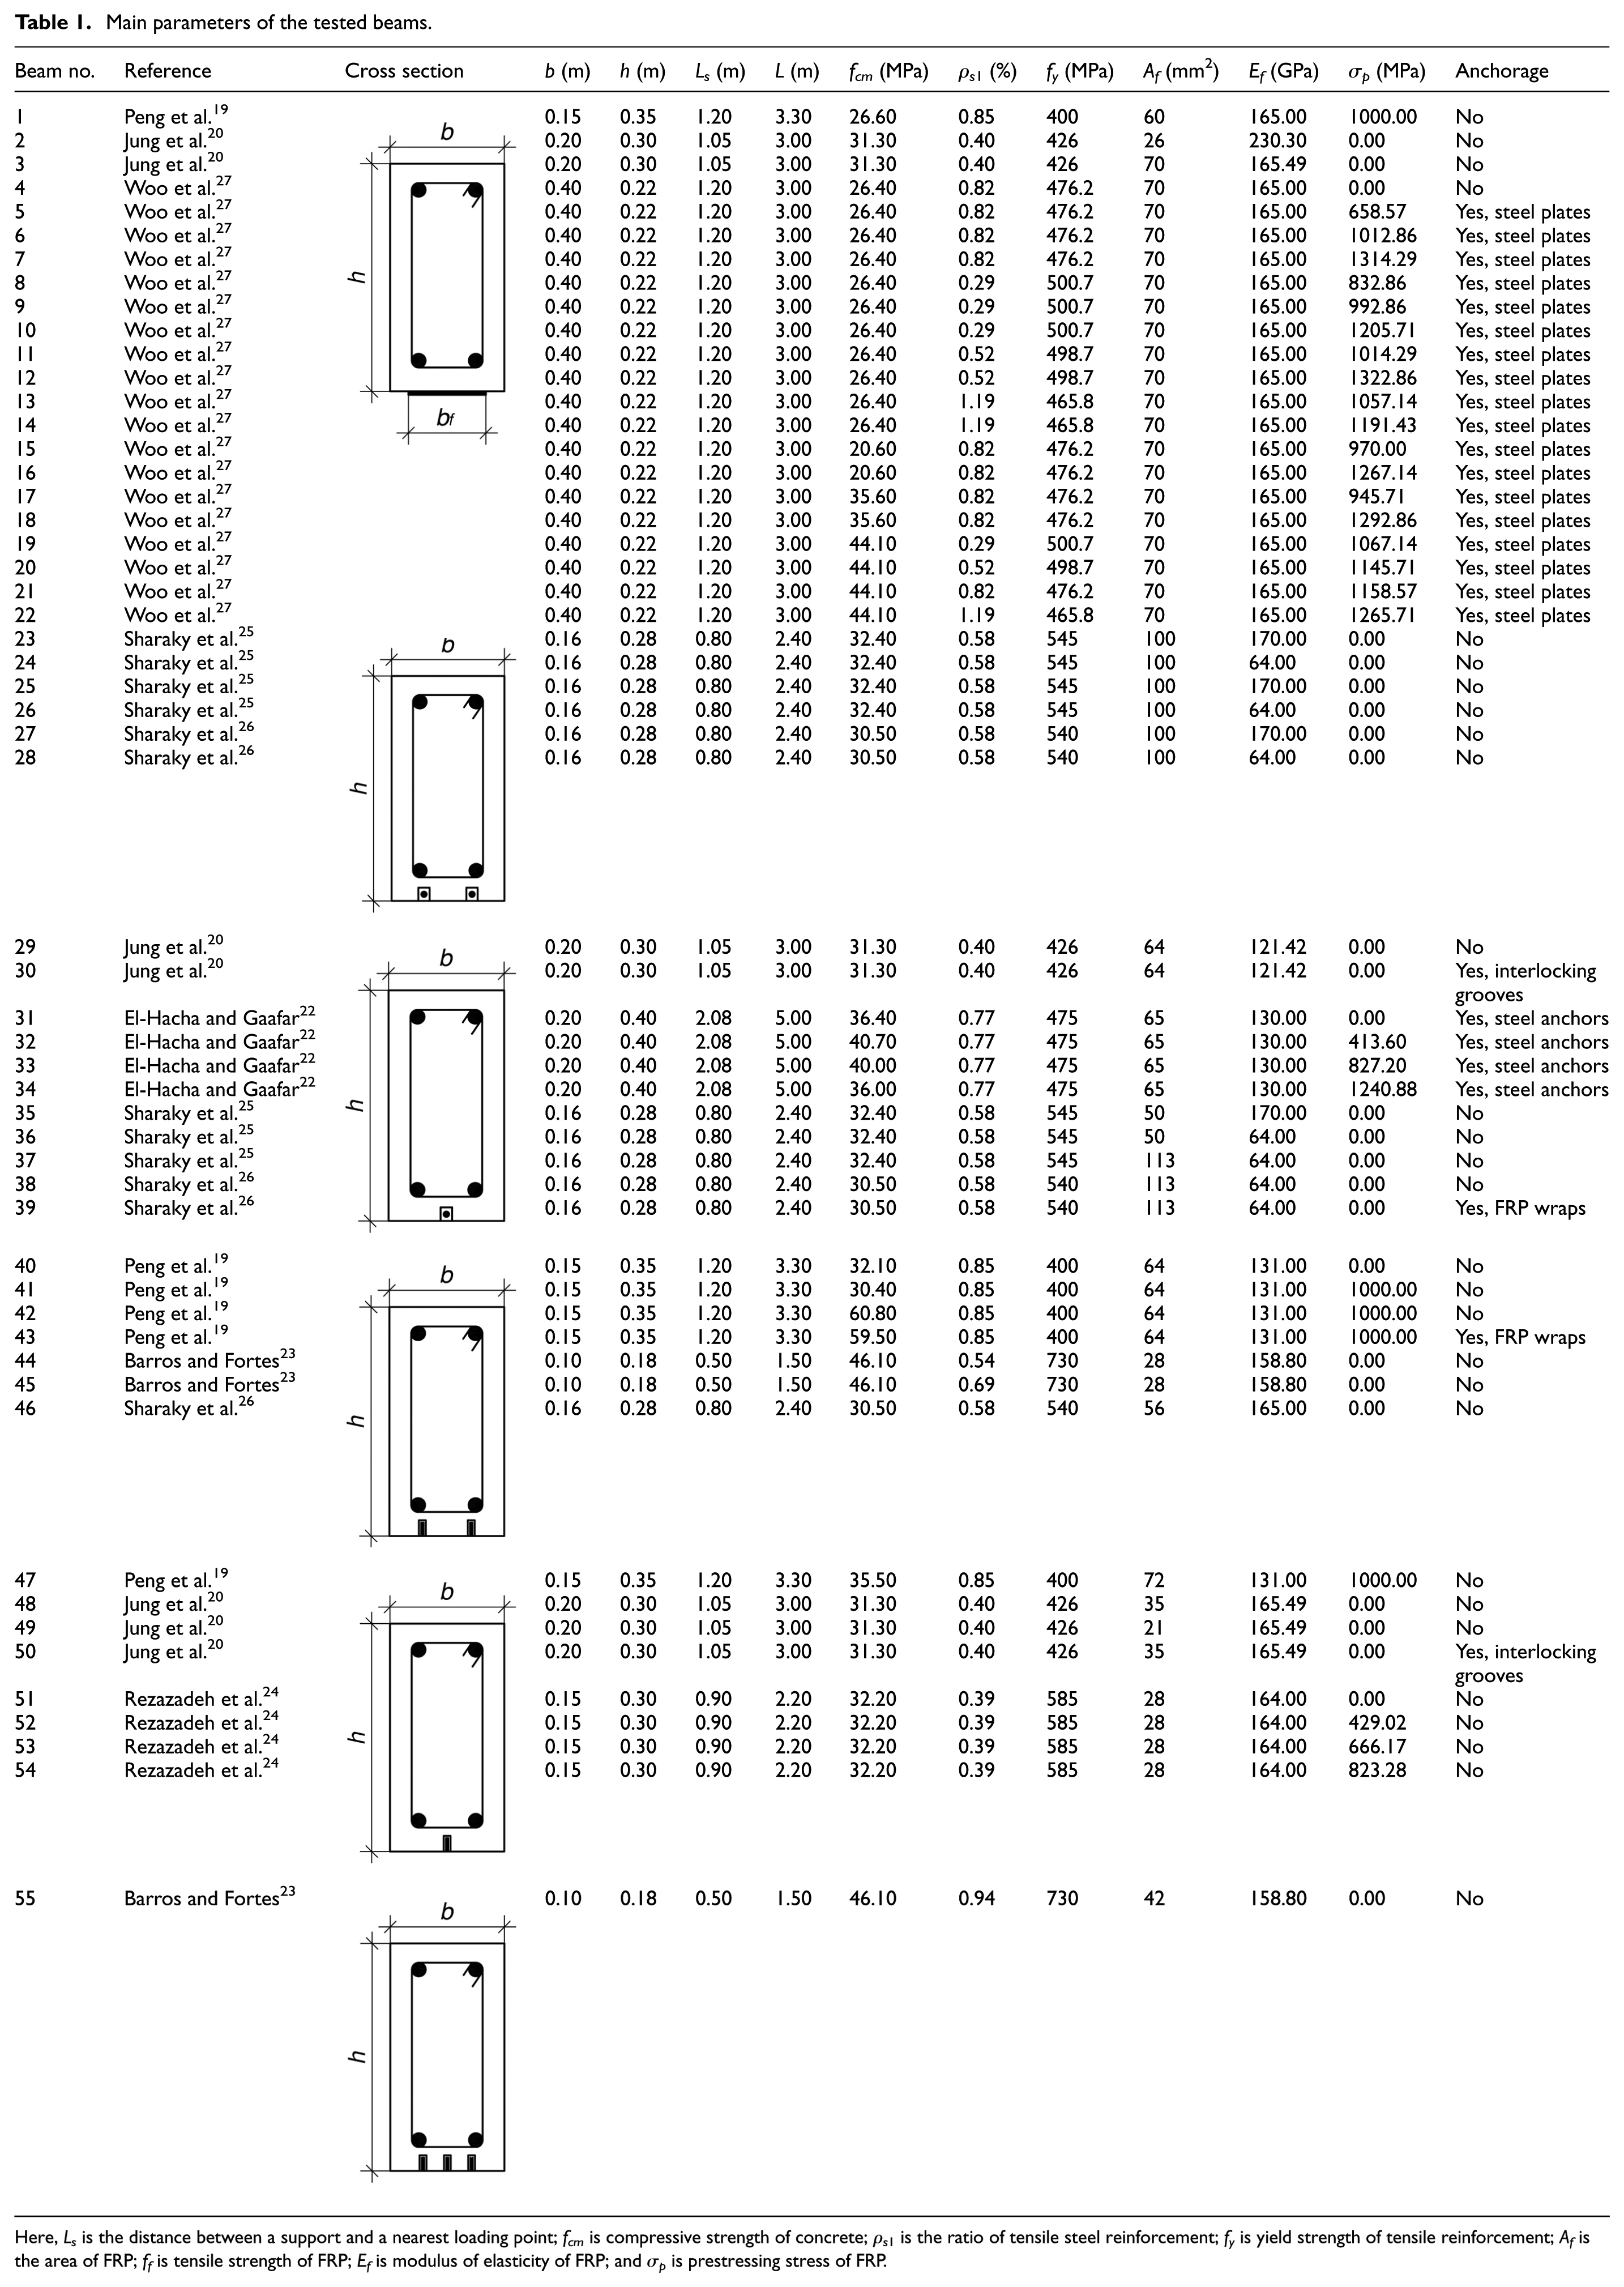
Here, Ls is the distance between a support and a nearest loading point; fcm is compressive strength of concrete; ρs1 is the ratio of tensile steel reinforcement; fy is yield strength of tensile reinforcement; Af is the area of FRP; ff is tensile strength of FRP; Ef is modulus of elasticity of FRP; and σp is prestressing stress of FRP.
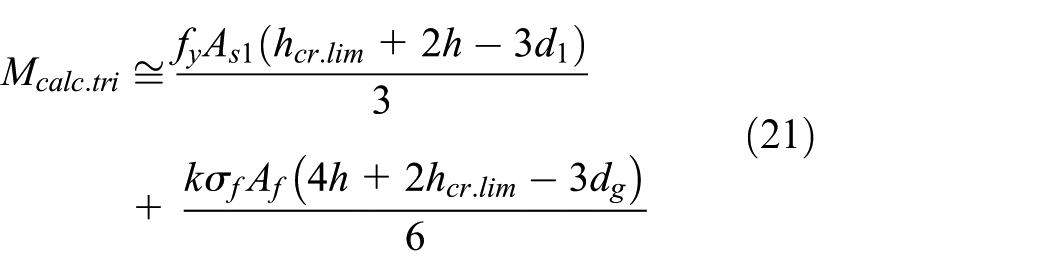
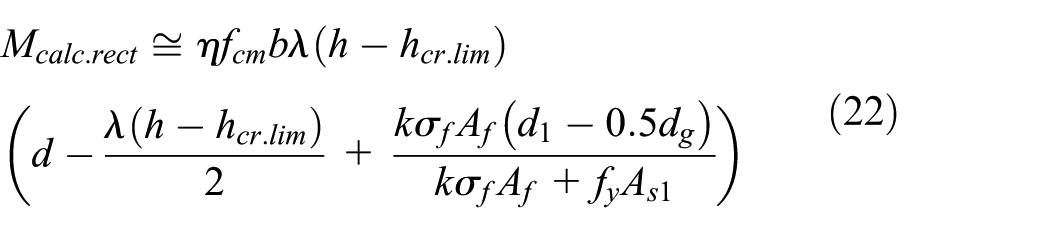
Main experimental and numerical results.

Here, My.exp is experimentally determined bending moment when tensile steel reinforcement reached its yielding stress (significant plastic deformations); Mu.exp is experimentally determined ultimate bending moment at beam failure; hcr.lim/h is the ratio of critical crack depth calculated by equation (18) and member height; Mcalc.tri is ultimate bending moment calculated using the triangular concrete’s compressive zone diagram by equations (19) and (21); Mcalc.rect is ultimate bending moment calculated using rectangular concrete’s compressive zone diagram by equations (20) and (22); Ab.eff is area of the interface between FRP and concrete in 1-m length of the beam; As1 is area of tensile reinforcement; σf is FRP stress of last iteration; and k is FRP stress reduction coefficient.
Figure 7 shows the comparison between the ultimate bending moments obtained experimentally and the numerically (calculated according to the equations (19–22)).

The ratio between the ultimate bending moments obtained experimentally and numerically (calculated according to the equations (19–22)).
The analysis shows that numerical results are more accurate and have lower variation when assuming rectangular diagram of stress distribution within concrete’s compressive zone in comparison to triangular diagram. When FRP is mounted by EBR method, numerical results exceed the experimental ones. When NSM method is used for mounting FRP, numerical results are lower than experimental ones. In both cases, the numerical results would exceed the experimental ones when FRP stress is not reduced due to the slippage between concrete and FRP (see Figure 8).

The comparison of the ratios between the ultimate bending moments obtained experimentally and numerically (with and without FRP stress reduction coefficient).
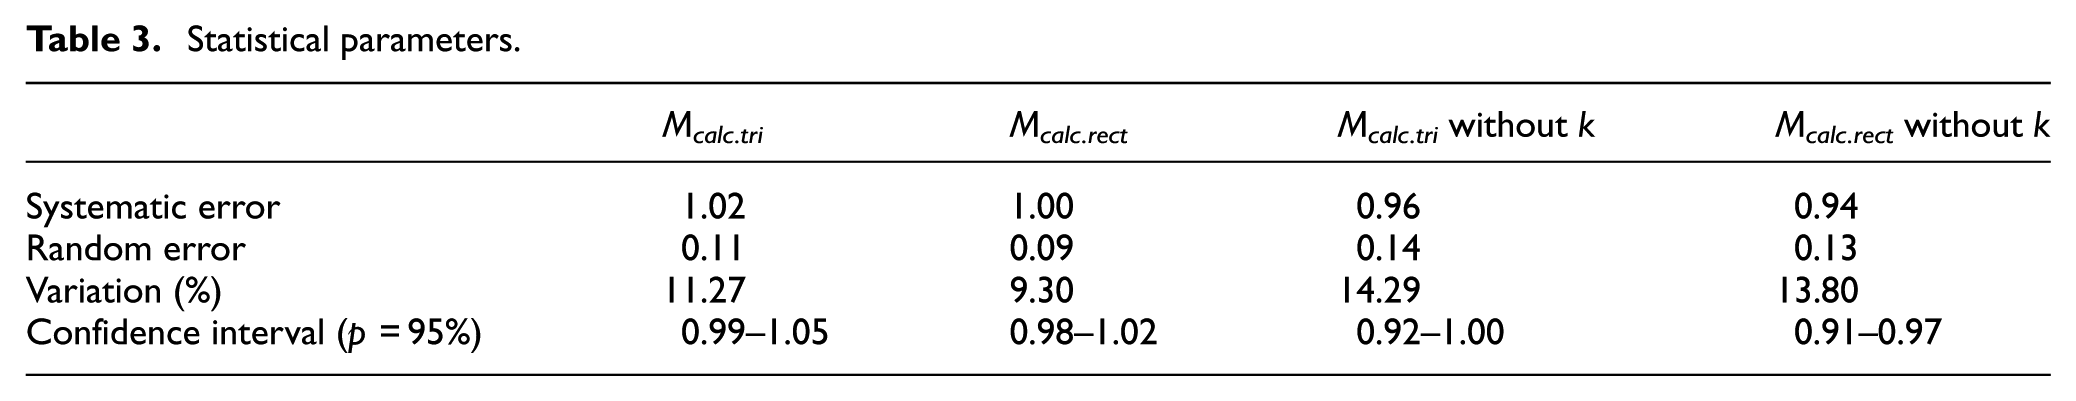
Generally, the numerical calculations when assuming reduced FRP stress (due to the slippage between concrete and FRP) are more accurate and have lower variation. It should be noted that in some cases, the beams actually failed at loads lower than 60% of the calculated ones, which is critically unsafe. Thus, it is vital to choose the correct calculation method. The main statistical parameters of the analysis are presented in Table 3.
Statistical parameters.
The analysis of experimental and numerical results proves that the proposed calculation method allows the accurate evaluation of load-bearing capacity of normal section of flexural RC beams strengthened with FRP. According to the results, a flow graph of calculation is added (see Figure 9).

A flow graph of calculation.
This calculation method could be treated as appropriate for the practical application when choosing the most effective strengthening material and when determining the load-bearing capacity of strengthened member.
Conclusion
The cracks in normal cross section of RC members are caused by the state of stress and therefore they should be considered during the design of flexural RC members, strengthened with FRPs. The calculation method proposed in this article allows the sufficiently accurate evaluation of load-bearing capacity and state of stress and strain in RC beams, strengthened with FRPs, at failure stage.
The results of bending moment Mcalc.tri calculations for RC beams strengthened with CFRP, GFRP plates, strips, sheets, rods, mounted by both EBR or NSM methods, confirmed the assumption that triangular diagram of concrete stress distribution within compression zone can be used, and the tensile concrete above crack could be neglected. It is possible to evaluate the flexural strength of RC structures, strengthened with FRP, according to the limit crack depth in normal cross section. The same calculation methodology could be used for the evaluation of state of stress and strain within the FRP at failure stage of the structure.
The results of calculation of load-bearing capacity are more accurate when using equivalent rectangular stress distribution diagram in compressive zone and evaluating stress reduction factor obtained from curvilinear diagram. A confidence interval of proposed calculation method is 0.98 … Mu.exp/Mcalc.rect … 1.02 (p = 95%). Thus, it is appropriate for the practical application when choosing the most effective strengthening material and when determining the load-bearing capacity of strengthened member.
The research also has shown that it is vital to reduce FRP stress due to the slippage between concrete and FRP. In some cases, strengthened members may fail at loads lower than 60% of numerically calculated ones. The proposed calculation method evaluates FRP stress reduction by applying the coefficient based on built-up bars theory. Such approach allows the more accurate prediction of failure of RC members strengthened with FRP.
Footnotes
Handling Editor: Daxu Zhang
Declaration of conflicting interests
The author(s) declared no potential conflicts of interest with respect to the research, authorship, and/or publication of this article.
Funding
The author(s) received no financial support for the research, authorship, and/or publication of this article.