
Abstract
The paper proposes an analytical framework for evaluating, in the case of interrupted conditions, the effect of bus bridging services on the degree of connectivity of rail networks. The average travel time is used to compare a normal network and an interrupted rail network. Different situations in interrupted rail network are compared with a normal network, namely, making passengers wait for troubleshooting, detouring them to other routes, and the bus bridging service strategy. The study uses ratios of average travel time under various situations to assess the connectivity of interrupted rail transit. The approach is applied to a case study based on the Beijing public transit system and actual travel data. It found that bus bridging is a relatively effective method of enhancing the connectivity of metro network and minimizing delays. In particular, key factors such as the behavior of affected passengers, the willingness to use bus bridging service, and transfer passenger, which influence connectivity of interrupted rail networks with bus bridging services, are provided.
Introduction
The urban rail transit system is a large capacity passenger transportation system that services a city. It usually consumes electric energy as power and is operated with a wheel rail. With the continuous development of cities, the urban rail transit plays an increasingly important role in the urban public transport system. As widely known, an urban rail transit system must accomplish extremely high passenger transport tasks both domestically and internationally. For example, more than 12.69 million passengers had been transported by the Beijing subway on 29 April 2016.
Because of high travel demand in the rail network, the connectivity between stations cannot be neglected. Once an interruption occurs, enormous passengers are delayed if this situation is not dealt with in time, and the standard of service of the entire network is affected leading to enormous pressure on urban rail transit system. For example, on 27 September 2011, the section of line10 in Shanghai metro between Jiaotong University Station and Nanjing East Road Station was under restriction due to equipment failure. In the case of equipment failure, operators had to dispatch the trains by human, but due to failure of operators, two trains collided at the section between Yuyuan Station and Old Simon Station. The accident caused a large-scale outage of the Shanghai line 10 and more than 200 passengers injured.
Unplanned interruptions of stations or sections often occur in the daily operation of urban rail transit, due to natural disasters, terrorist attacks, equipment failures, and some other unexpected reasons. In addition, planned interruptions usually happen when the operators need to maintain the rail track or the local government holds some major events. Unplanned interruptions will not last for a long time (not more than a few hours) while planned interruptions may have a long duration of several days. In order to avoid the adverse effects of unplanned interruptions and planned interruptions and ensure the connectivity of rail network, the bus bridging service is generally utilized as an effective means to deal with the interruption of rail transit operation in many countries. 1 Aircraft industry, production management, supply chain, material flow, project management, and transportation are involved in solutions for interruption accidents with the aim to resolve the interruption and reduce its influence.2–6 With respect to the urban railway system, the prime purpose of bus bridging services involves connecting the interruption section and transiting passengers who are influenced to next normal operating station, thereby guaranteeing a trip.
Several studies focused on the interruption management of a rail transit system. Generally, the emphasis of solutions to operational interruption response is especially reflected in the following three problems: first, in field of the adjustment of train timetables, D’Ariano and Pranzo, 7 Corman et al., 8 and Ma et al. 9 focused on ways to adjust a train timetable to coordinate the operation of the fault section. Li et al. 10 presented a delay adjustment model of passengers at a transfer station with minimal delay cost, waiting time cost, and adjustment cost as the optimization goal, proposed two adjustment strategies, including transfer passengers’ departure time adjustment and connecting trains departure time adjustment, and then designed a delay adjustment algorithm at transfer station for the optimal adjustment scheme. Second, the available train capacity in which Jespersen-Groth et al. 11 examined the calculation method of the transport capacity of train in case of interruption accidents. To some extent, the huge demand of train capacity in peak hour is similar to that in the duration of the interruption. Feng et al. 12 developed a travel cost function and an optimization model to analyze the arrival distribution of the commuters, based on the amount of the arrived commuters who are able to board a train from the perspective of the systematic operation of a rail transit line for the minimal total travel cost of all the commuters along this line. Third, Freling et al. 13 analyzed the labor ability of staff and the effective use of interruption time during the accident. Jespersen-Groth et al. 11 thought the basic method of resolution process for interruption accidents involves shortening the overall delay by reducing the interlocking effect of each interruption. From a research viewpoint, the main difficulty involves establishing a new model to solve these problems and then applying it effectively to practice.
With respect to bus bridging services, previous studies focused on the effect of transporting evacuees, the setting of feeder buses to coordinate with the railway, and the changing of rail transit network in other traffic bridging modes.5,13–16 First, in the field of transporting evacuees, for example, Kepaptsoglou and Karlaftis 17 proposed that the main task of bus emergency response should correspond to the safe transportation of passengers when the transport capacity of a rail transit line drops to a low level. Subsequently, they constructed a bridge dispatching model. Zeng et al. 18 explored the feasibility of using a taxi as an effective means to recover from the short-term interruption of public tram systems and analyzed the relationship between the arrival time of a taxi and a passenger’s willingness to use the bridging services. Second, in the field of the setting of feeder buses to coordinate with the railway, for instance, Wirasinghe 19 presented an approximate analytical model of a rail plus feeder bus system that serves a peak-period many to one type demand. Lee and Schonfeld 20 studied the influencing factors and methods of coordinating the transfer of a single urban rail transit line and a single bus line. Huang and Liu 21 established an improved model for feeder bus network development problems. The results showed that the proposed method can be used by transit planners to optimize feeder bus systems that provide access to rail stations and other activity centers. Chien et al. 22 developed a genetic algorithm to optimize a bus transit system serving an irregularly shaped area with a grid street network. Teng et al. 23 developed an integer-linear programming model to obtain the optimal schedules of the feeder vehicles and proposed an associated coordination mechanism to adjust the model-developed schedules to obtain feasible solutions. Sørensen and Longva 24 emphasize the coordination between rail transit operators and bus operators and showed that infrastructure managers and operators provide effective real-time management of emergencies in the United Kingdom and Denmark by establishing a joint center. Preferences of heavy rail (HR) system users are studied by Martínez and Cornejo 25 in relation to the system’s alignment and bus connections in the context of a developing city. The results showed that the value of the preference for heavy rail decreased to 8% when a feeder bus was not offered and the heavy rail route did not reach downtown. Based on the theory of binary logit (BL) model, Zhang and Li 26 established a new generalized travel cost model (GTC), built a choice model between bus and urban rail with the influence of transfer behavior, and provided some suggestion for improving the transfer condition and optimizing price charging pattern. Third, in the field of the changing of rail transit network, Jin et al. 27 studied ways to improve the stability of the subway network through subway bus bridging combined with an example of the Singapore subway. The proportion of passengers who can continue to be transported after the destruction of the network is used to define the stability of the network. De-Los-Santos et al. 28 divided the corresponding measures of the operating company after the interruption of an accident into the following two types: without-bridging management and with-bridging management, and they discussed the evaluation index of the network robustness in both cases.
In conclusion, most of the above studies focused on the operational adjustment of rail transit or the setting of feeder bus under the condition of interruption, and they do not classify the behavior of passengers after the interruption. Meanwhile, despite there are some connectivity analyses of the rail transit network by other scholars, they did not classify passengers’ behavior under the interruption of network in detail and did not establish a calculation model for the change of passenger flow in each cases, for which their models are relatively simple and fuzzy.
This article extends the currently available limited body of research to evaluate the effects of bus bridging services for interrupted rail networks. The paper contributes uniquely in the following ways.
First, based on graph theory, the network model of rail transit before and after the interruption is constructed by simplifying the lines and stations into edges and nodes. Meanwhile, the parameters, such as the cross-section flow and travel time, are defined. An evaluation model of the connectivity of the network depending on the ratio of the average travel time of the sections is established. Then based on the existing OD matrix data, affected passengers are divided into three categories, the average travel times (including the transfer time) corresponding to various situations are calculated using TransCAD and MATLAB software.
As a case study, the paper examines the available of models and methods on the Beijing public transit system, and sensitivity analysis of the willingness of passenger to use bus bridging service is made. Some suggestions, such as providing bus bridging service and improving the service quality of bus bridging service, are put forward for the planner and operator to maintain the connectivity of rail transit network and shorten passengers’ travel time.
Model and method
Network construction
A specific network is abstracted as a set of nodes and edges that are expressed as (V, E). 29 The set of all nodes in the network is represented as V = {v1,…, vn}, and the set of all edges in the network is represented as E = {e1,…, em}. The network is divided into undirected network and directed network based on whether the edges include direction. Additionally, a network is divided into weighted network and out-weighted network based on whether each edge of the network is given a corresponding weight.
In this study, a model of undirected network that is expressed as N(V, E) is established to represent the original rail traffic network that is not interrupted, and N′(V′, E′) represents a network of rail traffic in which sections are interrupted by an accident. Furthermore, V = {v1,…, vn} denotes a collection of nodes that represents the stations, and E = {e1,…, em} denotes a collection of edges that represents the sections between adjacent stations. In this study, the transfer paths between different lines in the same transfer station are considered as the transfer sections, which are similar to the line sections, and a transfer passenger flow exists within the transfer sections. In the initial network, each section possesses its own impedance according to the actual condition of lines and trains. Finally, it is assumed that qij represents the passenger flow from station vi to station vj in the OD matrix.
Passengers select the path within the network, and the cross-section flow of each section in the network is obtained by superimposing the passenger flow in each OD in which the shortest path contains the section. In the theory of path selection model, the allocation method that satisfies the definition of Wardrop balance is termed as the equilibrium allocation method, and the allocation model that uses a heuristic method or another similar method is termed as a non-equilibrium method. In this study, the non-equilibrium method of path is used to obtain the cross-section flow under the ODk that is expressed as
Model parameters.

Evaluation of network connectivity
When there is a sudden interruption in the rail transit network, typically two options exist for its operating company in terms of emergency measures:
If the duration of the accident is not long and the scope of influence is not high, the operator may not enable the bus bridging services. At this time, the passengers can choose to wait in situ until the accident is cleared or detour to the other routes of the rail transit system. It should be noted that if the connected sections of the origin or destination are all interrupted, a few passengers may have no access to use the rail transit system.
If the cause of the accident is complex and the response time is long, the safety of passengers who are waiting in situ may be threatened. At this point, the operator should enable the bus bridging services to reduce the dissatisfaction and uneasiness of the stranded passengers. At this time, the passengers can choose to pass the interrupted section using the feeder bus or just leave the rail transit system.
In this study, the travel behavior of passengers after the interruption of the rail section is divided into three types of cases, such as waiting for the solution of interruption, going round in other routes, and using bus bridging services. The connectivity of network and the effect of bus bridging services are evaluated by comparing the average travel time of sections when the network is not interrupted (T0), the average travel time of sections without the bus bridging services after the network is interrupted (T1, T2), and the average travel time of sections with the bus bridging services after the network is interrupted (T3).
The ratio of the average travel time of the sections before and after the interruption of the network is used as an evaluation coefficient of the connectivity change of the network. The “transfer” is defined as the process of passengers from one line to another line in a subway station. That subway station is regarded as the transfer station, and the path passengers used in the transfer station are defined as the transfer section. The transfer time represents the time that passengers spend in the process of transferring:
The evaluation coefficient of the connectivity of the network without average transfer time is defined as given in equation (1) as follows

where
The evaluation coefficient of the connectivity of the network with average transfer time is defined as given in equation (2) as follows
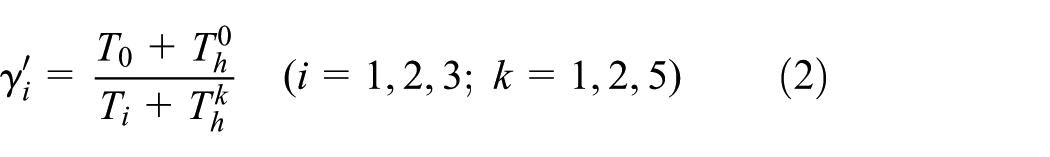
where
Average travel time of line sections in the original network
This study assumes that only one type of train is running in the network, which ensures that all trains have the same departure interval and different individuals pass the same section with the same travel time. Due to the interruption of the network, the operators usually consider the locomotive routing as a response measure, and thus, the train turnaround time increases while the travel time in the section is almost unchanged. Therefore, this study assumes that the travel time in other normal sections (te) is unchanged when a few sections are affected by the interruption.
Here, OD0 denotes the original OD matrix. The loss of passenger flow inevitably occurs in most cases when the network is interrupted. In this study, the loss of passenger flow is embodied in the form of discounting the OD matrix.
The weight is added in the calculation process to ensure the comparability of travel time in sections between different networks corresponding to different OD matrixes. The average travel time in a section of the original network N(V, E) is calculated as given in equation (3)

Average travel time of line sections after the interruption of network
Case 1
Without-bridging service, all passengers wait for troubleshooting
When the duration of the interruption is within the tolerance interval of the passengers, the passengers will wait in situ. It is assumed that all passengers wait for troubleshooting and then continue to travel along the original path if the operator does not enable bus bridging services after the interruption of the accident. The waiting time of the passengers is equal to the duration of the interruption, and that time will fluctuate due to the cause of the interruption and the severity of the accident. And the time needed for troubleshooting should be added to the time that is spent by affected passengers to pass the interrupted section. The average travel time is calculated as given in equation (4) as follows

It should be noted that there is no change in OD matrix since all passengers are waiting in situ, and thus, OD1 = OD0.
Case 2
Without-bridging service, some passengers detour in other routes and others leave the rail transit system
In practice, if passengers fail to reach their destination after the accident, they may choose to use the normal station around the original destination as a new destination, which is a complicated problem. In order to simplify the model, this study assumes that if passengers cannot reach the destination directly by the rail transit, they will leave the railway system directly instead of heading for the normal station that is close to the original destination.
If more than one section of the rail transit network is interrupted and there are stations in which all connected sections are interrupted in the network, then the passengers whose origins or destinations correspond to these stations leave the rail transit system. Thus, it causes a loss of passenger flow. The remaining passengers choose other routes to reach the destination.
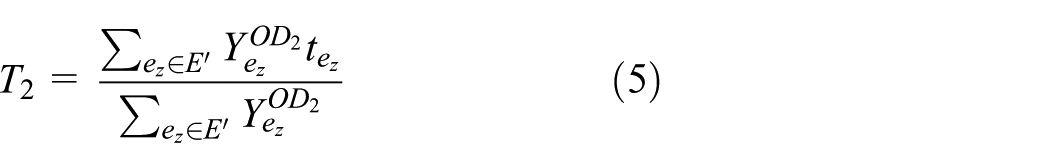
In order to eliminate the loss of passenger flow, this study initially determines invalid stations, and this is expressed as vp (vp ∉ V′, ep ∉ E′). Subsequently, all the passenger flow of OD should be deleted in which the origin or destination corresponds to vp in the original OD0 matrix. A new OD matrix that is expressed as OD2 is established. Thus, the average travel time of section in the interrupted network N′(V′, E′) is calculated as given in equation (5) as follows
Case 3
With the bridging service, some passengers use the bridging service and others leave the rail transit system
A bus bridging service in combination with domestic and international experience corresponds to the first choice to deal with interruption accidents. The bus bridging service possesses characteristics including a high carrying capacity, cheap price, and slow speed. The adjustment of other bus lines is involved in the bus bridging service, and thus, the process is more cumbersome. The routes of the bridging bus in this study extend along the interrupted railway lines and remain constant. The purpose of the bus bridging service involves substituting the interrupted section in the network.
1. Determine the proportion of the affected passengers who use the bus bridging service.
When the network is interrupted by accidents, passengers will choose the most favorable method to complete the follow-up travel by instinct. A variety of factors randomly impact whether the passengers use a bus bridging service. These factors include the traffic conditions of road, distance of connection between subway and bus, distance between the incident spot and the destination, purpose of the trip, guidance of information for using the bus bridging service, and so on.
Bridging bus usually comes from other normal bus routes or parking lot. The distance between bridging bus and the incident site, the bus driver’s driving speed to the incident site, and traffic conditions on road will have a certain random impact on the time when the bridging buses arrive at the incident site. Li and Li
30
considered that the time required for a bridged bridging to reach the incident follows a normal distribution. The proportion of passengers choosing bridging bus is determined by the arrival time of the bridged bus: passengers are more willing to accept bridging bus if the bridging bus arrives faster, and passengers are unwilling to accept bridging bus if the bridging bus arrives slower.
19
According to this characteristic, this article selected the probability (Pb) of passengers choosing to use the bridging bus in the case of interruption of the rail transit network, and the proportion of the passenger flow loss (

2. The discount calculation of the OD0 matrix.
All OD pairs in this study are allocated in the shortest path, and thus, the affected OD pair in the OD0 matrix is defined as the OD pair in which the shortest path contains the interrupted sections. Subsequently, the OD0 matrix is split into the OD3 matrix of the passengers who are affected by the interruption and the OD4 matrix of the passengers who are not affected by the interruption. Additionally, Ps is used to discount the OD3 matrix, and the final OD5 matrix is obtained by superimposing the discount OD3 matrix and the OD4 matrix where

3. The calculation of the average travel time of sections in the bridging-network.
The supplementing of the bridging bus to the interrupted section results in a few affected passengers choosing the incipient route (i.e. original shortest path in N(V, E)) to complete travel while the other affected passengers leave the rail transit system. The passenger flow of the interrupted section

Average travel time of the transfer section
In the actual situation, the interruption of the network has a certain impact on the transfer passenger flow. The set of transfer station (Vh) is established in this study. The transfer paths between different lines in the same transfer station are considered as the transfer sections (eh) that are similar to the line sections. Furthermore, Eh denotes the set of transfer sections. Each transfer section has its own transfer time and transfer passenger flow. In order to simplify the calculation, this study assumes that there are only two transfer sections corresponding to the directions of the round trip between two different lines in the same transfer station. An example of the relationship among the line section, the transfer section, and the transfer station is shown in Figure 1.

The relationship among the line section, the transfer section, and the transfer station.
It is necessary to initially calculate the transfer time of each transfer section.31,32 Each passenger arrives at the rail transit station in a random process, and thus, the waiting time (twait) is approximately equal to half of the average departure interval of the train (tf). The transfer time (

The average departure interval of the trains and the section travel time can be obtained by means of actual measurement on the platform and transfer section, respectively, during the rush hour.
Subsequently, the transfer passenger flow of each transfer station under the ODk matrix is calculated. The OD data in this study contain information on the lines that the origin stations and destination stations belong to.
The judging criteria of the transfer passenger flow of a certain OD pair as to whether they appear in transfer station (vhi) are defined as follows:
The origin station and destination station of the OD pair are not on the same line.
The transfer station vhi is located on the shortest path of the OD pair.
Condition (1) ensures the existence of transfer behavior, and the transfer section that each OD pair belongs to is determined by the numbering sequence of the origin station and destination station. Condition (2) is used to determine the OD pair that contributes to the transfer passenger flow in station vhi. All OD pairs in the ODk matrix are traversed, and the transfer passenger flow of each transfer section in station vhi (
The transfer time and the transfer passenger flow of each transfer sections are used to calculate the average travel time of the transfer section under different networks as given in equation (10) as follows

It is worth noting that in the calculation of
Case study
Network construction
Line 1, Line 2, Line 4, and Line 5 in the Beijing Metro constitute the research network. The four rail lines include the ring line, horizontal axis, and vertical axis, as illustrated in Figure 2. With the exception of Line 2 that corresponds to a loop line, the other lines also form multiple loop networks due to their intersecting relationship with each other. Thus, the network can also satisfy the needs of the current study.

Research network.
The research network contains a total of 96 line sections and 99 subway stations including eight transfer stations. Additionally, all transfer stations correspond to the two-line transfer, and thus, the number of transfer sections corresponds to 16. The number of the line section is represented by the number of adjacent stations.
Data
This study extracts the AFC card data of Line 1, Line 2, Line 4, and Line 5 of Beijing from 8:15 to 8:55 on 7 March 2016. The selected day did not correspond to a holiday, and thus, no large-scale activities were held or extreme weather conditions occurred on the day. This ensures that the results are more in accordance with daily situations. The AFC data are obtained through the operating company of Beijing subway and include the ID number, number of stations, name of stations, time of leaving and entering, and a few other factors. By filtering out the invalid AFC data, the valid AFC data are extracted and used to obtain the original OD0 matrix. The proportion of passengers’ willing to choose bridging bus is obtained through the questionnaire survey. Questionnaires were distributed to 100 people, and 92 questionnaires were recovered, excluding 10 invalid questionnaires and 82 valid questionnaires. The questionnaire assumed that the duration of the subway accident was 40 min. The proportions of passengers choose to use the bus (Pb) were obtained under the arrival time of bus (ta) which range from 5 to 40 min. As shown in Figure 3, the vertical axis represents Pb, while the horizontal axis shows the arrival time of bus, and Pb decreases linearly with the increase of ta.

The relationship between passengers’ willingness and the arrival time of bus.
Results
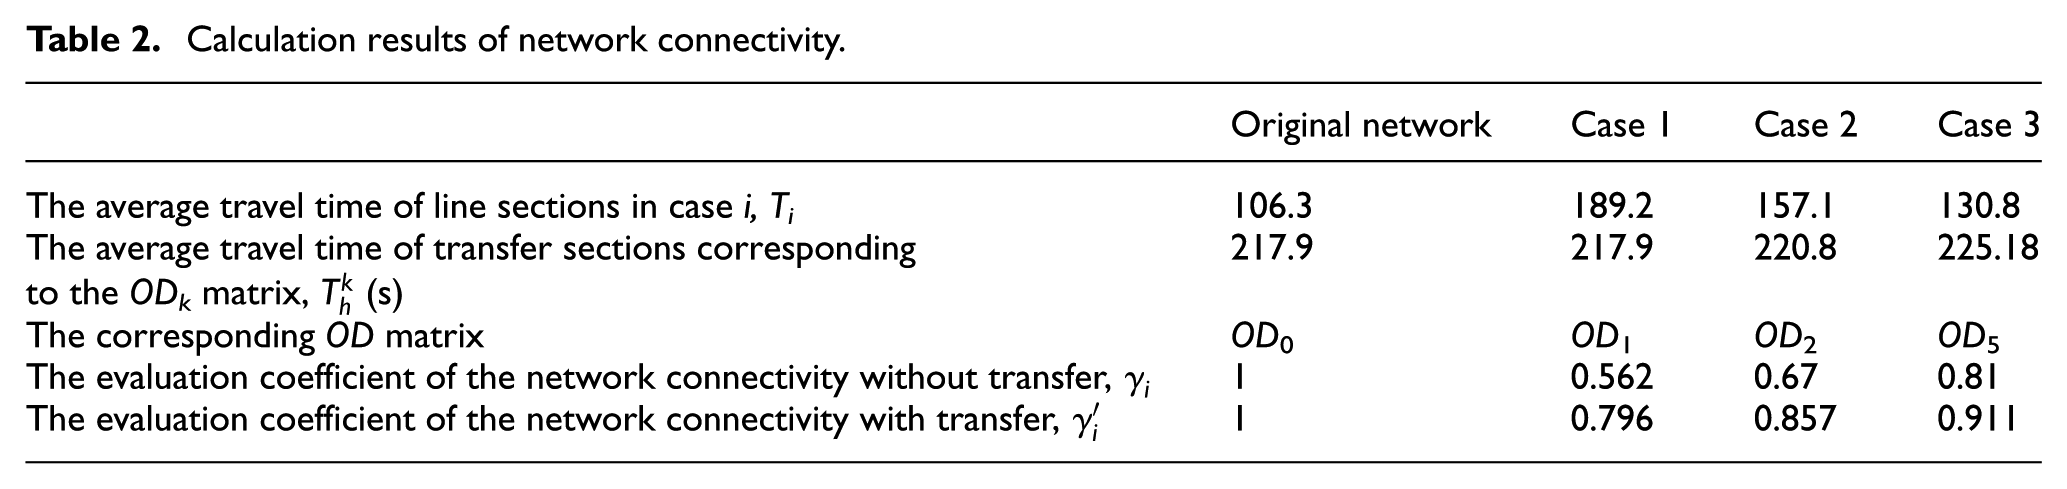
This study assumes that a sudden interruption occurs in the line sections of Zhangzizhonglu Station–Dongsi Station and Dongsi Station–Dengshikou Station. The duration of the accident corresponds to 40 min. All connected sections of Dongsi Station are interrupted, and thus, Dongsi Station is an invalid station in case 2. The survey results show that when the bus arrives in 11 min, 35.5% of the passengers do not want to use the bus provided by operating company and will use public transport including public bicycles to go to the destination directly. Using the proposed calculation method, the final results are obtained and shown in Table 2 and Figure 4.
Calculation results of network connectivity.

Comparison of network connectivity.
The results indicate that the average travel time of the sections shows a downward trend when the three cases are compared. However, the change in the transfer time among three cases is not evident and is relatively stable. When the interruption lasts for a long time, if the operator makes passengers wait for troubleshooting, then the connectivity of network significantly decreases. With respect to another aspect, the average transfer time increases if the passengers detour to the other routes. This is because the new route chosen by passengers has a higher frequency of transfer when compared with the original one in most cases, and passengers tend to move to important large-scale transfer stations, such as Xuanwumen station and Xidan station, even if the transfer stations involve a long transfer time. When compared to case 1 and case 2, the bus bridging service in case 3 significantly improves the connectivity of the network (reaching more than 80% of the connectivity of original network). Due to the loss of passenger flow in OD3, the cross-section flow in some transfer sections reduces. Furthermore, the cross-section flow of transfer sections decreases more markedly in some stations with shorter transfer time, such as Lama Temple Station and Dongdan station. As a result, the average travel time of transfer sections in whole network increases slightly in case 3.
Sensitivity analysis
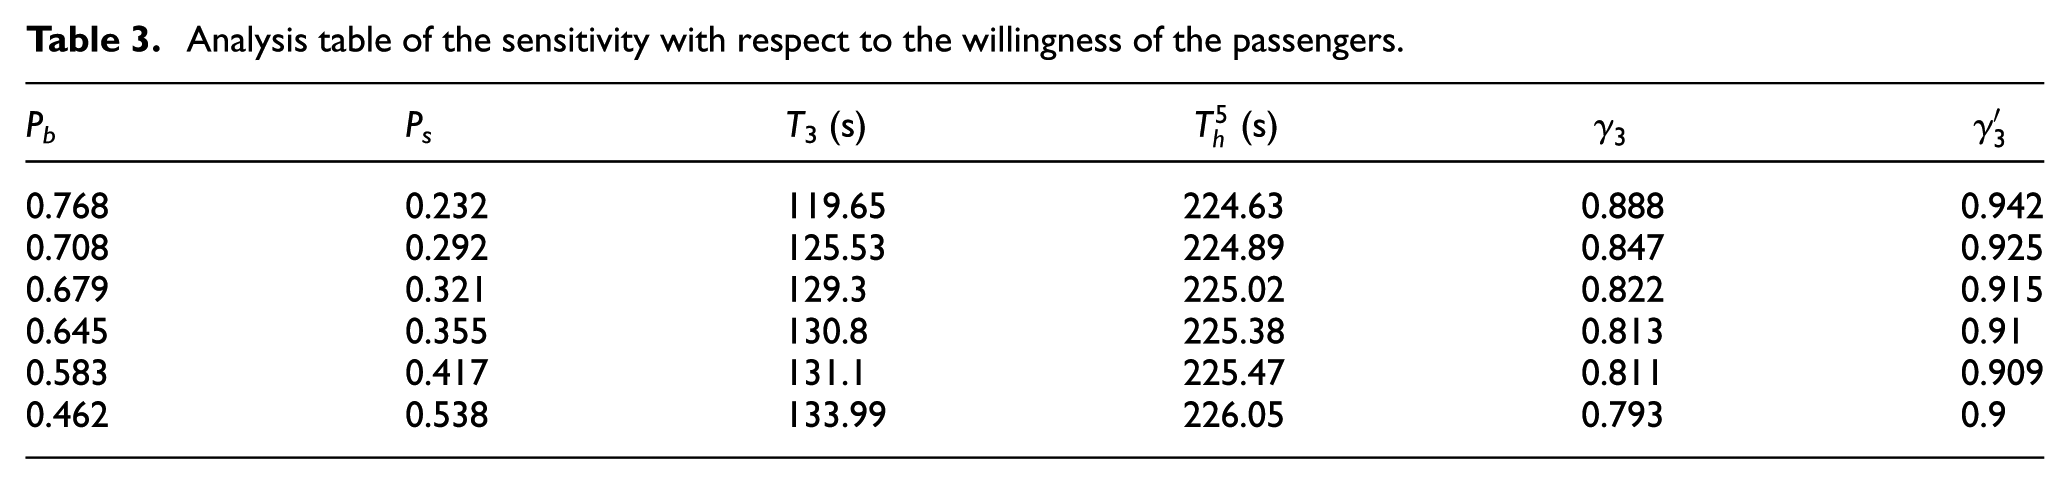
This study focuses on the impact of a bus bridging service on the connectivity of network. As detailed in the preceding paragraph, a variety of factors randomly impact whether passengers use a bus bridging service, such as the traffic conditions of road, connection distance between a subway and a bus, distance between the incident spot and the destination, purpose of the trip, the duration of the interruption, and the bus response time. In fact, the proportion of passengers using the bridging service is related to the arrival time of the bus, and the connectivity of the network is affected by the choice of passengers. In order to evaluate the effect of different arrival times of buses on the robustness of the network, this section makes a sensitivity analysis of robustness by adjusting the willingness probability of the passenger to use the bridging service. The results are shown in Table 3 and Figure 5.
Analysis table of the sensitivity with respect to the willingness of the passengers.

Tendency chart of the sensitivity with respect to the willingness of the passengers.
There are two vertical axes in Figure 5. The left vertical axis in Figure 5 shows the average travel time of line sections and the average travel time of the transfer section in bridging-network, basing on the different probabilities of passengers who select bus bridging service. The right axis expresses the value of the connectivity coefficients in the bridging-network. The horizontal axis expresses the loss rate of passenger flow (Ps). As shown in Figure 5, the average travel time of the line section increases with the increment in the loss rate of passenger flow while the change of the average travel time of the transfer section is extremely stable. This is potentially because that for the purpose of the least travel time, the passenger flow in normal network has a tendency to converge in some critical sections, which have a shorter travel time. The loss of passenger flow for using bridging service often leads to the loss of passenger flow in other normal sections, especially in the critical sections. So it results in a decline in the weight of critical sections, and then the average travel time of the line section increases. On the other hand, the distribution of transfer stations is relatively uniform and the cardinal number of the transfer passenger is high. Thus, the variations in the trend of passenger flow in each transfer stations are similar, and the weighting further reduces the distinction. In contrast, the distinction between the variation trends of passenger flow in each line section is evident, so the result of line sections is more sensitive to the loss rate of passenger flow. The average transfer time (denoted by the red line) in the result significantly exceeds the average travel time of the line section (denoted by the black line). This is potentially because that the investigated lines of this study were constructed earlier, and the transfer with other lines in the future was not considered at the beginning of the construction. Thus, the transfer between two lines is usually achieved by a long transfer passage way, and this eventually leads to a long transfer time.
There is a positive correlation between the connectivity of the network and the willingness of passengers to choose the bus bridging services. Therefore, it is obviously that providing better bus bridging services improves the evaluation of a subway by the passengers and also enhances the operational efficiency of the whole network. Thus, this constitutes a win–win measure. Figure 6 shows radar-graph of the slope of network connectivity and willingness of the passengers.

Radar-graph of the slope of network connectivity and willingness of the passengers.
As shown in Figures 5 and 6, the slope of the willingness curve of choosing the bus bridging services exhibits a distinct change approximately at 0.35. The slope is initially higher and gradually reduces after 0.35. This indicates that it is easy to quickly attract affected passengers by adopting certain simple operational measures when the willingness of passengers to use the bus bridging services is at a low level. Additionally, with the increase in the number of individuals who use the bus bridging services, other affected passengers will gradually lose their interest in using the bus bridging services. Hence, it is important for operators to provide better service to attract an increased flow of affected passengers. The transfer time occupies a non-negligible proportion in the whole journey and it is not sensitive to the passenger’s choice of bus bridging service. Thus, the connectivity in with-transfer network exceeds that in the without-transfer network. However, the variation trend of the slope is initially higher and subsequently gradually reduces after a certain point.
Conclusion
Urban rail transit forms the backbone of urban public transport system, and the interruption of rail transit always results in huge economic losses and adverse social effects. In order to ensure the connectivity of an interrupted rail transit network, operators tend to transport passengers who are affected due to interruptions through the use of bus bridging services.
This study mathematically compares different options to respond to an interruption in normal service in a transit network. It specifically seeks to analyze how advantageous the bus bridging services can be when it is compared to doing nothing. The results obtained for case study suggest the following practical observations:
The operation interruption in the rail transit network significantly reduces the connectivity of the network. At this time, if the operator simply makes passengers wait for troubleshooting or detours them to other routes, it is not possible to satisfy the demand of passengers for a short travel time.
The bus bridging service mainly compresses the waiting time of the passengers at the station as well as the excess travel time in other routes, and this does not significantly impact the average transfer time of the passengers.
The bus bridging service effectively improves the connectivity of the interrupted network, and an increase in the proportion of passengers who use the bus bridging service increases the connectivity of the network. Nevertheless, the ability of the bus bridging service to attract passengers will weaken if the number of users increases. Hence, it is necessary for an operator to provide a high-quality bus bridging service.
The characteristics of passenger flow among transfer stations are similar after the interruption. If there is no bus bridging service in the interrupted sections, detouring passengers tend to move to important large-scale transfer stations, even if the transfer stations involve a long transfer time. So the setting of transfer stations has a great influence on passengers’ travel, in order to reduce the transfer time, planners should avoid the setting of a long transfer channel. There should be some reserved space for the multiple-line transfer in the transfer stations, which have the potential to be an important large-scale transfer station in the future.
Footnotes
Handling Editor: Gang Chen
Declaration of conflicting interests
The author(s) declared no potential conflicts of interest with respect to the research, authorship, and/or publication of this article.
Funding
The author(s) disclosed receipt of the following financial support for the research, authorship, and/or publication of this article: This work was supported by the Beijing Municipal Science and Technology Commission, and Beijing Rail Line Safety and Disaster Prevention Engineering Technology Research Center (grant numbers Z171100002217011).