
Abstract
The COVID-19 pandemic has left major shifts in transit usage patterns on systems around the world in its aftermath. Unfortunately, the lack of detailed post-pandemic data on passenger travel habits has limited transit agencies’ ability to respond to trends and leverage new travel markets. The rollout of wireless fidelity (Wi-Fi) services at stations and onboard vehicles presents a potential solution, as Wi-Fi device connections can be used to provide very detailed information on customers’ origins, destinations, exact route, and travel time, which in turn can be aggregated by time and geography to reveal broader trends. This study presents an exploratory analysis based on such Wi-Fi data to investigate post-COVID ridership recovery trends on the Toronto subway system, demonstrating that Wi-Fi connections can be a credible proxy for overall ridership. The data show that downtown office commuting has been the slowest-recovering travel market, with local riders in suburban areas, off-peak riders, and discretionary riders returning to the subway system at higher rates. The data also confirm past research findings that less affluent and non-office workers were the fastest to return to transit.
The COVID-19 pandemic has had major impacts on transit systems around the world, and the post-pandemic recovery has created numerous challenges, opportunities, and open questions that remain to be explored. Among the most critical impacts of the pandemic has been the large decreases in transit ridership because of lockdowns and stay-at-home orders, customer fears about contagion, and continued hybrid/remote work and education policies by employers and schools. Since the pandemic’s onset in early 2020, riders have been slowly returning to transit, albeit the recovery has been uneven; certain transit travel markets remain depressed whereas others have fully recovered and even exceeded pre-pandemic levels.
Nonetheless, there is a relative paucity of data on such post-COVID ridership trends, and many transit agencies’ operations and long-term planning continue to revolve around, or assume a reversion to, pre-pandemic conditions. In particular, many agencies lack detailed data about origin–destination (O-D) flows across their networks. As a result, as the recovery proceeds, operators have been forced to take a reactive stance, instead of adapting their services proactively to better leverage the travel markets that show the strongest recovery. This has negative financial ramifications as transit agencies allocate their resources sub-optimally, lose potential revenue, and fail to adequately service customer needs.
The Toronto Transit Commission (TTC), which operates subway, bus, and streetcar services across the City of Toronto, is the largest transit agency in Canada, carrying over 530 million passengers in 2019 ( 1 ). The TTC system, shown in Figure 1, is composed of four rapid transit lines, nine streetcar lines centred on downtown, and a bus network that provides local transit services to the rest of the city. The city is also served by commuter trains and buses operated by GO Transit, although the TTC system carries the majority share of transit ridership in Toronto.
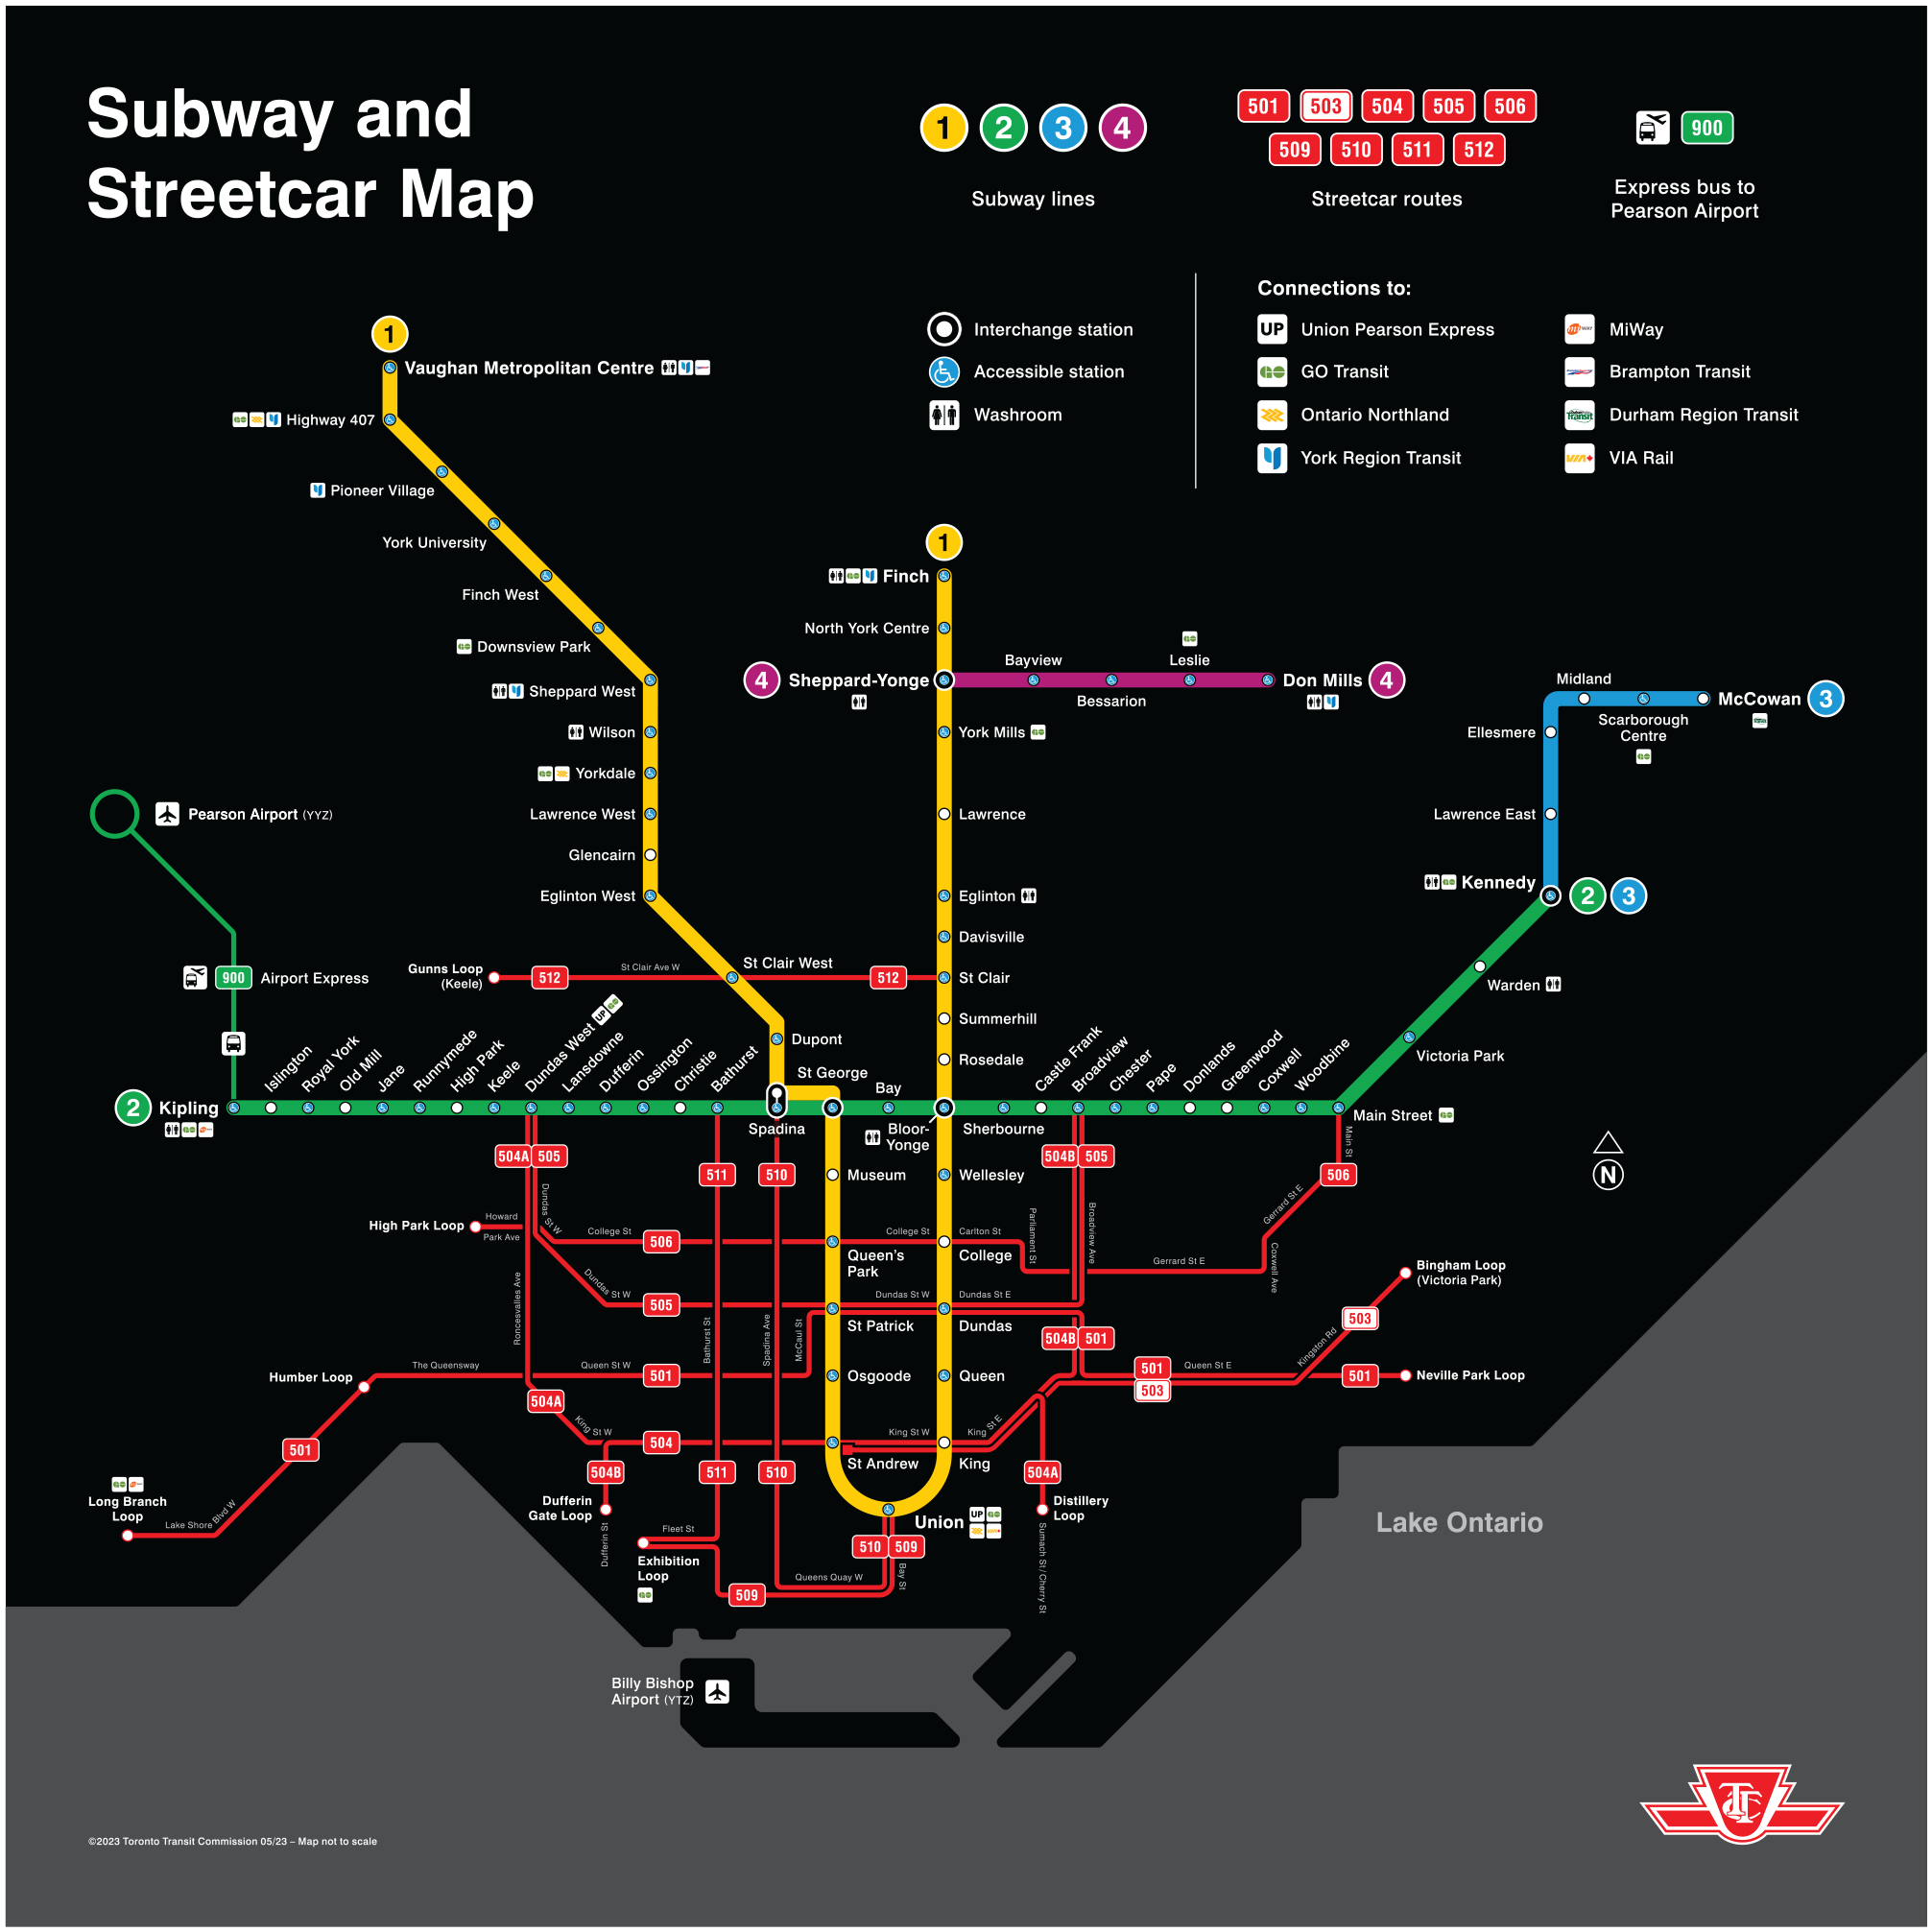
Official map of the Toronto Transit Commission (TTC) subway and streetcar system ( 2 ).
The regional transit system is largely oriented around downtown Toronto, which is by far the most important transit trip generator in the region. This is driven by a diverse range of travel markets, including office commuters, university students, and travel to recreational and entertainment destinations. Travel survey data from the 2016 Transportation Tomorrow Survey (TTS) indicate that almost half (46%) of transit trips in the region were made to, from, or within downtown Toronto, compared with just 11% of all trips, underscoring its importance in the regional transit system. Transit enjoyed a 51% mode share for downtown travel, versus 12% in the rest of the region, highlighting transit’s critical role in serving downtown Toronto’s transportation needs.
In the first month following widespread stay-at-home policies beginning in March 2020, the TTC reported a 71% decrease in ridership as well as a similar decline in revenue ( 3 ). As of March 2023, system-wide ridership was reported to have recovered to 71% of pre-COVID levels. However, this was not uniform across modes, as boardings were at 82% for bus services, 63% on the subway system, and 58% on the streetcar network ( 4 ), pointing to evolving travel habits and trends in a post-pandemic city.
Research Approach
Initial findings such as these highlight the need for a better understanding of how, where, and when transit riders are returning, as carrying forward with pre-pandemic assumptions is no longer realistic. To this end, two key research questions will be posed and explored here. The first question focuses on understanding the shape of transit recovery on the TTC system since the beginning of the pandemic, viewing the system as a whole as well as investigating how the recovery trend varies according to geography, time of day, and trip purposes. The second question explores what factors and variables have been driving the recovery, by giving greater context to these initial findings, in turn allowing conclusions and correlations to be drawn between transit ridership and other elements of Toronto’s urban activity system. The insights obtained from exploring these questions will be relevant in informing the next phase of research, which proposes to develop time series models to forecast ridership trends based on external variables, allowing transit agencies to optimize their services more proactively.
This study takes an exploratory look at ridership recovery, primarily leveraging wireless fidelity (Wi-Fi) device connections gathered from TTC subway stations. All subway stations in the system are equipped with Wi-Fi access points at the street, concourse, and platform levels, allowing Wi-Fi enabled devices to be tracked through their service set identifier (SSID) as they move through the system. In turn, this allows user journeys to be fully reconstructed from origin to destination, assuming that individual users can be reliably proxied by their device connections. Because device SSIDs do not change between subsequent visits to the subway system, riding behavior between trips and over time can be examined as well.
The “device journeys” that are reconstructed from the Wi-Fi connections form the main basis for the analysis in this study. Unique journeys are aggregated according to origin or destination station, region of the city, time of day, day of week, or month and year. Assuming that device journeys are a representative sample of overall subway trips made, patterns in ridership can be identified and compared, revealing any interesting temporal or geographic variations. Other data sources will also be discussed to provide additional context wherever relevant, such as official ridership statistics published by the TTC or third-party compiled office occupancy data. Analysis will focus on the duration and immediate recovery from the pandemic, from 2020 to late 2022.
Literature Review
Industry Reports and Trends
The topic of ridership recovery is obviously of key concern to transit operators themselves. Many large transit agencies across Canada have therefore been reporting the state of ridership recovery at regular intervals over the course of the pandemic. Nationwide, transit ridership fell to 16% of pre-COVID levels in April 2020, before recovering to approximately 78% as of May 2023 ( 5 ). A similar situation has been observed in the United States, with a national average of 76% recovery in February 2023, with buses consistently outperforming rail services ( 6 ).
In Toronto, the TTC experienced an initial decrease in ridership to 29% of normal levels. By fall 2021, the top bus routes for ridership recovery were concentrated in major employment centers and equity-seeking neighborhoods, whereas those with the lowest recovery served more affluent residential areas or the downtown core ( 7 ). By March 2023, system-wide ridership had recovered to 70% on weekdays and 80% on weekends ( 4 ). Meanwhile, GO Transit’s weekend recovery has trended at about double that of weekdays, with full 100% recovery being exceeded on weekends during summer 2022, driven by fare discounts and promotional marketing ( 8 ).
Similar trends have been observed elsewhere. In Vancouver, TransLink ridership fell to 17% of pre-pandemic levels in April 2020, recovering to 41% by fall 2020 and 79% by fall 2022 ( 9 , 10 ). Across all periods, the bus network outperformed rapid transit and commuter rail service for ridership retention and recovery. Retention was weakest in central Vancouver and strongest on routes that served essential employment, often in suburban areas. In Ottawa, which saw the highest rates of remote work among major Canadian cities, ridership recovery increased from 14% in May 2020 to 64% by September 2022 ( 11 ).
Determinants of Pandemic Ridership
Such findings have naturally motivated research into discovering the underlying drivers of ridership recovery, and a literature has emerged investigating the pandemic’s impact from multiple perspectives. Nearly all research in the North American context indicates that low income and non-white riders were consistently the most likely to continue using transit during the pandemic, whereas more affluent riders greatly reduced their transit use immediately and have been slower to return. This has been demonstrated by studies in individual cities, including by Roy ( 12 ) and Osorio et al. ( 13 ) in Chicago, Jiao et al. ( 14 ) in Austin, and Kurzhanskiy and Lapardhaja ( 15 ) in the San Francisco Bay Area, as well as others that compare multiple North American cities concurrently ( 16 – 18 ). Such riders often lack alternative transportation and are frequently employed in essential industries such as healthcare and manufacturing, highlighting the vital role that transit plays in facilitating access for workers in these fields ( 19 , 20 ). Indeed, such destinations often saw the smallest ridership declines in the initial stages of the pandemic. Several studies found that larger agencies, which attract a larger base of “choice” riders, experienced greater ridership declines than smaller cities ( 19 , 21 ).
Other studies have attempted to tie ridership declines to customer attitudes and behaviors. Osorio et al. ( 13 ) modeled rapid transit usage in Chicago using a Bayesian structural time series, finding that government-imposed executive orders had a larger effect on ridership than public fear related to the coronavirus. Similarly, Xin et al. ( 22 ) used the synthetic control method to model ridership declines in several Chinese cities, showing that the severity of travel restrictions was a larger determinant of the recovery trajectory than infection rate. Others have investigated how mode choices have evolved; Wang and Noland ( 23 ) and Kim and Cho ( 24 ) point to bike sharing as a popular alternative to transit during the pandemic in New York City and Seoul, respectively, whereas Bike Share Toronto ( 25 ) reported record-breaking usage in 2020 even as subway ridership remained depressed. Palm et al. ( 26 ) surveyed transit users in Toronto and Vancouver and found that the pandemic increased the attractiveness of driving among frequent pre-pandemic riders, potentially contributing to road congestion and undermining the return to transit. Magassy et al. ( 27 ) similarly found that shifts toward driving and remote work may limit transit ridership to about 70% of pre-COVID levels.
Other studies and reports discuss the recovery rather than the initial phase of the pandemic, often aimed at developing recommendations for operators. Restructured fare policies are frequently cited as an opportunity to attract riders. Ziedan et al. ( 28 ) identified fare-free transit as a reason for fast recoveries in Tucson and Worcester. Owen ( 29 ) found that discretionary travel has replaced commuting as the most common trip purpose on the Metrolink rail system in Southern California, and that many regional rail agencies have embraced such travel through promotional fares and marketing. Morgan-Roselló ( 30 ) similarly proposed new fare products for the Massachusetts Bay Transportation Authority commuter rail system to attract less frequent riders, whereas Mashrur et al. ( 31 ) found fare integration would encourage more transit use in the Greater Toronto Area. For a longer-term view, Shaheen and Wong ( 32 ) hosted a recovery-focused workshop with transit practitioners and stakeholders, identifying the need to continue financial and political support for transit, address equity issues, and encourage innovation.
Transit Data Sources
The research described previously typically studies transit ridership either at an aggregated level or adopting a qualitative approach; meanwhile, there has been comparatively little research that attempts to explore and quantify dimensions of ridership recovery at a more disaggregate level by investigating different transit travel submarkets. Filling this literature gap requires a suitably disaggregated data source that can provide a very detailed representation of mobility patterns for time and space.
A variety of such data sources can be found in the literature. Halvorsen et al. ( 33 ) discussed the deployment of automated passenger counter (APC) systems on New York City’s bus and subway systems to monitor ridership during COVID-19, whereas Zaragozí et al. ( 34 ) conducted a similar analysis of urban bus ridership using fare card data from the Camp de Tarragona region of Spain. Parker et al. ( 16 ) and Chapple et al. ( 35 ) used GPS-enabled smartphone trajectory data to track individuals’ transit riding habits and visitor activity in downtown cores, respectively, whereas studies such as Gu et al. ( 36 ) use Wi-Fi records to similar ends.
Unfortunately, most of the prementioned data sources are ill-suited to the proposed analysis. APC data cannot be used to link trip origins and destinations, and fare card data are similarly limited as the Toronto subway is tap-in only, and so a rider’s destination cannot be determined. Smartphone trajectories are also not feasible as over three-quarters (58 of 75) of TTC subway stations are underground and lack cell signal access. Given that public Wi-Fi access is provided in every TTC subway station, Wi-Fi connections were identified as the most suitable data source to reconstruct detailed travel patterns over time.
The London Underground was among the first rapid transit systems to receive a wide rollout of public Wi-Fi access in stations, with Transport for London ( 37 ) finding clear potential for applications including ridership analysis and real-time vehicle crowding. Academic research into the viability of transit Wi-Fi data has likewise branched out into numerous use cases, such as estimation of transfer times at subway stations ( 38 ), monitoring of waiting passengers at bus stops ( 39 ), and numerous studies into the estimation of O-D flows for transit passengers ( 40 – 43 ). Most of the latter studies have focused on O-D estimation for bus passengers only, often for a much smaller system than the TTC subway. El-Tawab et al. ( 41 ) and Ryu et al. ( 42 ), for example, used the bus system of a university campus in Charlottesville, Virginia, with fewer than 10 bus stops as a testbed. Fewer studies exist into O-D demand estimation for large urban rail systems, usually proposing methods for reconstructing and predicting passenger flows ( 44 , 45 ). For example, Da Silva et al. ( 46 ) used data from the Toronto subway to develop a methodology for more reliable estimation of trip origins and destinations, including the use of AFC data to aid with calibration. The balance of the current literature suggests that Wi-Fi records already have the potential to reliably address some transit data needs.
Nonetheless, past work has also left gaps and opportunities for the proposed research. Much of the past research into demand analysis using Wi-Fi has typically focused on the trip reconstruction or ridership estimation process itself; discussions related to spatiotemporal patterns that are revealed through the analysis of Wi-Fi data, or the evolution of those patterns over time, are neglected, despite such details being of primary concern to transit planners. There has also been a lack of such research that focuses on data from the COVID-19 pandemic itself. In light of such gaps, this study aims to extend past research by applying Wi-Fi records to the specific problem of understanding how riding habits on the Toronto subway are changing over the pandemic. In doing so, the proposed research links the opportunities that are afforded by the advent of emerging transit data sources with discussions surrounding the impact of the COVID-19 pandemic on society, individuals, and their travel behaviors, as well as the resulting implications for transit agencies such as the TTC.
Methodology
Data
The analysis presented in this study is primarily derived from device journeys obtained from Wi-Fi connection records. All TTC subway stations are equipped with Wi-Fi access points, operated and maintained by BAI Communications Canada (recently acquired by Rogers). A “device journey” is constructed from multiple successive connections made by the same Wi-Fi enabled device as it continually reconnects to the nearest access point as its owner carries it while traveling on the subway system. Device journeys typically begin at the street-level entrance of the origin station, followed by the concourse and platform levels in that order. After boarding, the device will connect to platform-level access points at each station the rider passes, and the device journey ends with access points at the platform, concourse, and street-level exit at the destination station. This allows detailed information about a rider’s origin, destination, travel time, and exact route to be determined reliably in most cases, which in turn can be aggregated to draw conclusions about larger trends and patterns.
Drawing these conclusions requires the assumption that Wi-Fi device journeys are a reasonably good proxy for ridership, and that the subset of riders carrying these devices comprise a representative cross section of all riders. To verify this, official station-level subway boarding and alighting statistics for fall 2022 reported by the TTC were compared with station-level Wi-Fi counts from the same period (
47
). The cosine similarity, a measure of similarity based on the angle between two vectors

The similarity was computed to be 0.997, indicating a very close match and suggesting that Wi-Fi does not systematically undercount or overcount riders at specific stations. Figure 2 shows the observed Wi-Fi capture rate by station compared with official statistics, showing that the capture rate is quite consistent between different stations. At nearly all stations, between 15% and 20% of riders are reflected in the Wi-Fi, with the system average being approximately 18%.
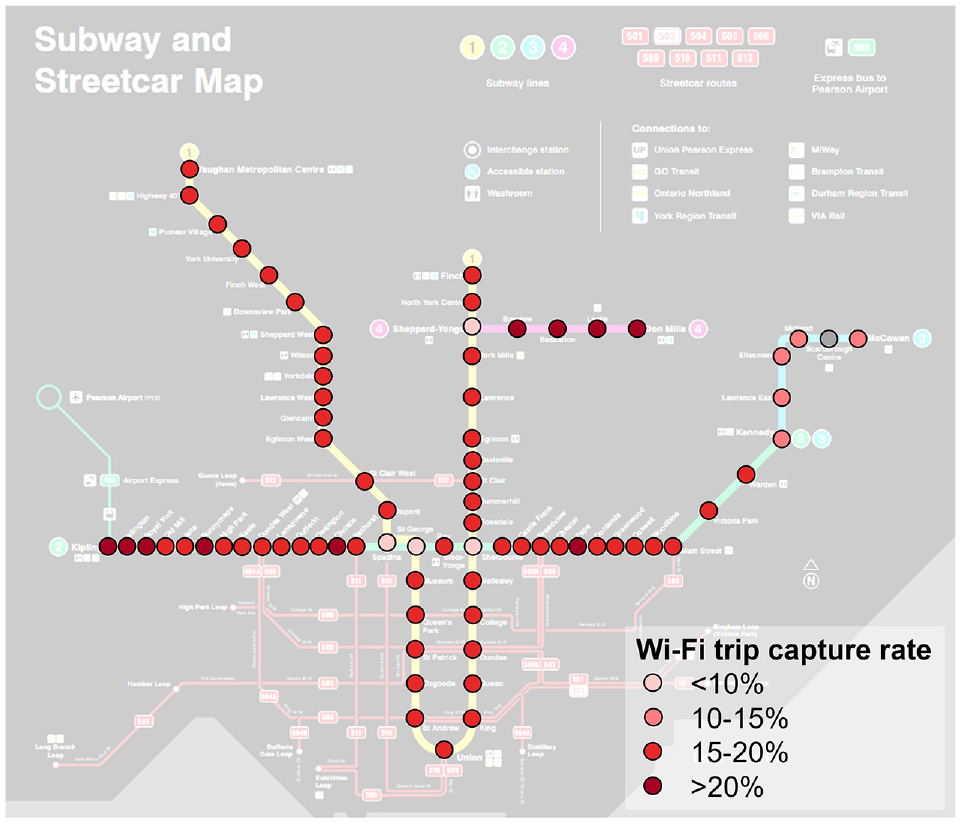
Proportion of boardings and alightings captured through Wi-Fi records by station, fall 2022.
Nonetheless, note that the results in this study are discussed for device journeys rather than riders, as it is difficult to conclusively verify whether Wi-Fi provides a representative sampling of other trip and rider characteristics (e.g., day of week/time of day of travel, trip purpose, age, income). For example, it is conceivable that Wi-Fi records may undersample communities with lower rates of mobile device ownership, with obvious equity implications as a result. Some demographic information is available from census and TTS data, the latter of which is discussed in the following sections; however, these sources are neither detailed nor timely enough to act as a ground truth against which the Wi-Fi data can be compared.
The use of Wi-Fi data provides several advantages for the purposes of this study. The main benefit comes from Wi-Fi data’s ability to provide detailed origin, destination, and routing data for every trip recorded, which is not available from fare card or APC data in Toronto. Different trips made by the same device can be linked to the same rider, allowing transit usage between trips to be observed. Wi-Fi also has some practical advantages, as it is collected passively and continuously across the whole system, producing a large volume of data at extremely low cost. Given these facts, Wi-Fi can be extremely powerful at providing a very comprehensive sampling of journeys taken on the subway system.
There are further qualities that, although not leveraged in this specific research, may be of interest to transit agencies. For example, in most cases Wi-Fi data can be set up to provide agencies with a near-continuous data stream, allowing analysis to be performed in close to real-time and allowing issues to be identified proactively. Device SSIDs are anonymized as well, which may mitigate customer privacy concerns surrounding closed-circuit television footage or fare card accounts.
Conversely, as a product of this anonymity, a drawback is that very little additional information about a rider or trip is attached to the Wi-Fi records themselves, although this issue is present to some degree in many other emerging data sources. As a result, further analysis of Wi-Fi records with respect to travel demographics or trip purposes is challenging. Therefore, supplementary data sources have been leveraged for this study, most notably data from the 2016 TTS, which does provide detailed information on trip purposes and rider information. As the TTC system and activity patterns in Toronto have changed substantially in the 6 years between the TTS and most recent Wi-Fi data, a quantitative analysis was not undertaken; rather, key TTS results will be used to inform and provide context to the findings based on Wi-Fi records.
Analysis
All analysis is conducted on the basis of reconstructed device journeys across the subway system, as explained previously. This exploratory work is intended as a starting point, the aim of which is to facilitate more rigorous modeling and forecasting, by understanding the post-COVID transit recovery in Toronto from multiple angles and identifying potentially promising avenues of further analysis.
To develop the O-D matrixes presented in this study, the subway system was divided into 10 regions following Da Silva et al. ( 46 ), each corresponding to a different part of the city. This was done to mitigate the impact of sampling noise that would be amplified by a station-pair-level analysis, as well as to aggregate similar stations to produce results that are more geographically interpretable. A map of the regions is shown in Figure 3.
Downtown Toronto, covering all of Line 1 Yonge-University south of Line 2, plus stations on Line 2 Bloor-Danforth from Bathurst to Bloor-Yonge
Line 2 west of Christie
Line 2 east of Sherbourne
Line 1 from Dupont to Eglinton West
Line 1 from Rosedale to Eglinton
Line 1 from Glencairn to Wilson
Line 1 (east leg) north of Lawrence
Line 4 Sheppard
Line 3 Scarborough
Line 1 (west leg) north of Sheppard West
Pre-pandemic Wi-Fi data for October and November 2019 was used to establish a “baseline” against which recovery can be measured. Based on this period, O-D matrixes between regions were calculated for different times of day to understand variations in subway travel habits before COVID-19.
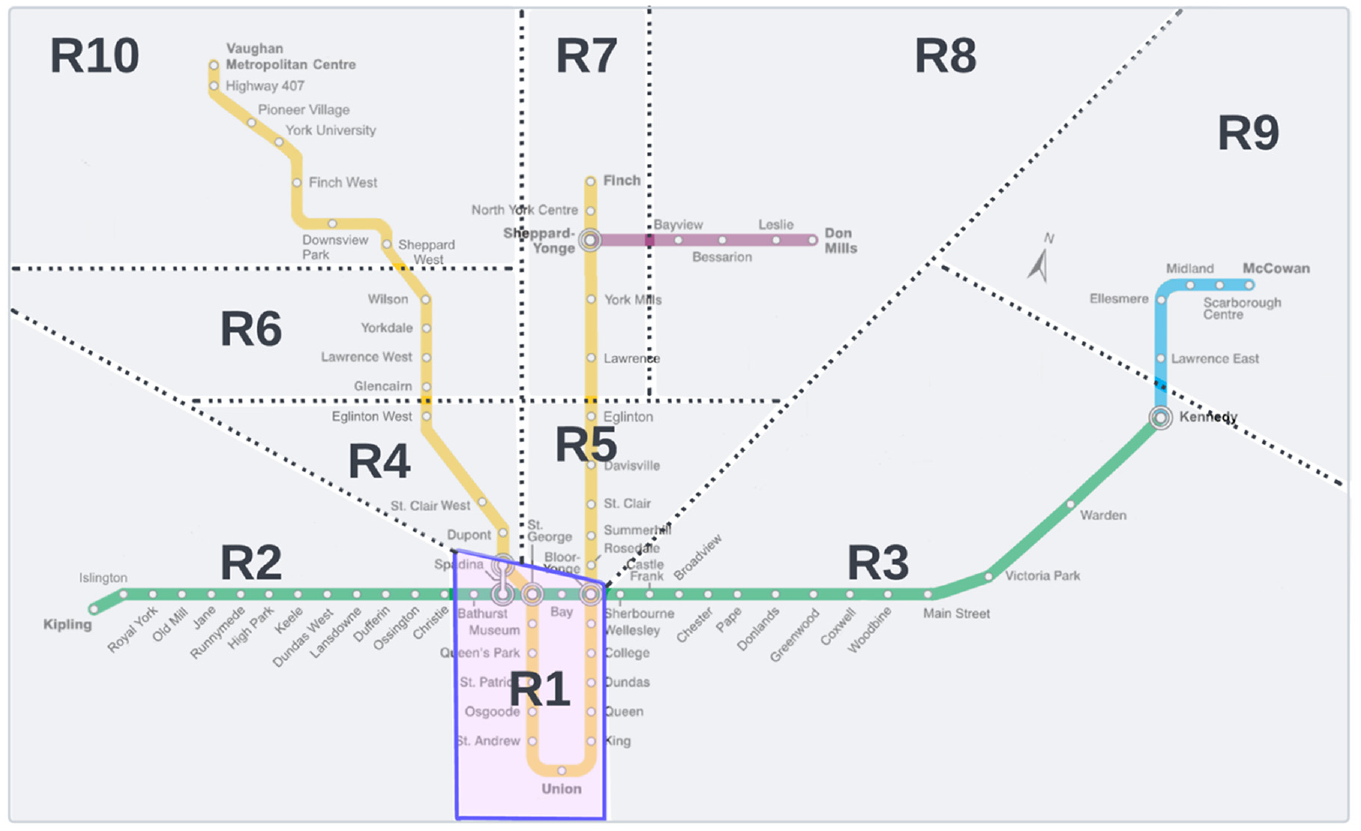
Regional classification for the Toronto subway system ( 46 ).
This analysis focused on the duration and short-term recovery from the COVID-19 pandemic, using data from August 2020 to October 2022. Visualizations include plots of recovery over time, both system-wide and for specific stations, selected to highlight particular trends. O-D matrixes were generated at regular intervals to track the progression of returning devices, with a more in-depth breakdown provided and explored for the most recent data (September and October 2022).
Trends in Recovery
Pre-COVID Baseline
Before any discussion of post-COVID ridership trends, a “baseline” representing pre-pandemic travel patterns on the TTC subway must be established. Figure 4 shows a plot of boardings plus alightings by station according to official TTC statistics in the fall of 2019 ( 48 ). As might be expected, the busiest stations were interchanges such as Bloor-Yonge, St. George, and Sheppard-Yonge, along with terminal stations such as Kennedy and Finch, as well as Union that connects to regional rail service. Stations with fewer than 10,000 daily boardings and alightings are mainly located along Lines 3 and 4, which serve suburban areas with few transit-supportive destinations.
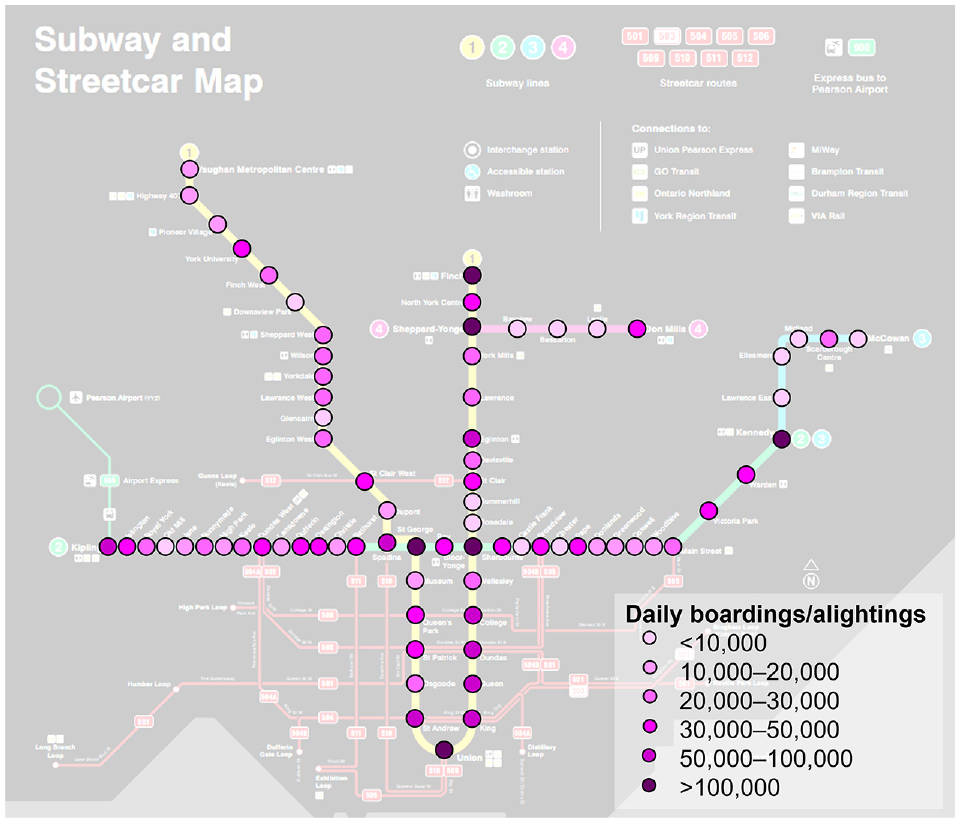
Typical weekday boardings and alightings by station, fall 2019.
For this analysis, Wi-Fi data records between 28 October and 30 November 2019 were used to generate O-D matrixes of typical travel between the regions defined previously. The following matrices show the proportion of all Wi-Fi device journeys made in the particular O-D region pairing.
Figure 5 shows the proportion of travel between regions during a typical weekday over the entire span of subway services. The role of downtown (Region 1) as a travel destination is evident, as nearly six in ten subway trips are made either to, from, or within the downtown stations. Other primary travel markets are local trips along Line 2 (Regions 2 and 3), comprising just over 11% of trips, and travel within Regions 7 and 10, representing roughly 4.6% and 3.0% of trips, respectively. Almost zero trips were observed for certain O-D pairs, such as between Line 3 and Line 4 stations (Zones 8 and 9), as such customers would typically opt to take a more direct bus instead.
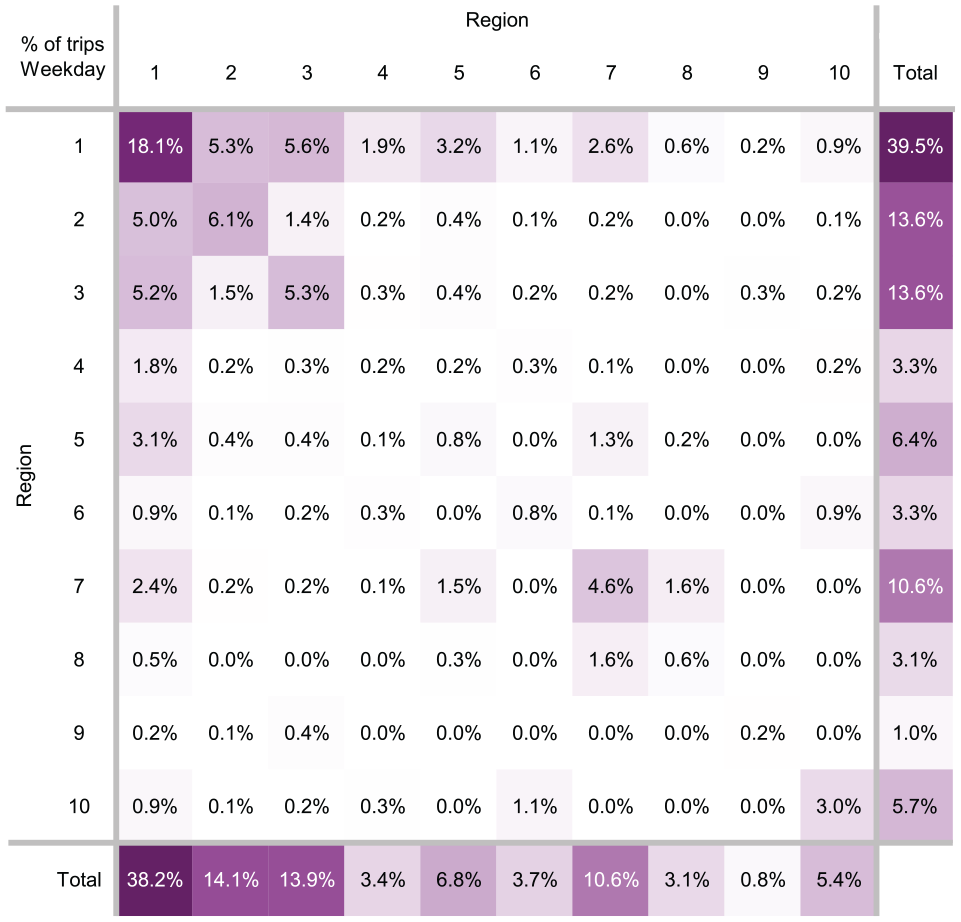
Percentage of trips by origin–destination (O-D) region pair, all-day weekdays, fall 2019.
Figure 6 shows the travel between regions for a typical weekday morning peak period (06:00 to 08:59) only. The prominence of the commuting travel toward downtown Toronto is clearly seen, with nearly half of system-wide trips destined to Region 1 during this period. Compared with all-day travel, Regions 2, 3, 4, and 8 see noticeably higher proportions of trip origins, whereas Regions 1, 5, and 7 conversely see more trip destinations.
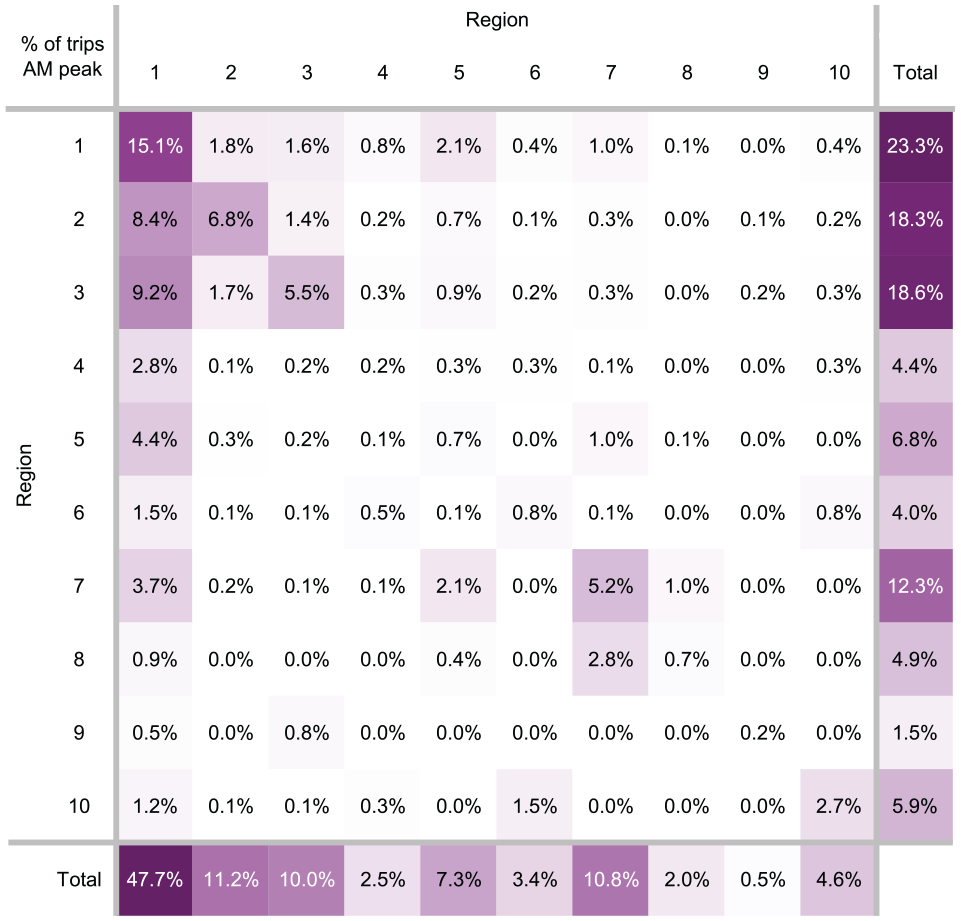
Percentage of trips by origin–destination (O-D) region pair, weekday morning peak period, fall 2019.
Figures 7 to 9 present O-D matrices for typical weekday midday (09:00 to 14:59), afternoon peak (15:00 to 18:59), and evening (19:00 to 23:59) periods. The midday period sees downtown-bound trips remaining the dominant travel market; the afternoon peak and evenings matrixes resemble the transpose of the morning peak and midday, respectively, as subway riders leave downtown for the suburbs.
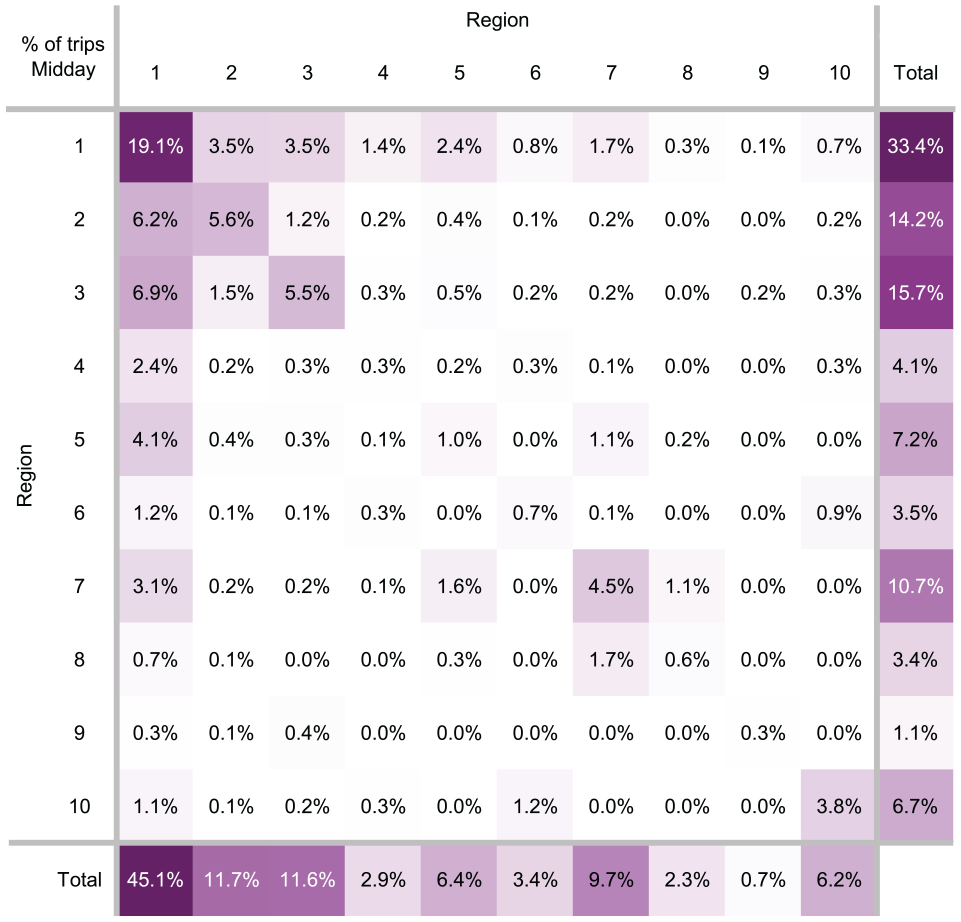
Percentage of trips by origin–destination (O-D) region pair, weekday midday, fall 2019.
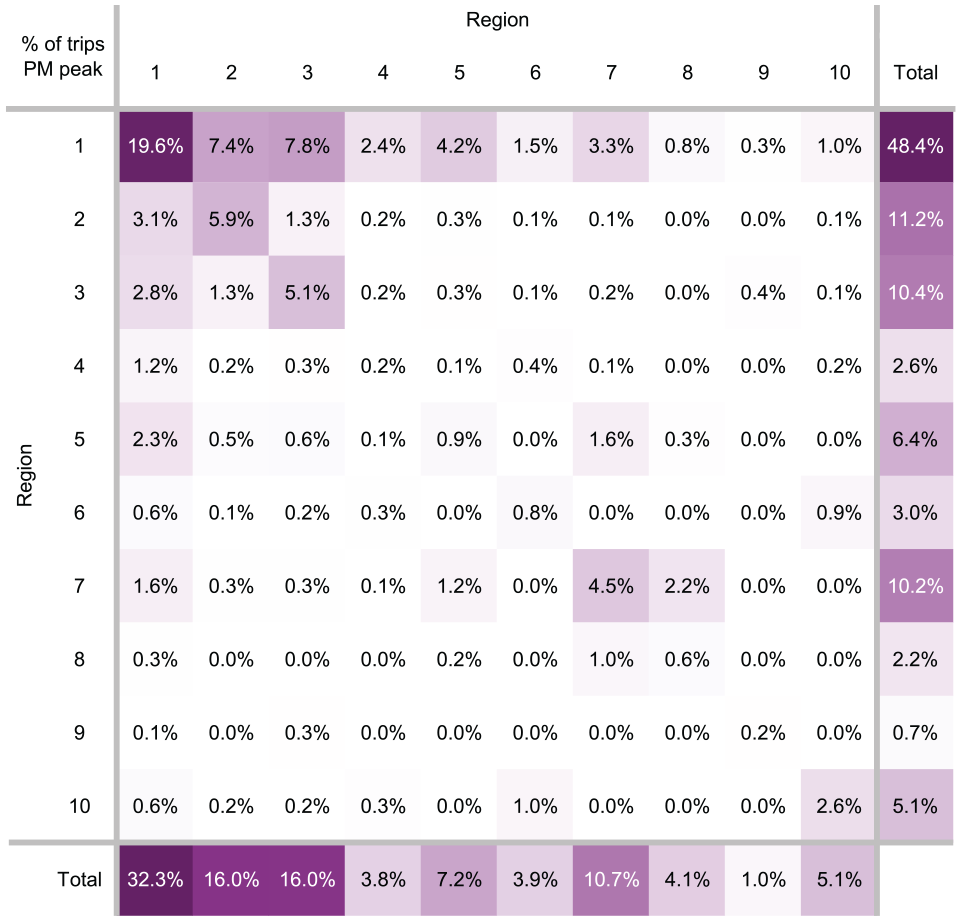
Percentage of trips by origin–destination (O-D) region pair, weekday afternoon peak period, fall 2019.
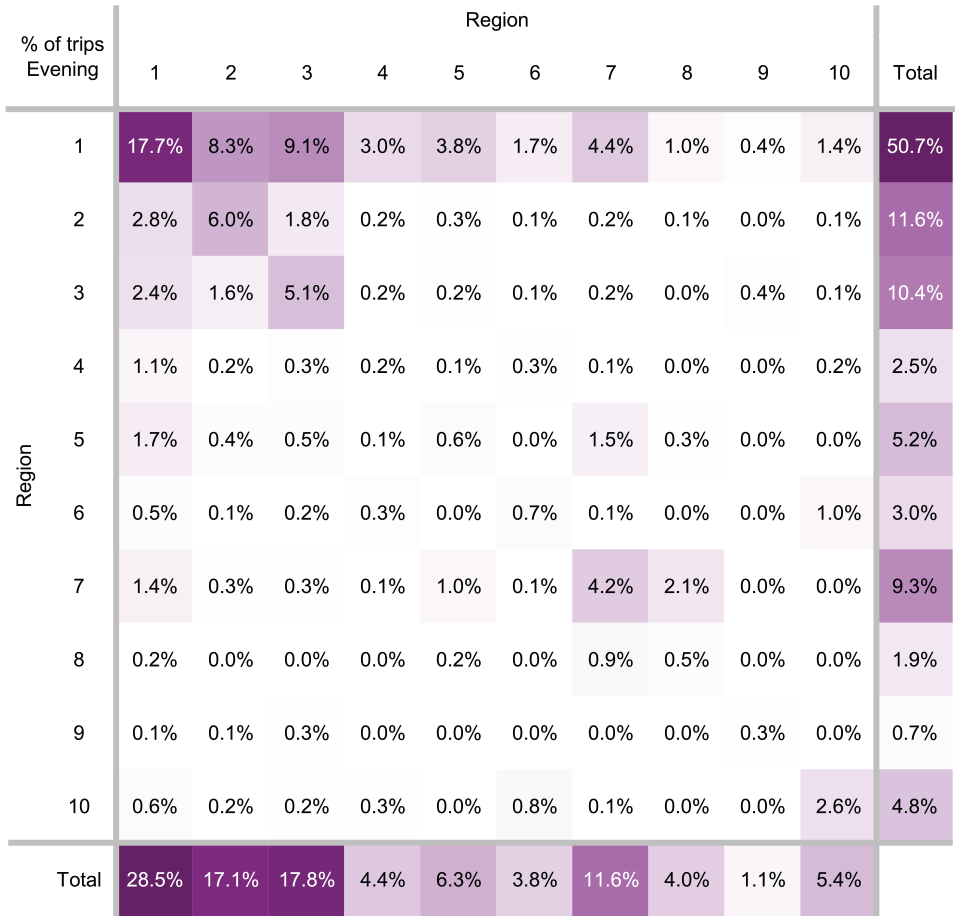
Percentage of trips by origin–destination (O-D) region pair, weekday evenings, fall 2019.
Figure 10 shows the O-D matrix for subway usage on a typical Saturday. In general, travel is more local and dispersed across the city on weekends; subway usage between downtown stations drops from 18.1% of trips to 17.1%, whereas travel along Line 2 (Regions 2 and 3) increases from 14.1% to 16.6% of trips. In absolute terms, Saturday ridership is estimated to be approximately 52% of weekday levels. Such results provide an initial picture of the state of subway ridership just before COVID-19; downtown-oriented travel, much of which comprised work and school commuting from across the city, was a primary driver of weekday ridership, whereas weekends saw a higher proportion of riders traveling within their local areas instead of going all the way downtown.
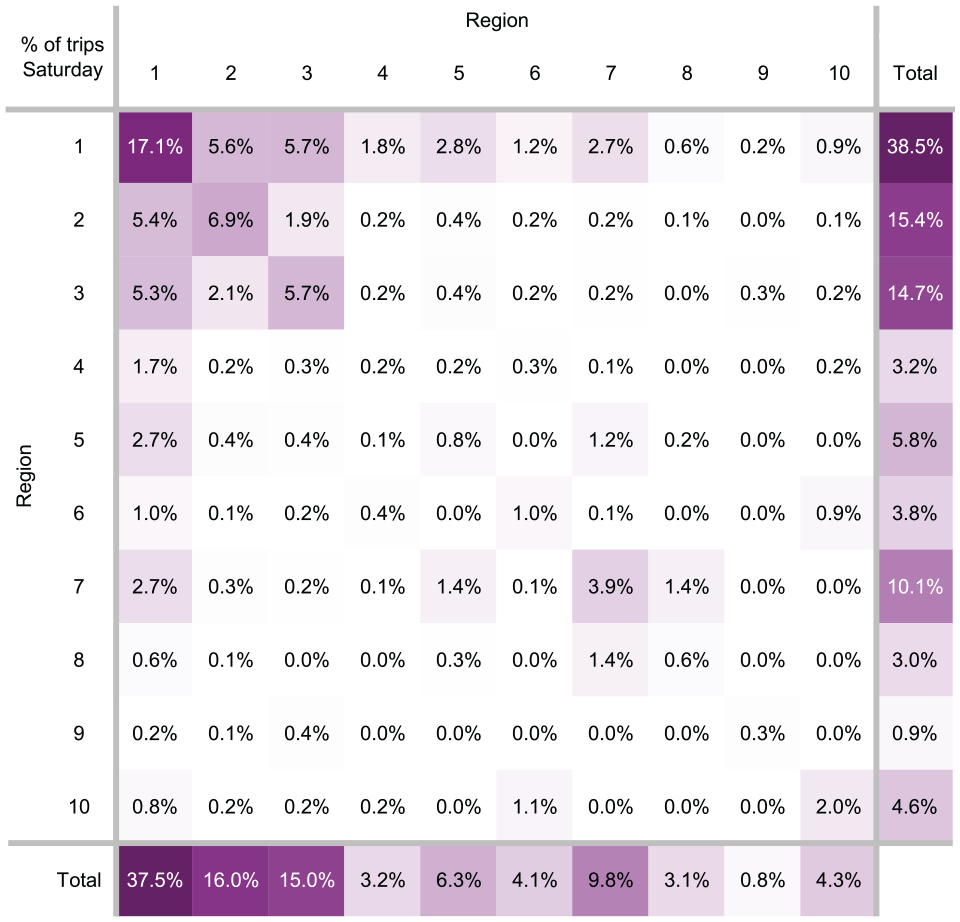
Percentage of trips by origin–destination (O-D) region pair, Saturdays, fall 2019.
System-Wide Recovery
As previously stated, transit ridership in Toronto fell dramatically immediately after COVID-19 hit. By fall 2020, system ridership had started to rebound from its pandemic low point, although neither linearly nor uniformly.
Figure 11 shows the number of Wi-Fi device journeys recorded per day between September 2020 and October 2022, with the 7-day moving average superimposed. The count remained low through the winter of 2020 to 2021, with a steady upward trend from summer 2021, with the progressive loosening of restrictions and rollout of vaccines against COVID-19. The recovery is interrupted by the reintroduction of health restrictions in early 2022 because of concerns over the Omicron variant, but subway ridership quickly resumes its previous recovery trajectory. Subway use then plateaus for the summer, with a sharp increase in September 2022, coincident with the start of the post-secondary academic year. By October 2022, between 140,000 and 180,000 Wi-Fi device journeys on average were recorded on a typical weekday, compared with approximately 240,000 journeys per weekday in 2019.
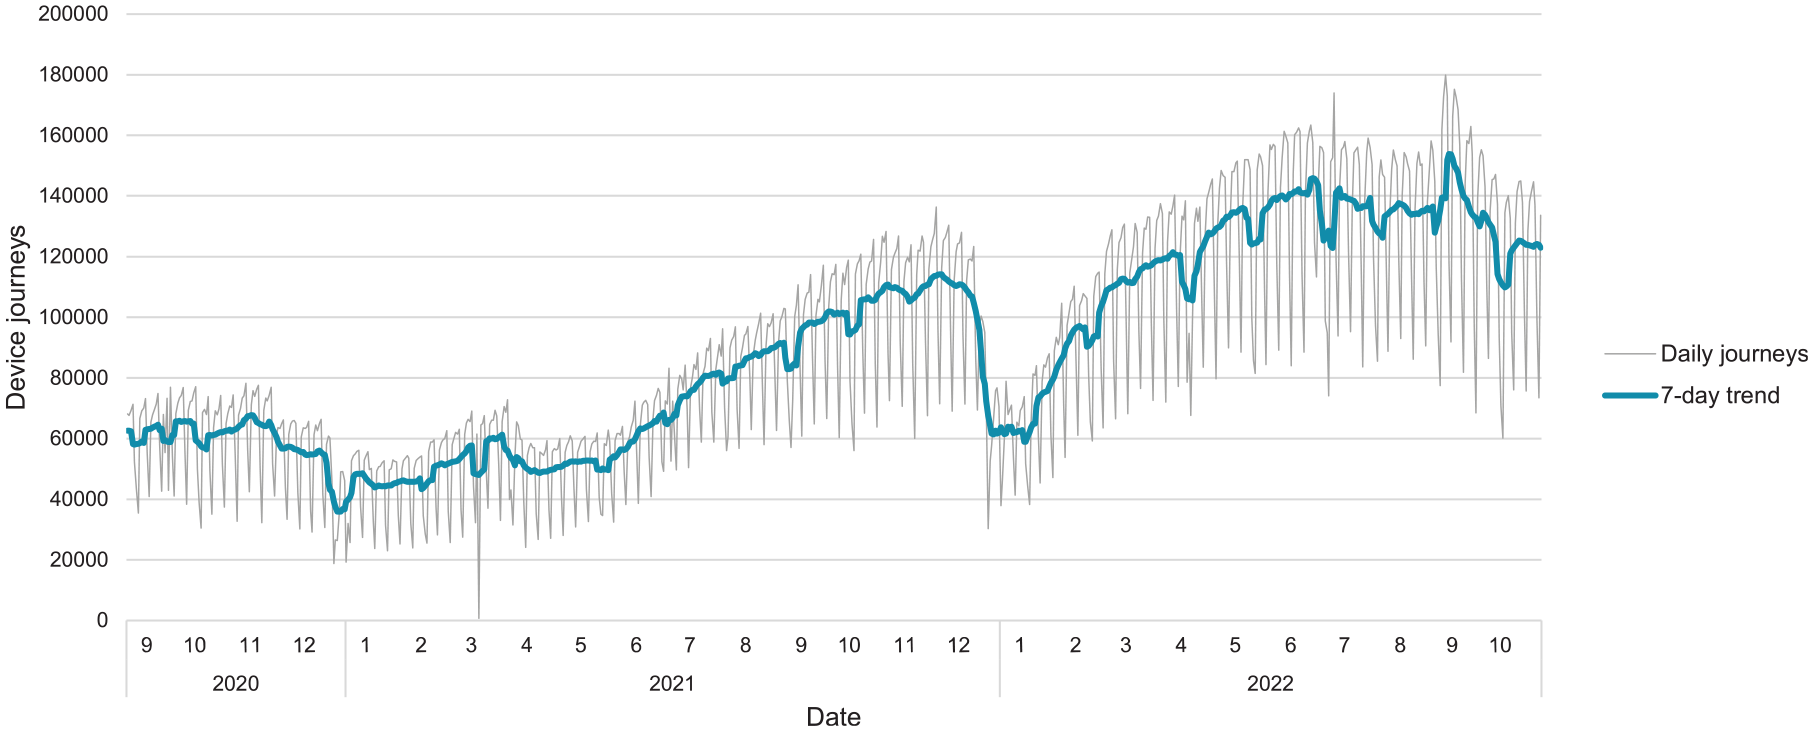
Daily recorded device journeys, system-wide.
Similarly, Figure 12 shows monthly ridership recovery, calculated against a fall 2019 baseline. Recovery based on Wi-Fi records is compared with estimated recovery figures compiled from the TTC’s monthly reports of the chief executive officer. There is a close match between the two curves with the Wi-Fi records somewhat outpacing reported figures, possibly because of ridership demographic changes and the installation of new Wi-Fi access points across the system. Nonetheless, the correlation between the two provides further evidence that Wi-Fi is a credible data source that can be used to track ridership. Overall recovery as of October 2022 was about 62% according to both sources, a slight decrease from September.
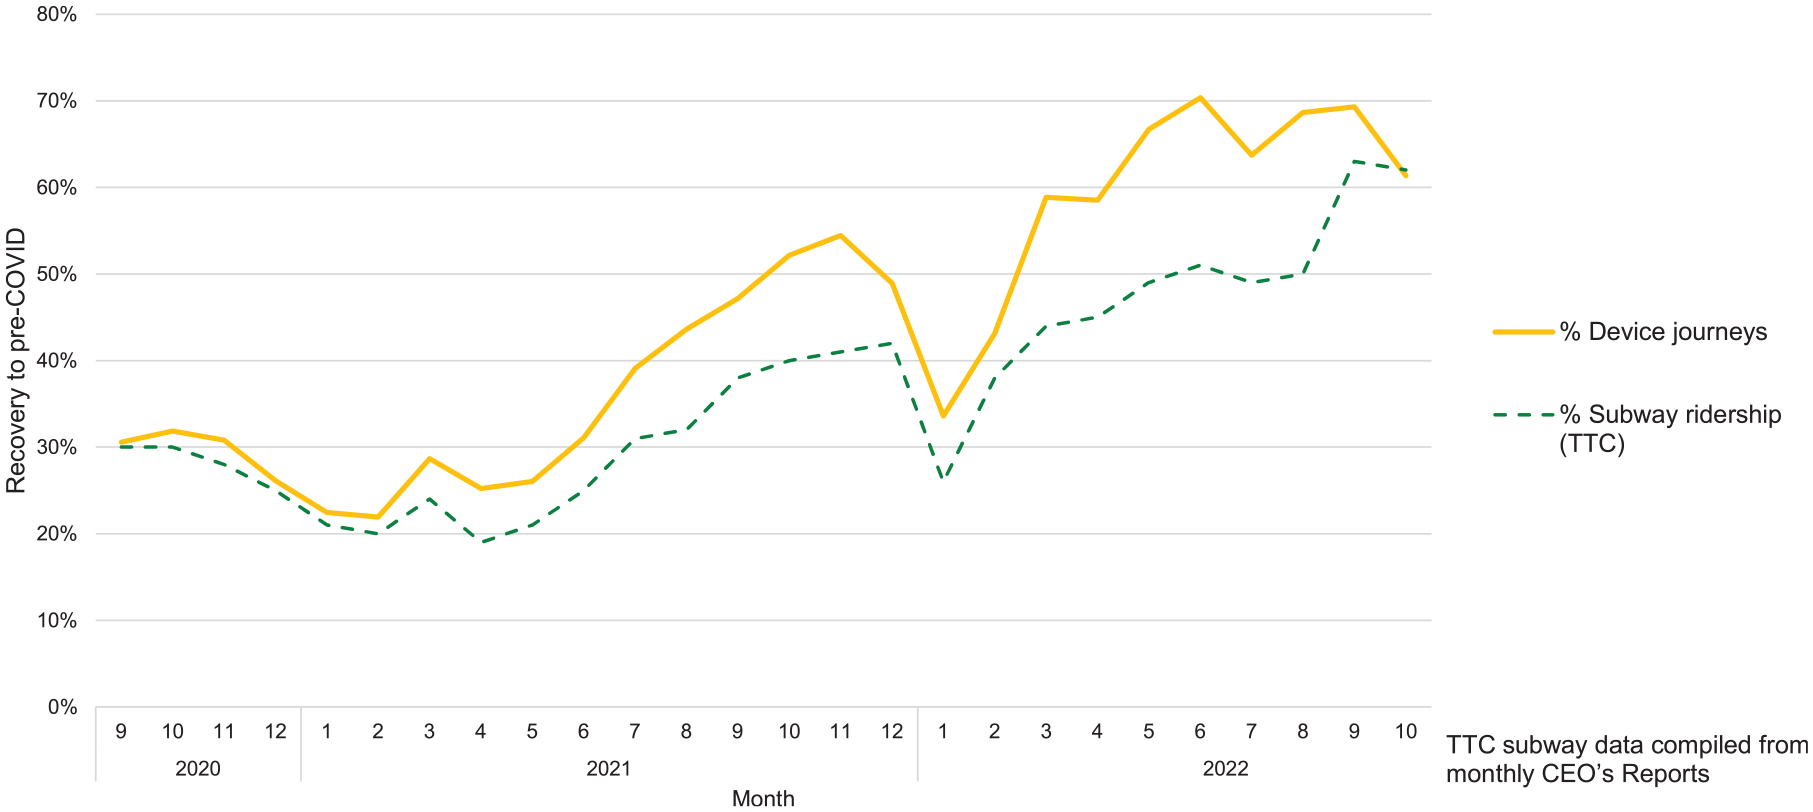
Monthly recovery in Wi-Fi device journeys versus official system ridership.
Recovery by Geography
Of course, it is necessary to go beyond a single number to understand where and when riders are returning. First, Figure 13 presents estimated recovery in weekday boardings for September 2022 for each TTC subway station.
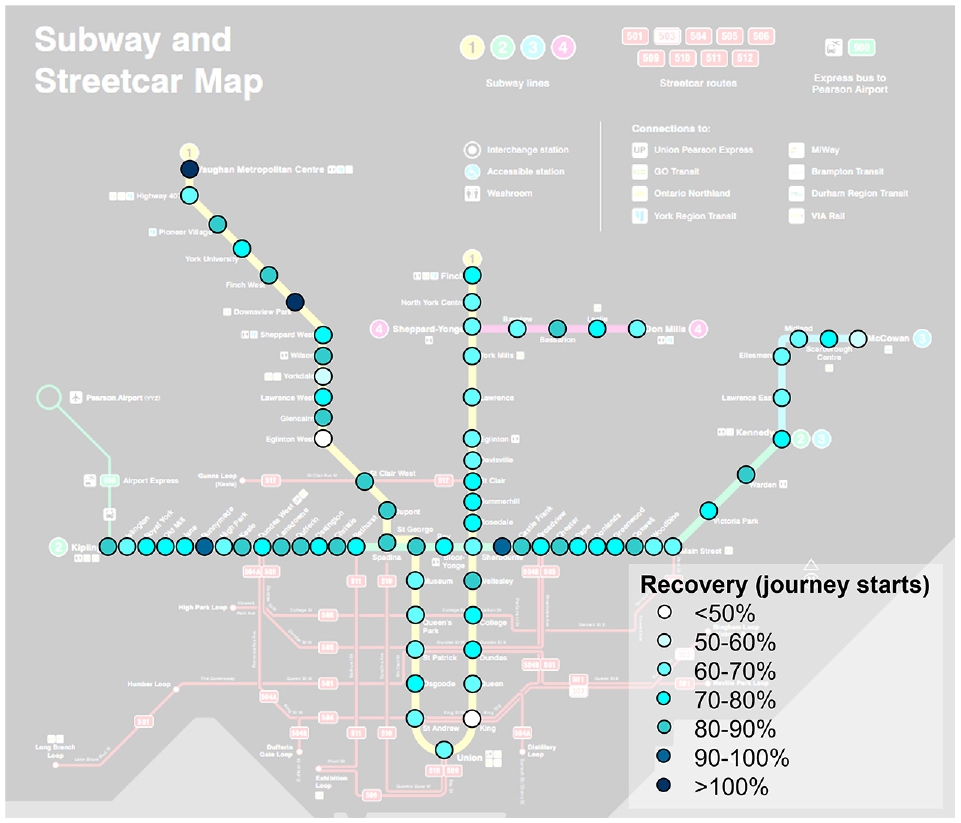
Recovery in device journey starts by station, fall 2019 versus fall 2022.
Based on Wi-Fi journey starts, ridership recovery for most stations lies between 60% and 80%. Riders to stations in the downtown core have been among the slowest to return; King station has seen the lowest recovery in the system, with just 49% of pre-pandemic weekday boardings. Stations with better-than-average recoveries were found along Line 2 both east and west of downtown. Two stations, Downsview Park and Vaughan Metropolitan Centre, were found to have already exceeded pre-COVID activity levels. These findings confirm that the overall post-pandemic recovery has been occurring at different rates across the city while raising questions as to the variables that are driving or hindering this process.
Figures 14 to 16 show the percentage recovery for each O-D region pair over the course of the pandemic, comparing typical weekday journeys in fall 2019 to each following year; cells with fewer than 50 observed journeys in 2019 are masked because of their low sample sizes. Fall 2020 noted system-wide Wi-Fi device journeys at just under 30% of pre-COVID levels. The slowest recovery was found in Region 1 with less than one-quarter of pre-pandemic demand, and internal travel within downtown experienced the slowest recovery by far at under 20% of trips returning. Regions 2, 3, and 6 noted the highest overall ridership retention; travel within and between non-downtown neighborhoods stands between 30% and 60%, pointing to continued transit use for essential travel in such areas.
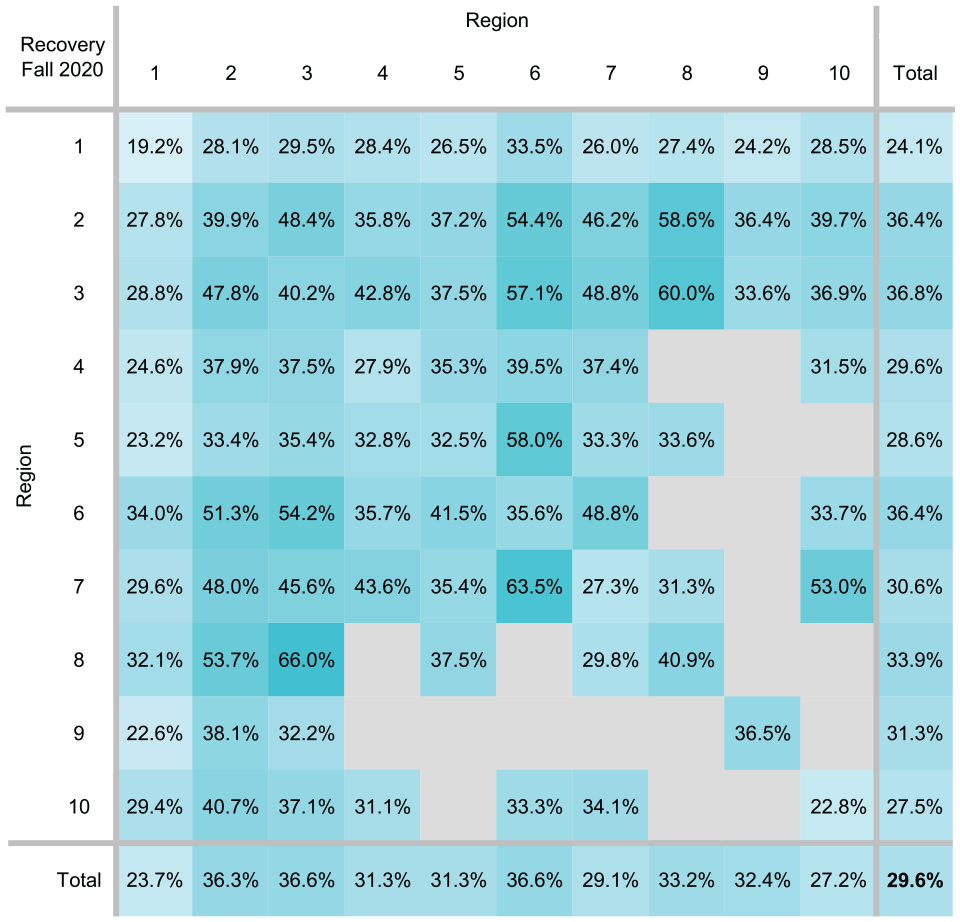
Device journey recovery by origin–destination (O-D) region pair, fall 2020.
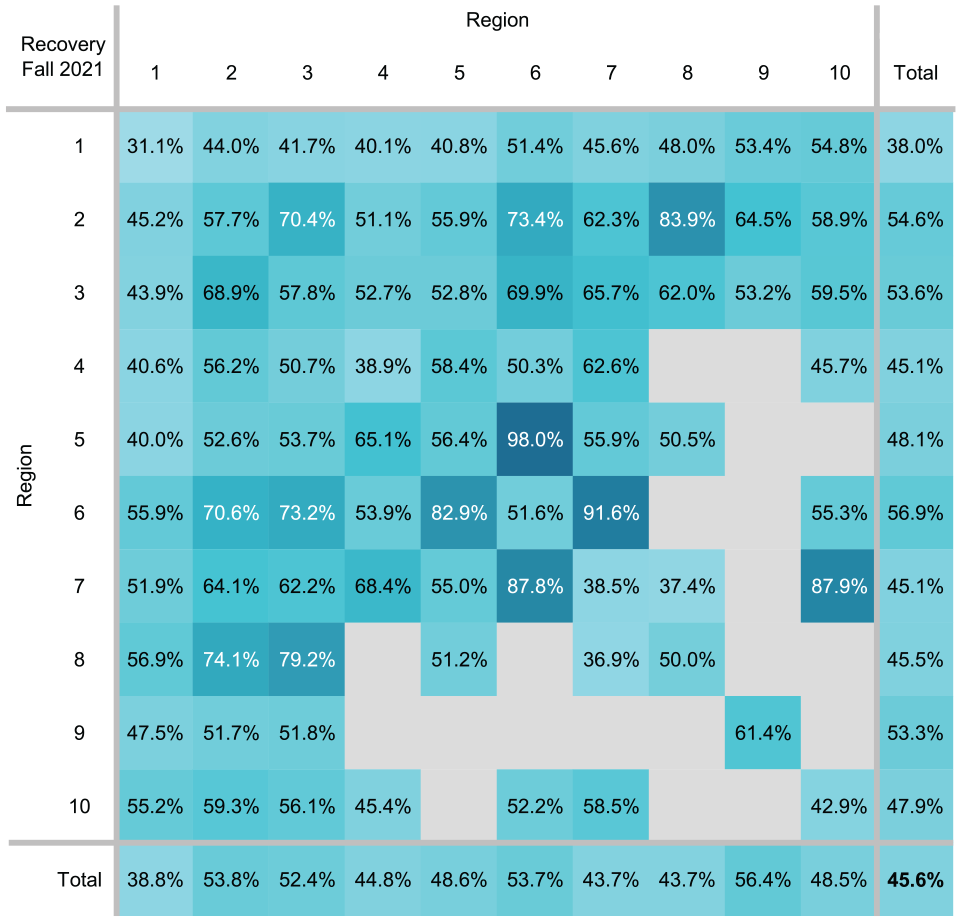
Device journey recovery by origin–destination (O-D) region pair, fall 2021.
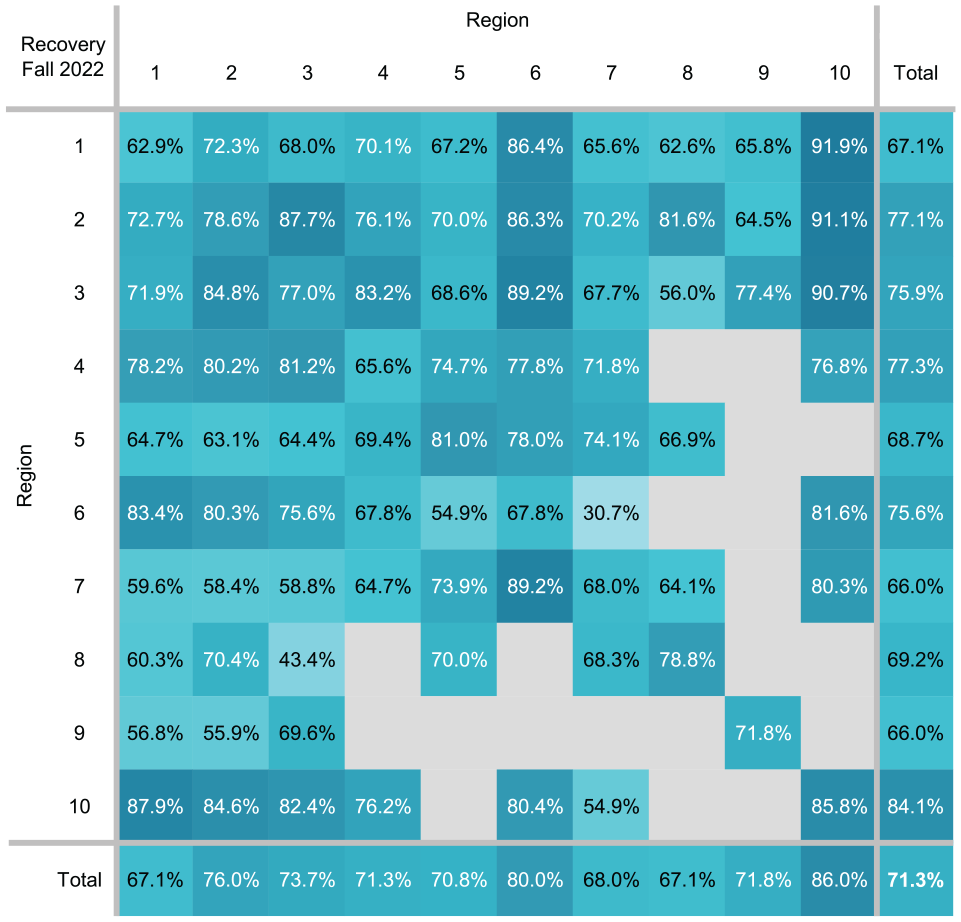
Device journey recovery by origin–destination (O-D) region pair, fall 2022.
By fall 2021, overall recovery progressed to about 45% of pre-COVID levels, with the additional 15% observed roughly uniformly across the system. As in 2020, downtown travel recovery continues to lag behind other regions of the city, at less than 40% overall and just over 30% for trips within downtown. Meanwhile, over half of pre-pandemic journeys have returned in Regions 2, 3, 6, and 9; in addition, travel between downtown and stations on the west leg of Line 1 (Regions 6 and 10) has reached 50% as well.
In fall 2022, recovery accelerated to over 70% of pre-COVID device journeys. The gap in recovery between downtown and the rest of the city has closed somewhat; although downtown continues to see the slowest return, trips to and from downtown nonetheless exceeded two-thirds of their pre-pandemic level, whereas internal travel between Region 1 stations more than doubled to 63% recovery since fall 2021. Region 10, which had among the lowest ridership retentions in fall 2020, leads in recovery with about 85% of its pre-pandemic travel demand, with two of its stations (Downsview Park and Vaughan Metropolitan Centre) seeing Wi-Fi device activity exceeding pre-COVID levels.
To explore the TTC subway’s recovery trajectory in even greater detail, Figure 17 presents daily device journey starts at six subway stations across the city. The stations have been specifically selected to showcase a variety of trip purposes and travel patterns, allowing their differences and evolution to be isolated and teased out.
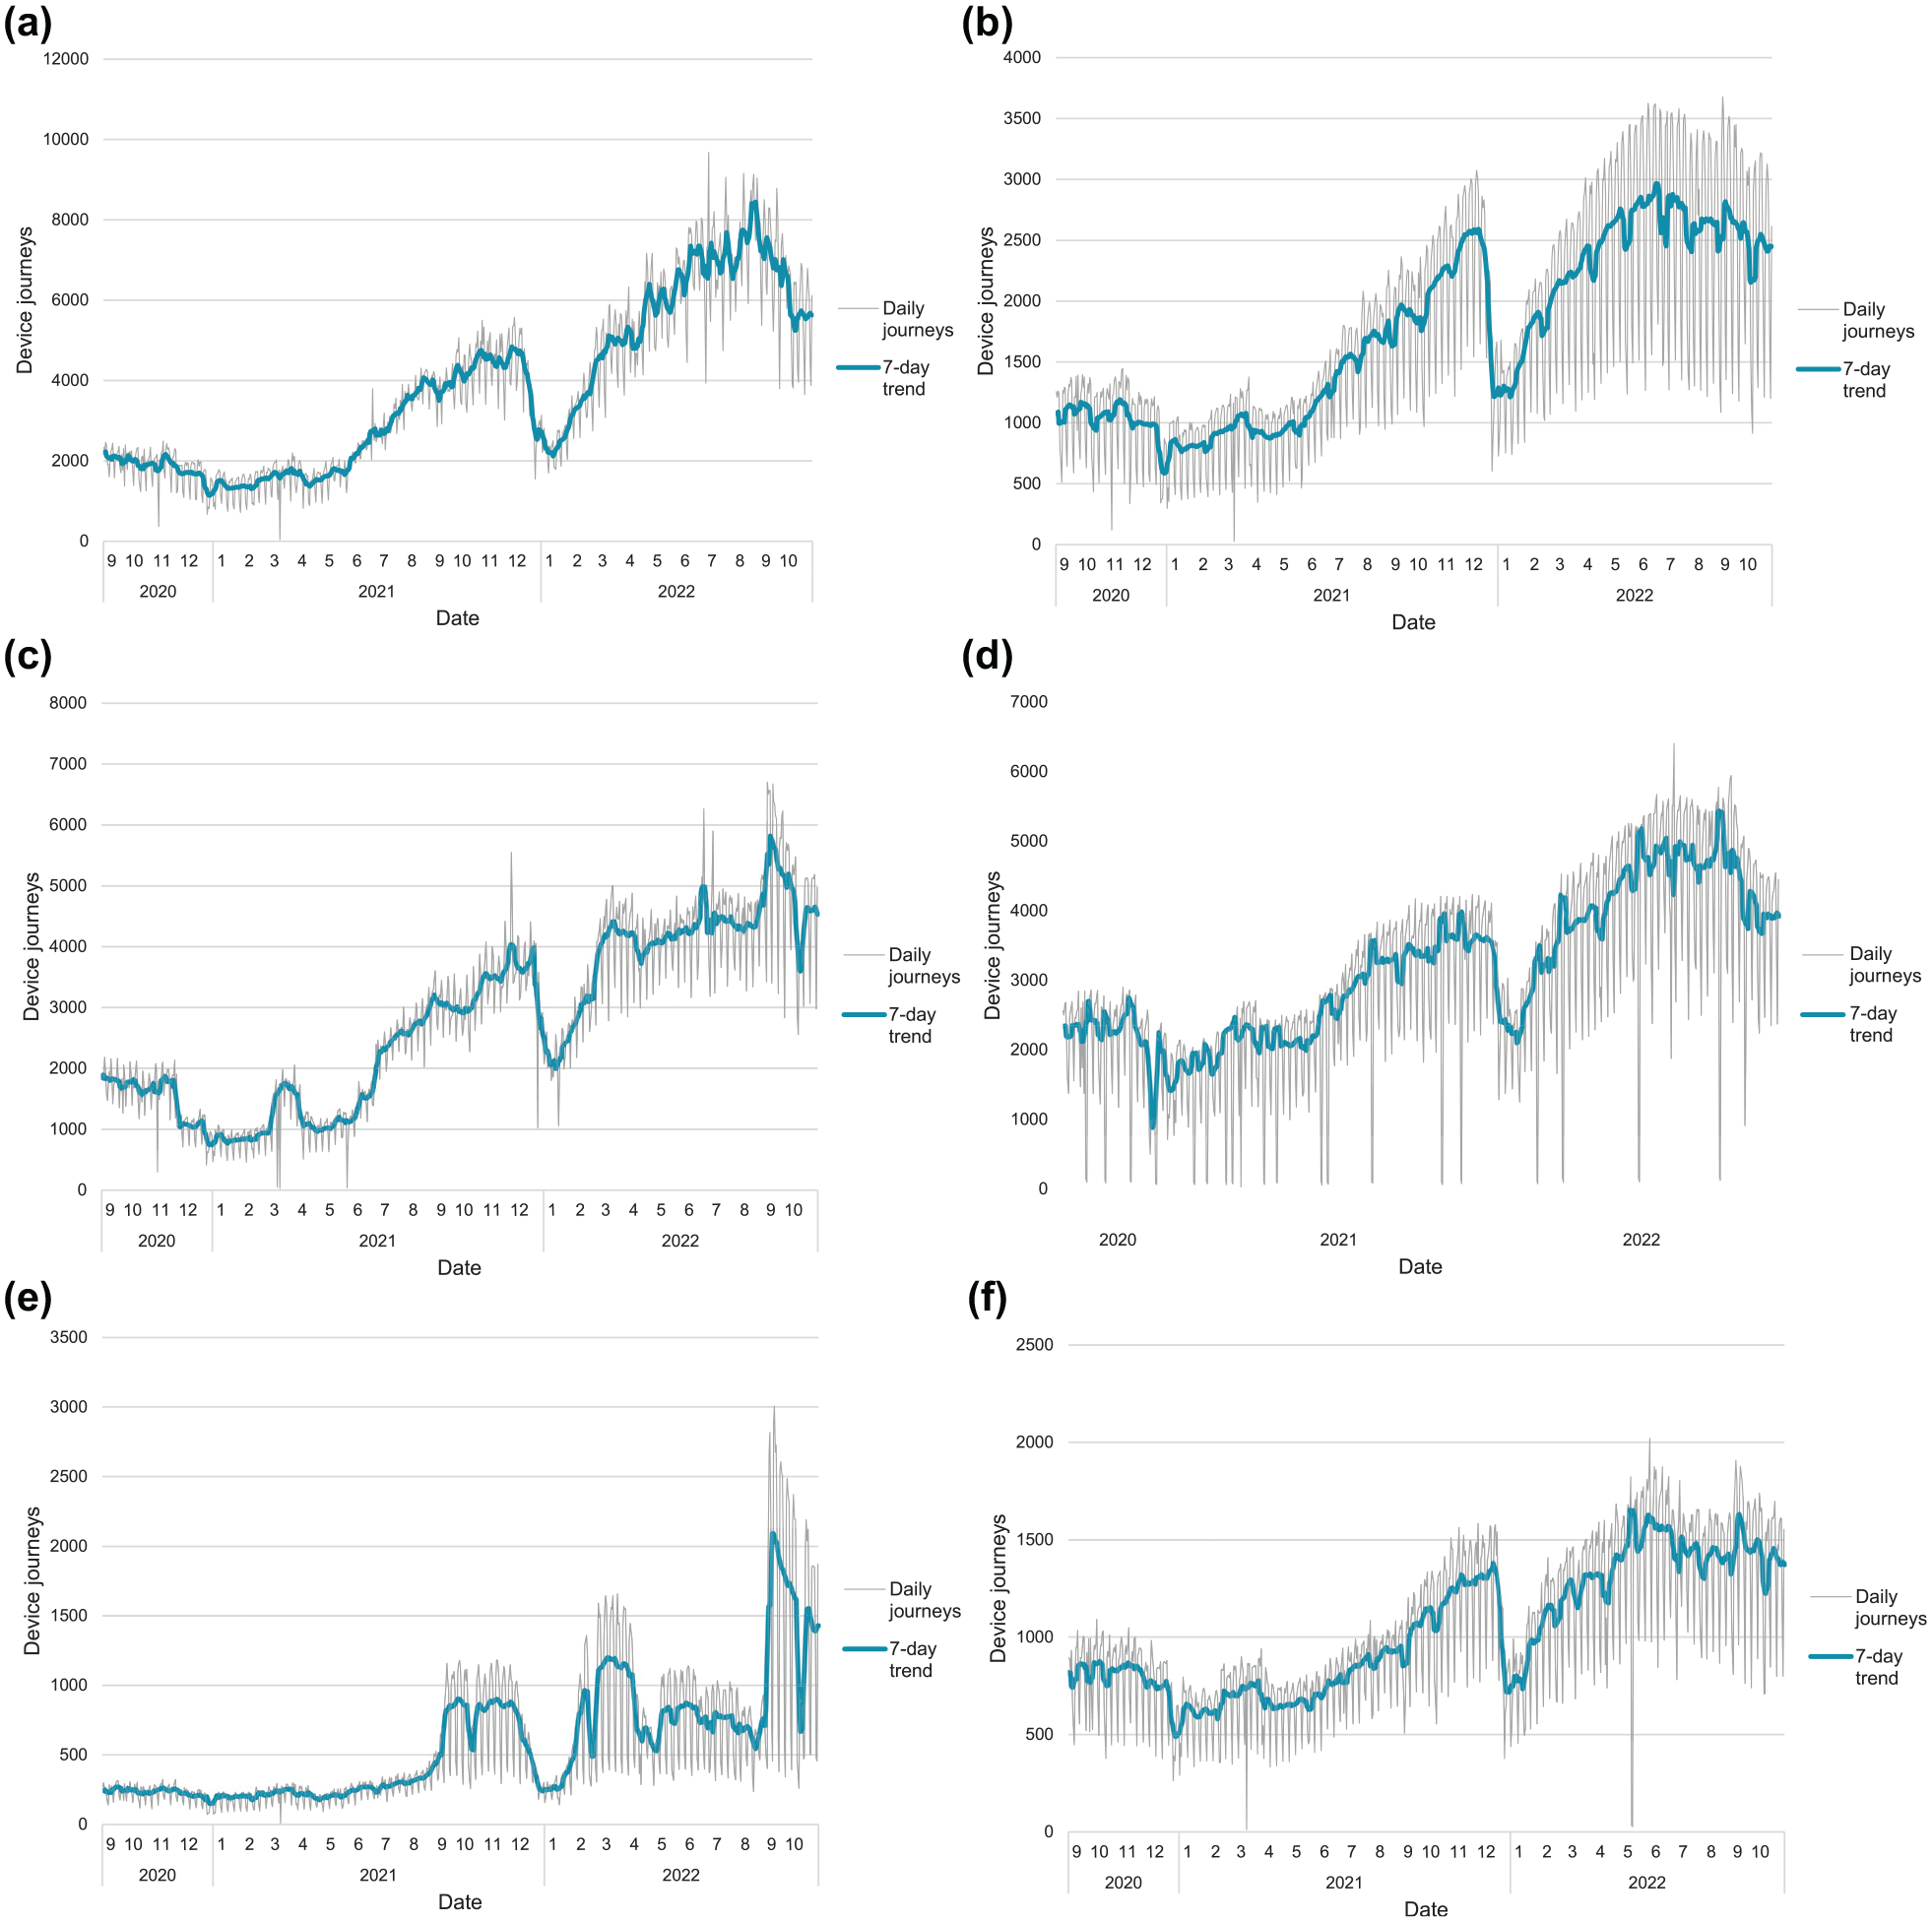
Daily recorded device journeys for selected stations. (a) Union, (b) King, (c) Dundas, (d) Finch, (e) York University, and (f) Coxwell.
Union is one of the busiest stations in the TTC system. It acts as a key transit hub, connecting the subway system to commuter and long-distance trains that service the suburban municipalities surrounding Toronto; it also serves many adjacent office buildings and tourist attractions including the CN Tower and Scotiabank Arena, and is further connected by streetcar to condos, recreational destinations, and the ferry terminal on Toronto’s waterfront. Ridership trends at Union thus reflect a very broad mix of trip purposes; as a result, its recovery trajectory roughly mirrors that of the system as a whole, as shown in Figure 11.
This stands in contrast with King station, located near the center of Toronto’s financial district. Office commuting travel forms the bulk of its ridership, with such trips comprising over 70% of weekday boardings at that station in 2016 according to TTS data, producing a very different recovery profile compared with Union despite the two stations being adjacent. King’s overall recovery has been among the slowest in the network at just 49% in fall 2022, compared with Union’s 68%. King also sees far higher intraweek variation in Wi-Fi journeys, with weekend ridership estimated at less than half of weekday figures.
Similar to Union and unlike King, Dundas station sees a diverse mix of trip purposes as well. However, the major trip generators it serves are Toronto Metropolitan University (TMU, formerly Ryerson) and the Eaton Centre shopping mall; 42% of riders from Dundas are students according to the TTS, and the resumption of in-person lectures at TMU in September 2022 is clearly visible as a sharp increase. Meanwhile, shopping travel is also reflected as provincial health restrictions were imposed or lifted over the course of the pandemic; this can be seen clearly in July 2021, where travel from Dundas increases coincident with the loosening of rules surrounding indoor retail activities ( 49 ).
The remaining stations are located outside of downtown. Finch is the northern terminus of Line 1’s east leg; it is a large hub for bus routes in Toronto’s northern suburbs, and also serves the North York Centre business area. Similar to Union, it serves a broad range of trip purposes, but its lower reliance on office-based commuting meant that Finch retained 33% of its pre-pandemic activity compared with Union’s 18%, rising to 71% by fall 2022. Note the frequent days with close to zero recorded Wi-Fi journeys; these correspond to weekends when subway service was suspended for infrastructure and signaling upgrades.
The next station analyzed is York University, which is relatively unique among TTC stations because of the lack of transit connections or nearby destinations aside from its namesake school. As a result, nearly all passengers boarding or alighting are York University students, staff, and faculty. As most university activities took place virtually during the 2020–2021 academic year, the station saw just 8% of its pre-pandemic usage in fall 2020—the lowest of any TTC station. Ridership began to return in September 2021 with the partial resumption of in-person instruction, with a larger increase to 76% of pre-COVID levels in September 2022. The lack of diverse trip generators means large intraweek ridership variations similar to King station; fall 2022 saw over 2,500 device journeys per weekday compared with about 500 on weekends.
The final station is Coxwell on Line 2, selected to represent a station serving mostly its local neighborhood. Without a dominant nearby trip generator, its ridership recovery for both its overall trend as well as intraweek variations most closely matches the larger TTC network. Compared with system-wide daily Wi-Fi trips, the calculated cosine similarity is 0.995, the highest of the surveyed stations.
Recovery by Time of Day
The different pace of recovery between trip purposes is evident when comparing stations, and the same is true when comparing the times that riders are returning. Figures 18 to 20 show recovery between regions as of fall 2022 for different times of week.
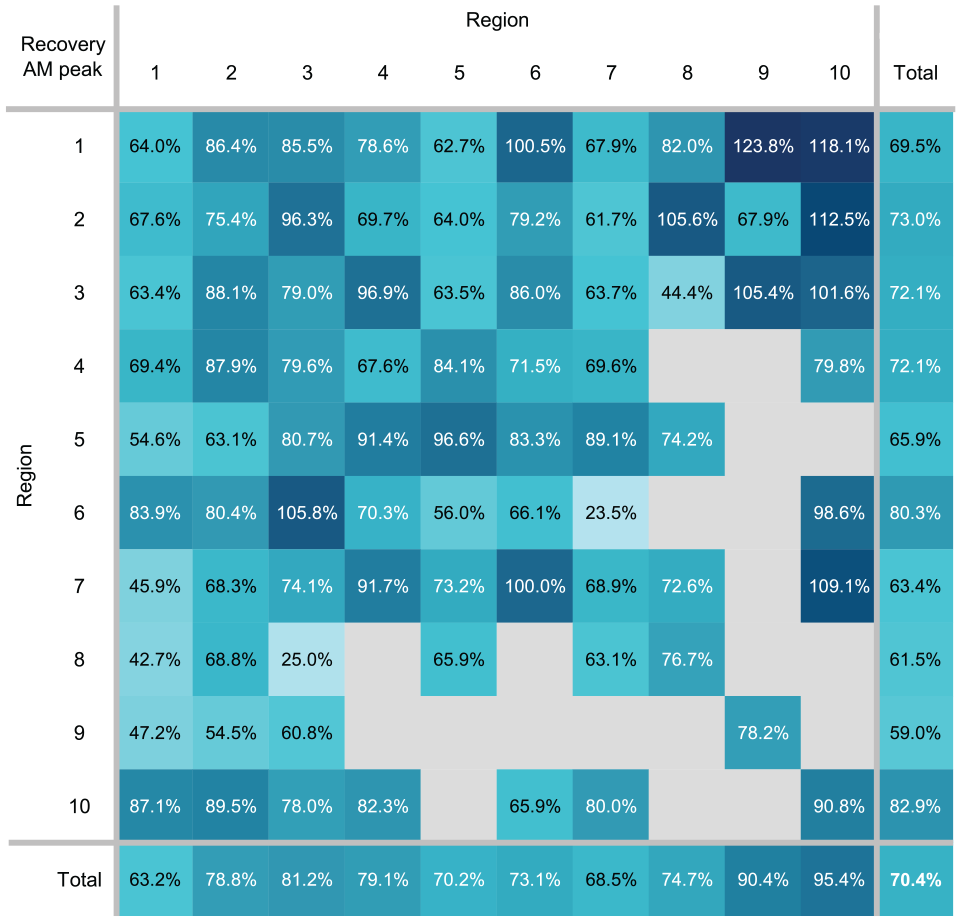
Device journey recovery by origin–destination (O-D) region pair, weekday morning peak period, fall 2022.
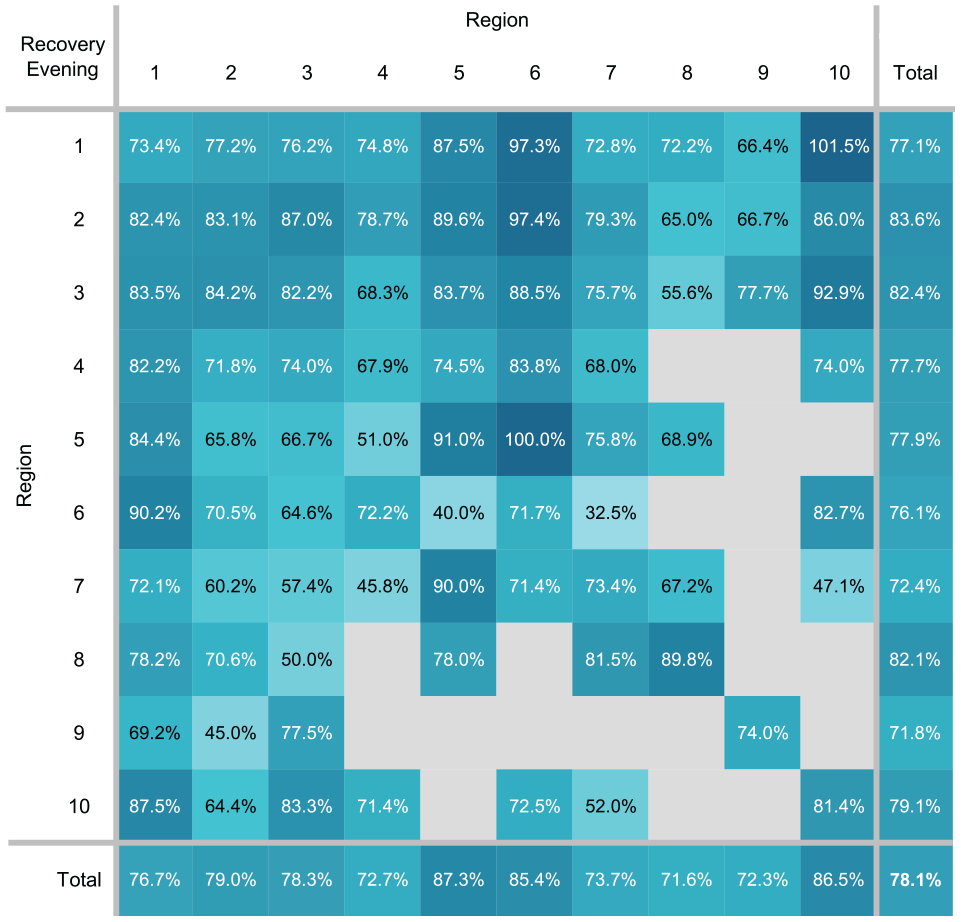
Device journey recovery by origin–destination (O-D) region pair, weekday evening, fall 2022.
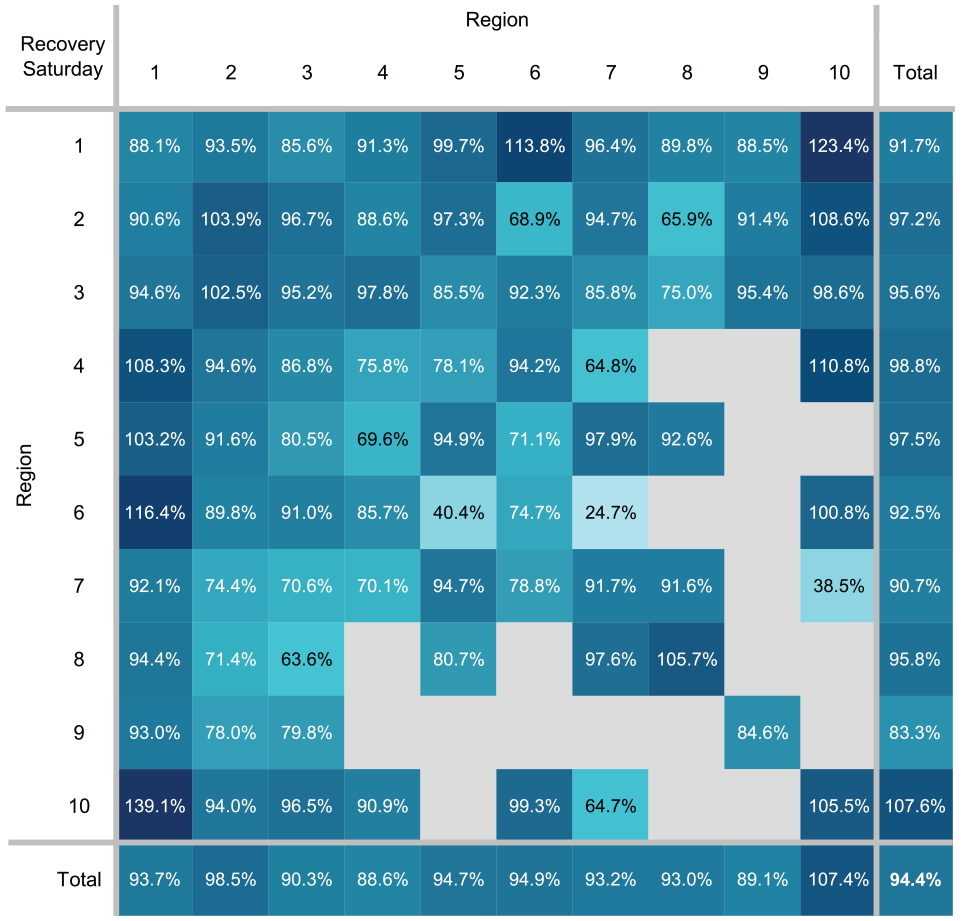
Device journey recovery by origin–destination (O-D) region pair, Saturdays, fall 2022.
During the weekday morning peak, overall recovery stands at 70% whereas downtown continues to lag behind other regions. Region 10 is a particularly popular destination compared with all-day demand, with overall recovery at over 95% of pre-COVID levels (and travel from some origins already exceeding 100%). Ridership recovery during the weekday evening is 78%, with nearly all O-D pairs showing greater recoveries than all-day demand. Weekend subway usage has returned even faster, with journeys reaching 94% of pre-pandemic levels on Saturdays; downtown travel almost matches overall recovery, with travel in certain O-D region pairs surpassing pre-pandemic figures, notably trips made between Regions 1 and 10.
For a more detailed view of demand variations over time, Figure 21 shows system-wide Wi-Fi journey starts over a typical weekday, whereas Figure 22 provides the same for four selected subway stations. System-wide, the morning and afternoon peak periods are clearly visible in fall 2019. Following the beginning of the pandemic, the profile becomes much flatter over the day in fall 2020 with the loss of most peak ridership, which progressively returns in the following years. Nonetheless, the gap between fall 2019 and 2022 remains largest during the peaks.
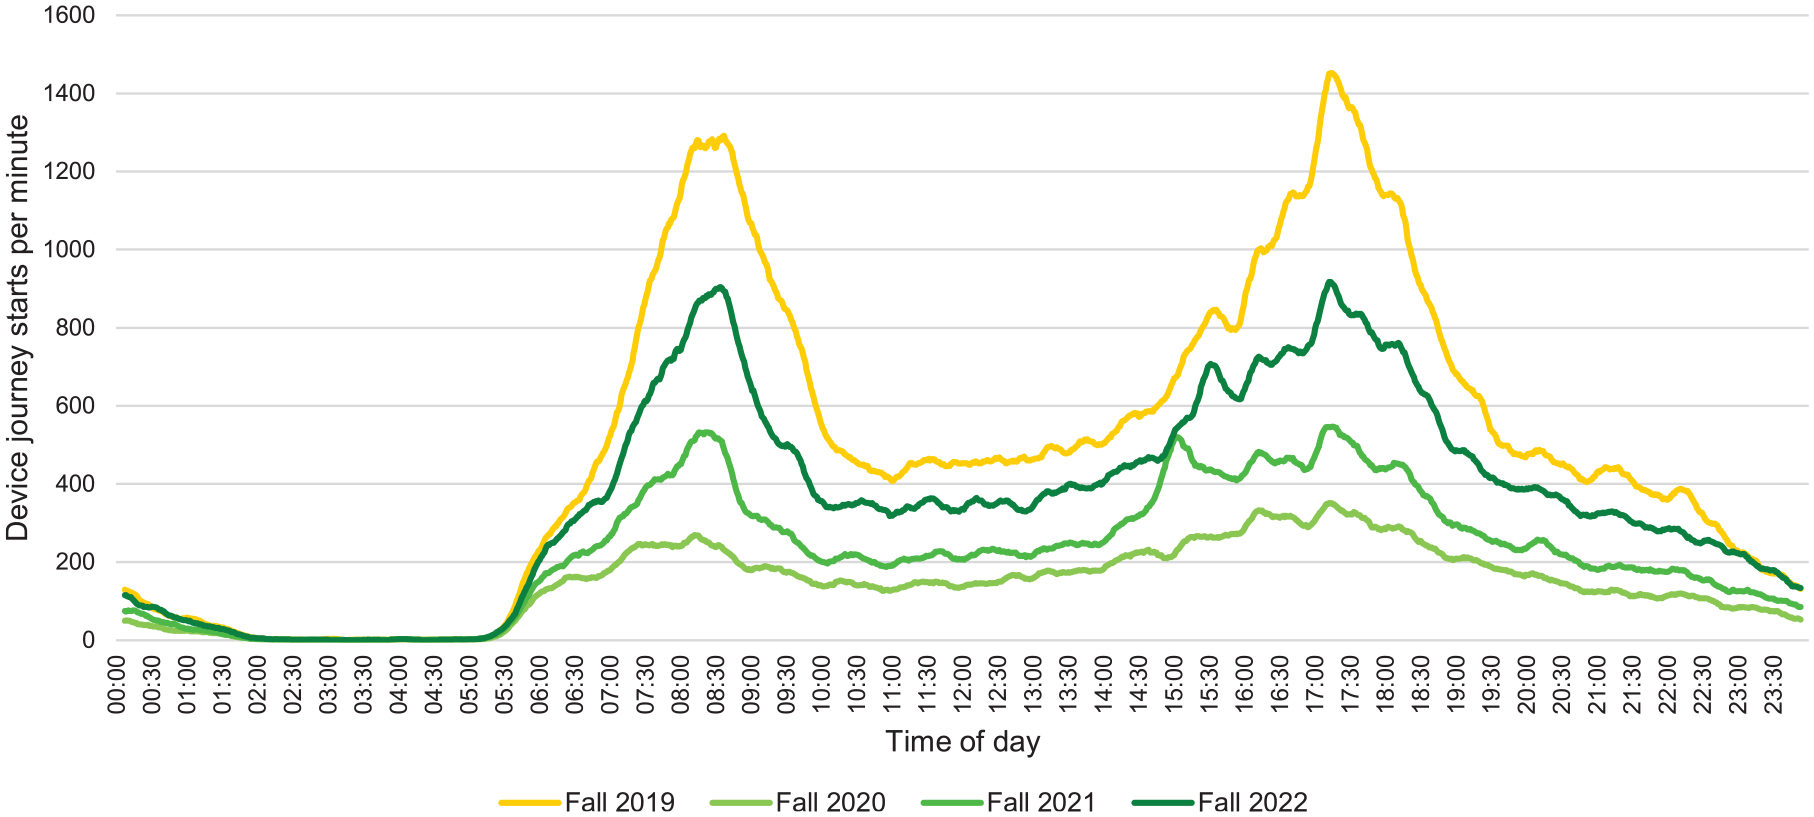
Weekday device journey starts by time of day, system-wide.
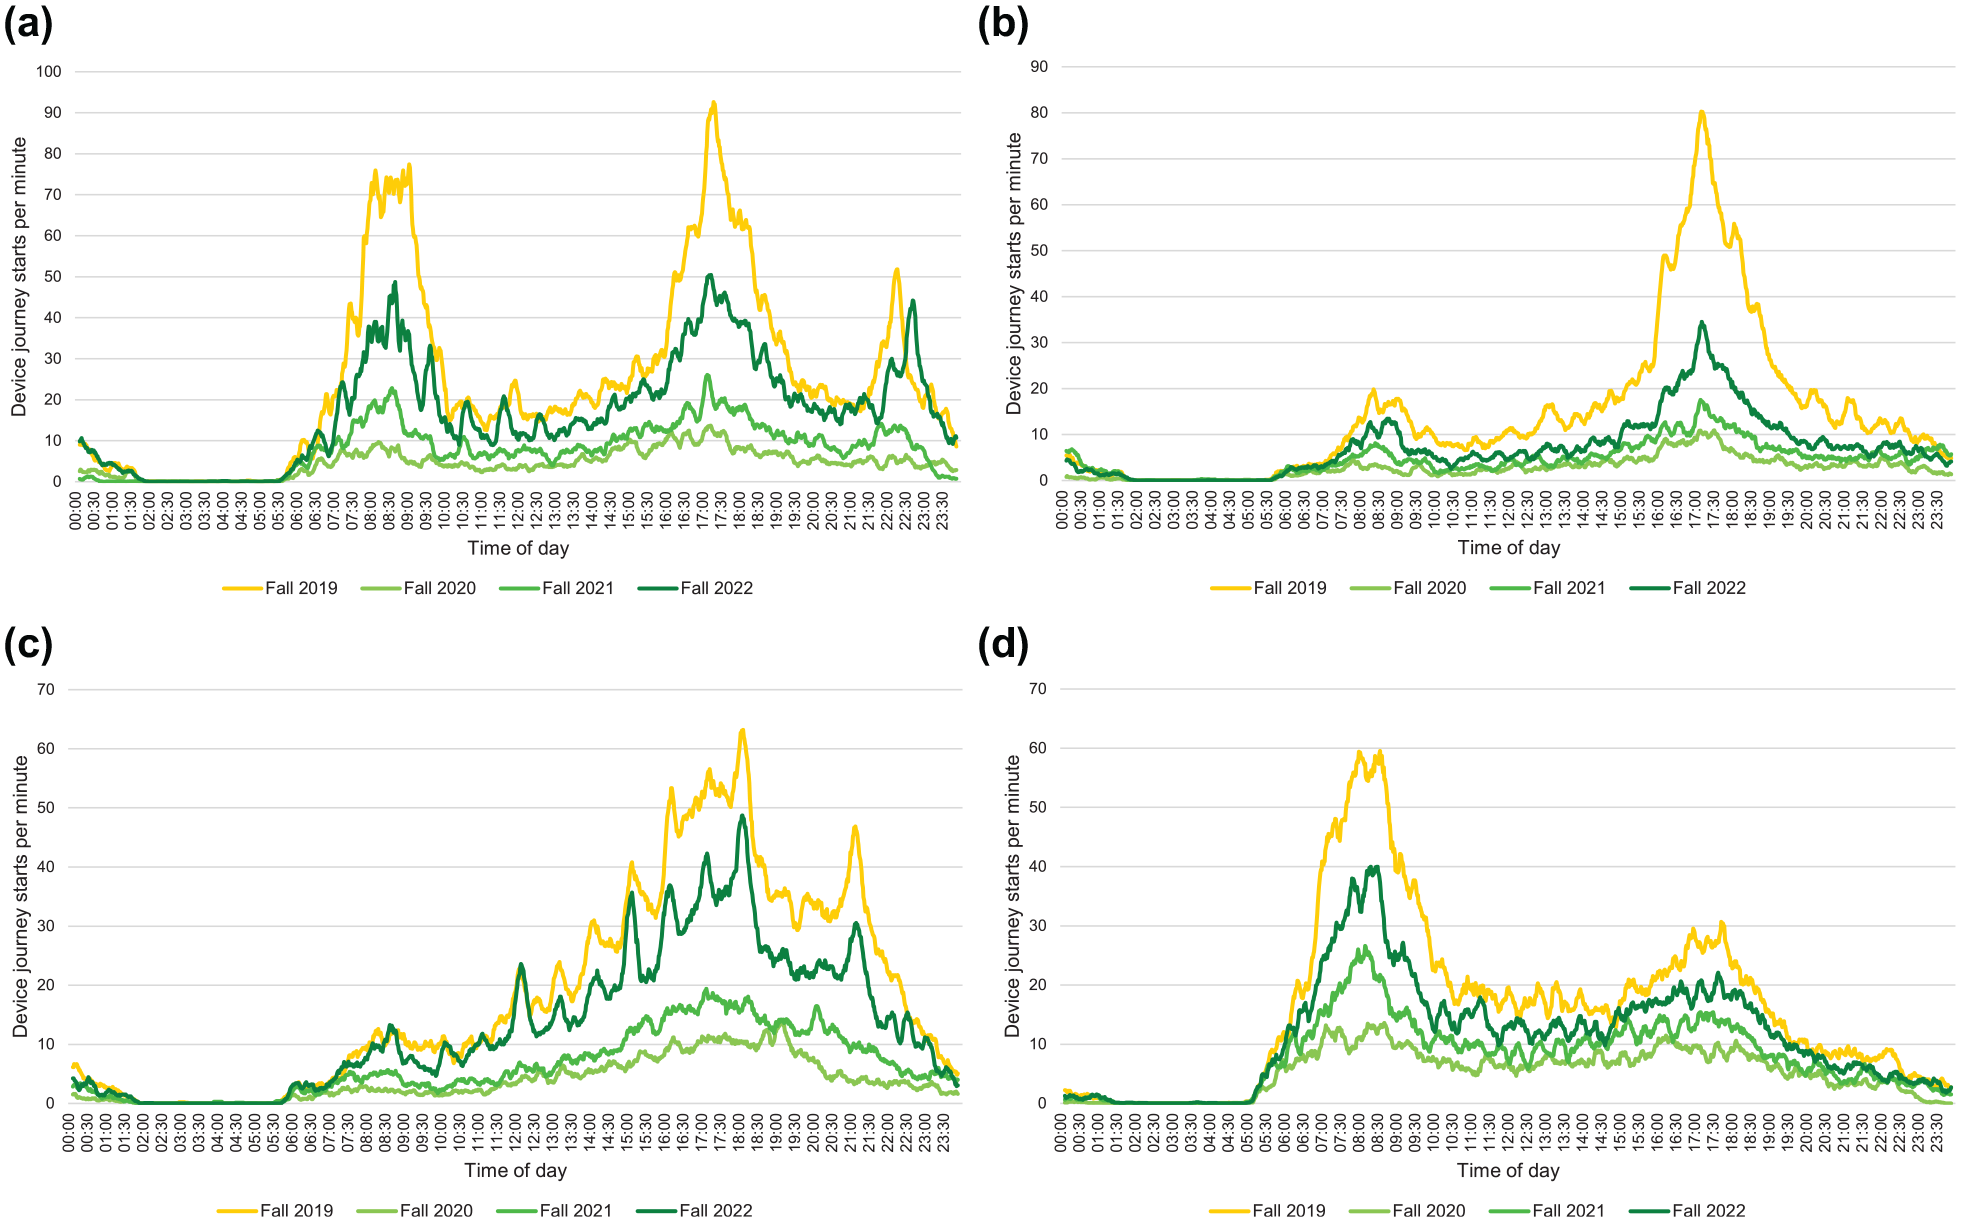
Weekday device journey starts by time of day for selected stations. (a) Union, (b) King, (c) Dundas, and (d) Finch.
Union station’s ridership profile generally reflects this as well, with a morning peak of customers transferring to the subway from commuter trains, and an afternoon peak of employees leaving their offices. Uniquely, Union station also sees a smaller third peak during the late evening between 22:00 and 23:00 in 2019 and 2022, corresponding to the end of concerts and sporting events held at venues near Union. Meanwhile, the dominance of office commuting travel at King is underscored by the magnitude of afternoon peak demand in 2019, with over half of daily Wi-Fi journey starts between 15:00 and 18:59, and much fewer devices observed entering the station at other times. At Dundas, the prevalence of student and discretionary travel results in a much flatter ridership profile without a clearly defined peak; rather, demand builds slowly over the day until roughly 18:00 and declines thereafter. The pattern of class times at TMU is visible in spikes that occur roughly every hour throughout the afternoon; these are not seen in 2020 and 2021 when most classes were online. Finally, Finch station, as a suburban hub, sees its highest activity and lowest recovery during the morning peak. Finch also retained a larger share of its activity during fall 2020 compared with the downtown stations.
Focusing on subway travel at downtown stations in particular, Figure 23 show maps of recovery for different times of day and week in fall 2022. During the afternoon peak, office-oriented stations like King and St. Andrew have the lowest recovery rates of around 40%, as demonstrated previously. Stations with the highest recoveries are generally located in established neighborhoods away from the downtown employment area, such as Bathurst and Spadina. On weekends, a very different pattern is present: overall recovery is much higher and stations such as Union, St. Andrew, and Osgoode now lead; meanwhile, stations along Line 2 also see higher recoveries than on weekdays, but to a less pronounced extent.
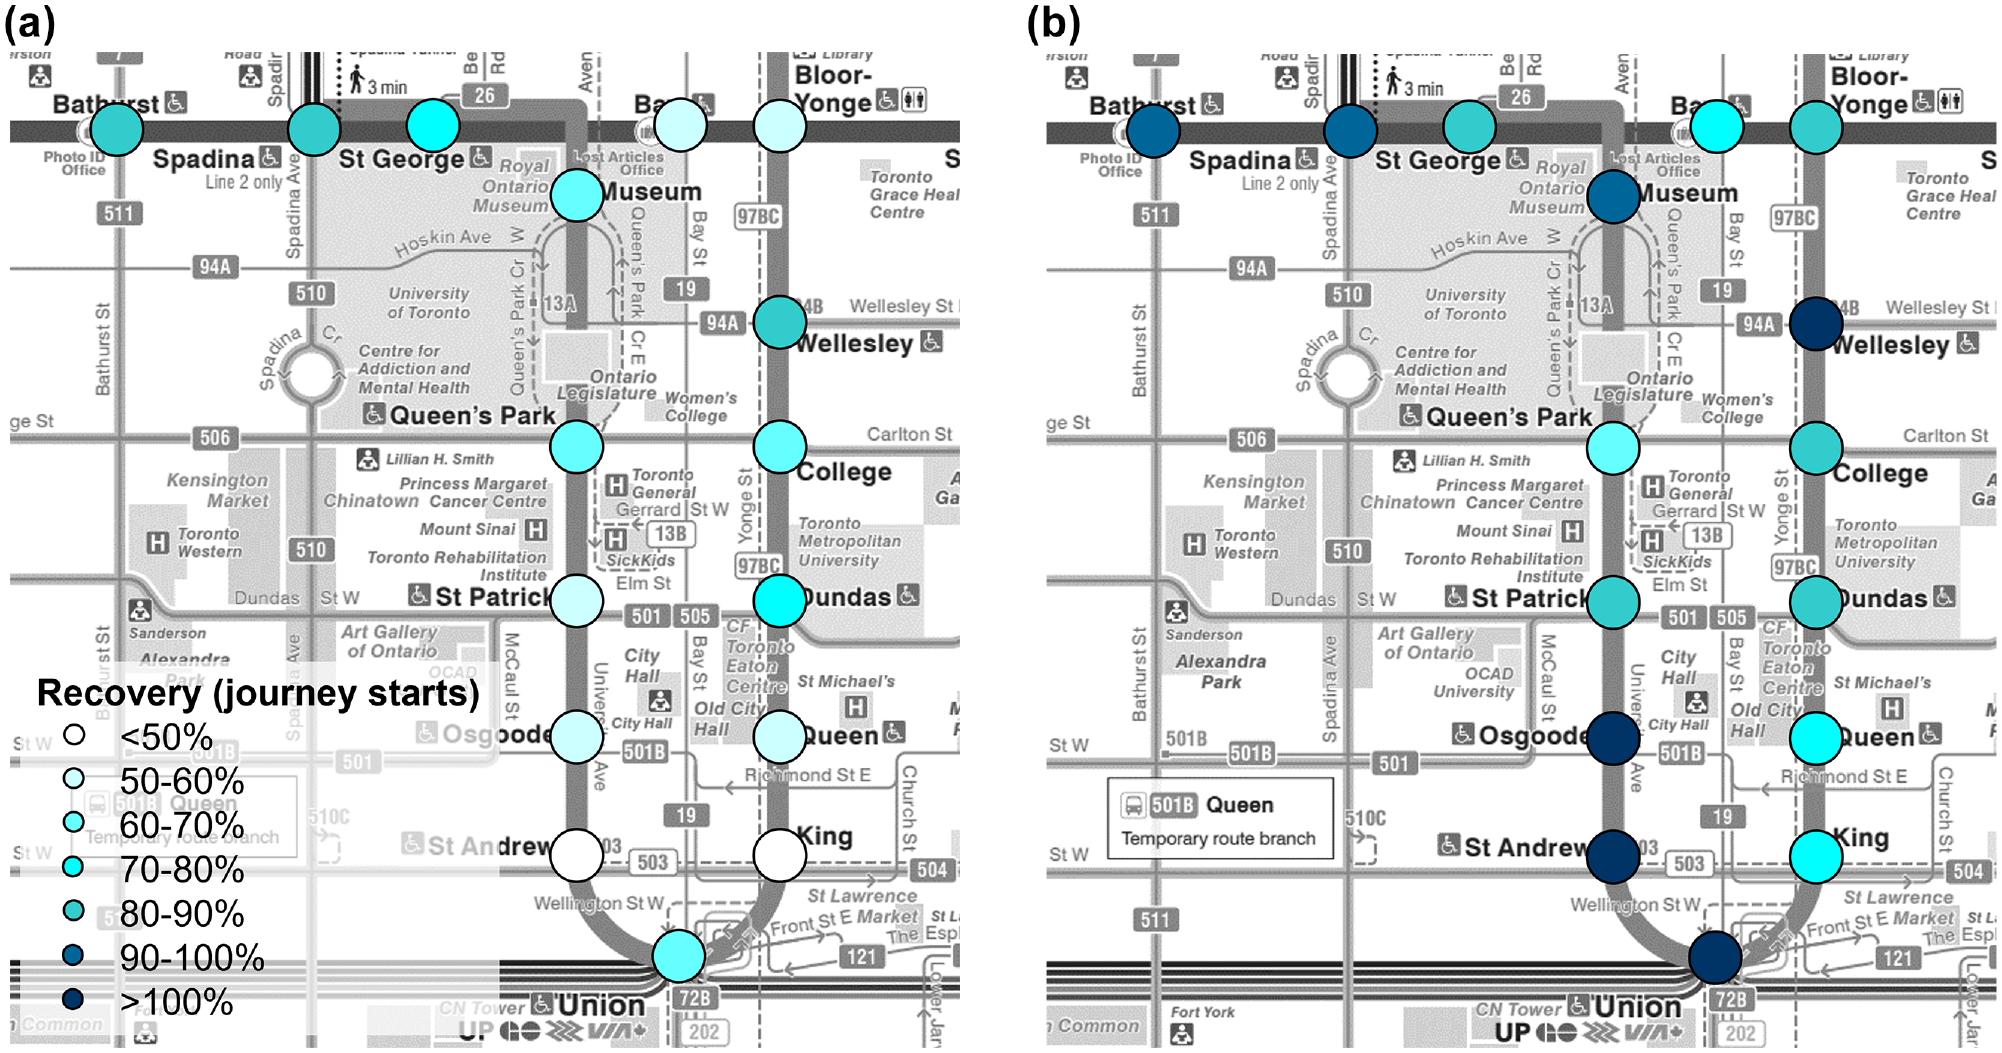
Recovery in device journey starts by downtown station, fall 2022. (a) weekday evening peak and (b) Saturdays.
Drivers of Recovery
Taken together, several main themes are reinforced by the visualizations and statistics presented in the previous section. Nearly universally, parts of the subway network outside downtown retained a larger proportion of their pre-pandemic riders and recovered more quickly after the beginning of COVID-19. Travel during the weekday peak period has been consistently the slowest to recover across the city, with more journeys returning during off-peak periods instead. Subway usage on weekends has nearly fully recovered from the pandemic, with stations serving discretionary travel (e.g., Union) performing especially well. Such results will be discussed further in this section and placed in the context of the larger city.
Socioeconomic Drivers of Recovery
Taking Figure 13, there is a great deal of variation in recovery between stations beyond the downtown/suburb divide. Recovery along the east leg of Line 1 (between Finch and Rosedale), for example, more closely matches downtown stations than other suburban parts of the system. Reviewing 2016 TTS data, these stations had a more affluent ridership base, with 42% of riders having a household income of over $100,000 per year, compared with the system-wide average of 38%. Conversely, at Line 2 stations, only 34% of riders have an annual household income above $100,000, with 24% making less than $40,000 per year (compared with only 19% system-wide). For employment, 60% of customers on Line 1’s east leg hold clerical, professional, managerial, or technical jobs, compared with 56% system-wide and 49% on Line 2. Similarly, only 30% of Line 1 riders are car-free, less than 33% system-wide and 38% of Line 2 riders. All of these findings are consistent with the broader trends that current literature on COVID-19 and transit has identified, with lower-income and low-car households continuing to rely on transit throughout the pandemic while most office employment transitioned to remote work.
Similar results can be observed from individual stations. One of the best-performing stations for ridership recovery is Sherbourne, with 92% of pre-pandemic demand. Nearby stations such as Castle Frank and Wellesley also see higher recoveries than average, with 90% and 81% respectively. All three stations draw many riders from the St. James Town neighborhood, one of the most densely populated neighborhoods in Canada, which data from the 2016 TTS also identify as among the neighborhoods with the lowest income and largest proportion (83%) of car-free households in the city.
Note that in certain instances, raw recovery figures can be deceptive. Runnymede, for example, owes its high recovery (93%) to the major construction at that station in fall 2019, which suppressed ridership ( 50 ), so much of its “recovery” is actually explained by a reversion to normal travel patterns. Eglinton West station has also seen construction work resulting in fewer Wi-Fi access points being in service at that station, artificially depressing the number of observed device journeys. Although broadly reliable, the local context should always be kept in mind when drawing conclusions from such data.
Downtown Recovery and Remote Work
Although mobility patterns across the city have evolved as a result of the COVID-19 pandemic, the critical importance of downtown-oriented travel to the regional transit system has led to special attention given to the pace of its ridership recovery specifically. This section thus concludes with a discussion focused on downtown Toronto.
As shown in Figure 23, downtown Toronto’s recovery has been quite heterogeneous. Certain stations see more traffic on weekends than they did before COVID-19, most notably those serving recreational or entertainment destinations: Osgoode and St. Andrew are located next to the theaters, restaurants, and nightlife of Toronto’s entertainment district, whereas Union provides access to sporting and concert venues. Coupled with the overall rapid system-wide recovery in weekend and evening subway travel, such discretionary travel now forms a much larger proportion of trips to and from downtown Toronto than before COVID-19.
Conversely, stations serving primarily office commuting travel continue to see well under half of pre-COVID demand, as many office jobs continue to operate in remote or hybrid modalities. Research from the Strategic Regional Research Alliance (SRRA) estimated office occupancy in downtown Toronto stood at 35% in October 2022 ( 51 ); if treated as a proxy for downtown-bound commuting travel, it is clear from Figure 24 that despite a positive trend, this market continues to lag far behind travel elsewhere in the city. The latest SRRA data suggest that office occupancy levels just exceed 50% of pre-pandemic levels as of June 2023, with growth slowing. TTC ridership data also show that ridership recovery has plateaued since fall 2022 at over 60% ( 4 ), perhaps lending credence to Magassy et al.’s ( 27 ) estimate that transit ridership would stabilize near 70% of pre-pandemic levels.
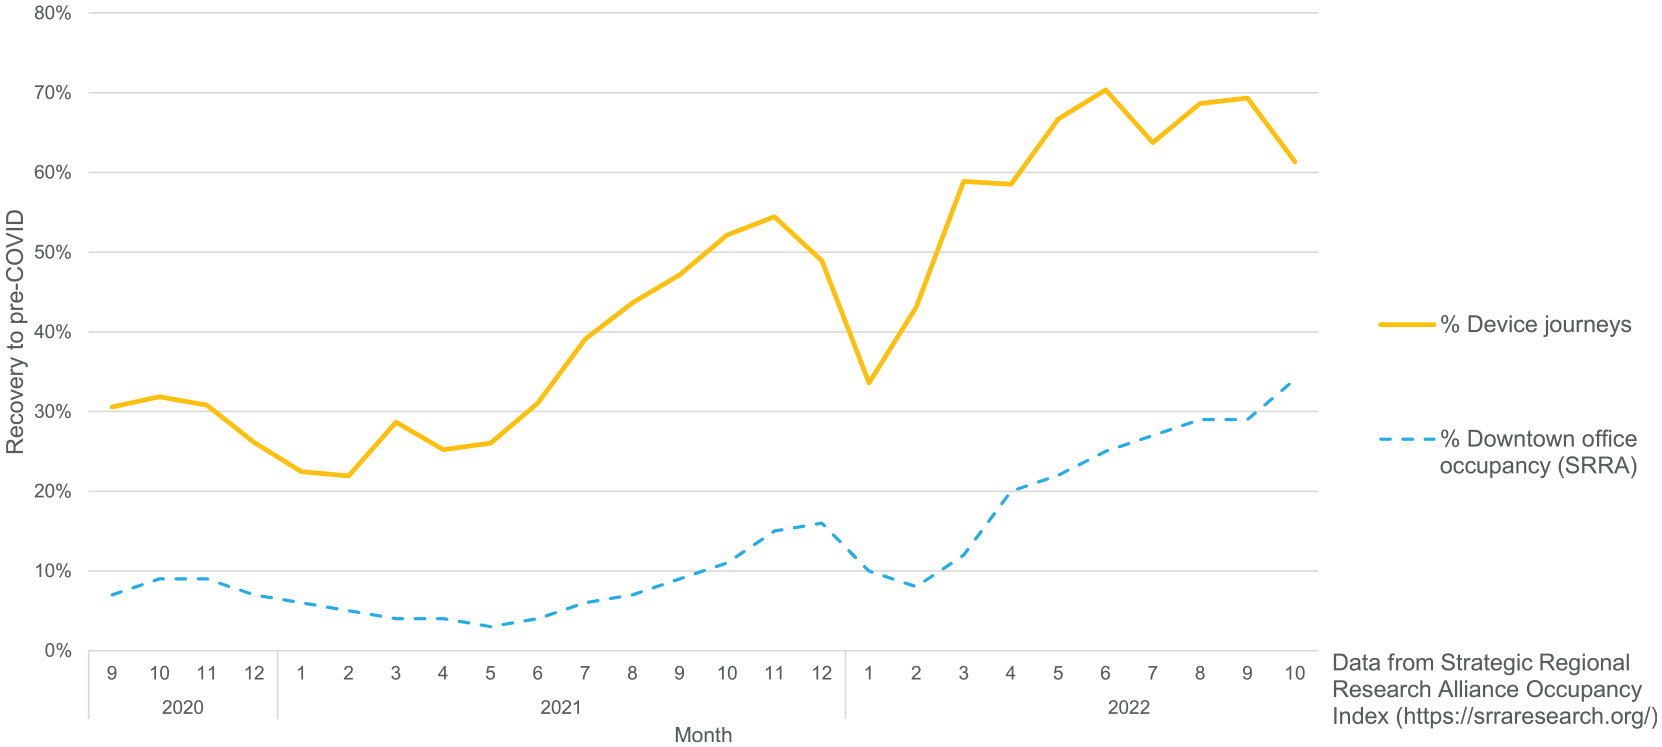
Monthly recovery in Wi-Fi device journeys versus downtown office occupancy.
As employers initiate return-to-office policies, the number of in-office days per week has been hotly debated. By correlating devices between trips, Figure 25 shows how the number of weekdays on which each device traveled to the downtown office core has evolved over the pandemic. In 2019, this figure stood at about 3 days per week (note that this figure includes regular visitors who do not necessarily work in the financial district 5 days per week), which has fallen to between 2 and 2.5 days per week from 2020. Additionally, not only is this figure not increasing, it has actually slightly decreased as the pandemic has progressed, despite substantial ridership recovery since 2020. This points to the recovery being driven by an increasing base of returning riders, but who individually continue to use transit less frequently than they did before COVID-19.
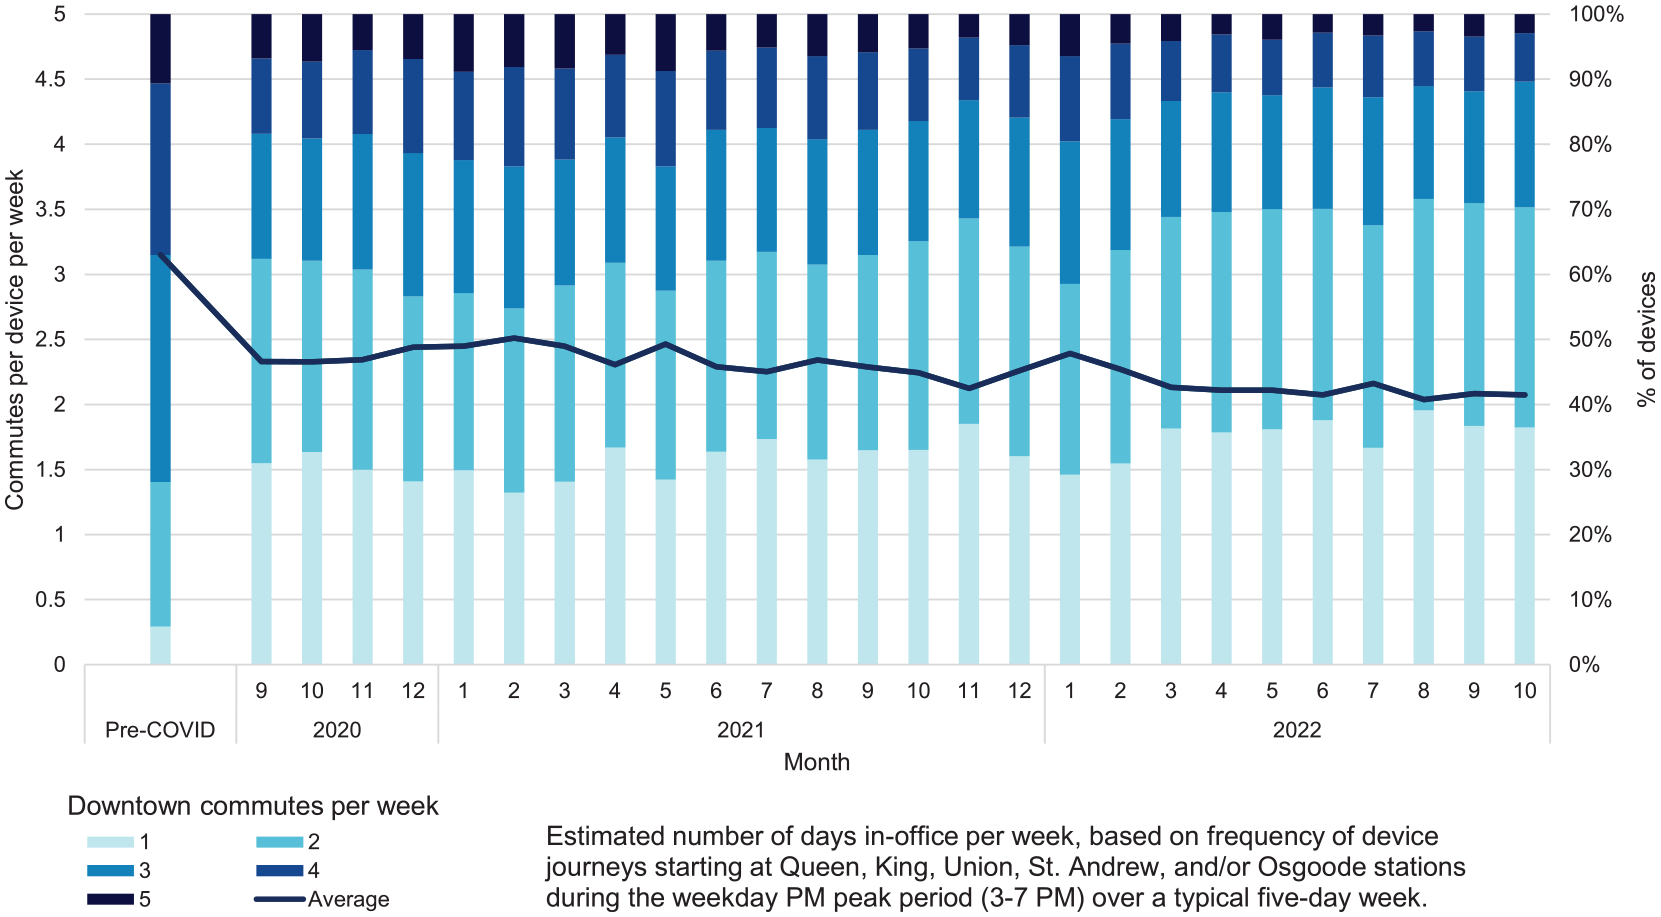
Number of days on the subway for peak period downtown core stations.
Conclusion
Summary
Public transit travel patterns have been affected by the COVID-19 pandemic in numerous ways, and understanding the trajectory of ridership recovery is critical for transit agencies to position themselves for post-pandemic success. On the Toronto subway since 2020, ridership recovery has been stronger in the suburban parts of the city as well as off-peak travel periods. Travel on weekends to discretionary destinations has bounced back particularly quickly, with fall 2022 demand exceeding pre-pandemic levels for certain travel markets, whereas downtown office commuting has been slowest to return. In addition, as demonstrated from the analysis presented, aggregated device journeys from Wi-Fi records have the potential to be a useful data source for agencies, with their ability to produce detailed O-D and routing information for each trip being the primary benefit they provide. Although further verification is merited as part of future work, Wi-Fi records have been shown overall to be a reasonably good proxy for system ridership, providing confidence in their reliability and enabling meaningful discussions and conclusions based on the matrixes and charts that have been presented. Wi-Fi can thus be an important data source to aid transit operators in understanding how demand is evolving for specific times, locations, and O-D flows, and be agile in adjusting their services accordingly. Taken together, these findings suggest that agencies should focus on supporting off-peak, non-downtown-oriented travel, and also explore Wi-Fi as a data source for ridership analysis where feasible, on its own or in conjuction with other data streams.
Limitations and Next Steps
There are many caveats associated with the findings presented in this study. Although Wi-Fi journeys and official ridership figures correlate very well with each other, there is room for further work to check that Wi-Fi data capture a truly representative sample of riders. This study did not look for sampling bias by O-D pairs, time of day, or rider demographics, which are important characteristics of transit ridership for which a corresponding “ground truth” data source is not available. Verifying this is necessary to conclude that device journeys are a reliable proxy for ridership. Another challenge is that certain Wi-Fi journeys start or end at an access point on a station platform, leaving ambiguity as to whether the device actually entered or exited the system at that station, or merely passed through on a train without connecting to an access point at its true origin or destination; Da Silva et al. ( 46 ) discussed this issue in detail and proposed a mitigation.
A further risk of relying on Wi-Fi has been the growing rollout of cell phone services in underground rail systems. Riders using their own data plans can thus bypass public Wi-Fi networks entirely, with the result of depressing capture rates and potentially biasing the subset of riders captured by Wi-Fi. The scope of usable Wi-Fi data is also affected by changing privacy policies and regulations, which might restrict the features available for analysis. These considerations are dependent on the Wi-Fi infrastructure setup as well as social and regulatory attitudes toward user data privacy, which differ between transit systems. There are potential opportunities for data fusion to leverage the respective advantages of emerging disaggregated data sources and traditional AFC/APC data, presenting interesting new directions for future work into transit analytics.
As previously noted, the focus for this research emphasized the immediate recovery from COVID, with the Wi-Fi data available ending in late 2022. Nonetheless, as transit ridership has continued to recover and evolve further since that time, a key objective of future investigation is to expand the analysis period to cover more recent data, permitting continued monitoring. Further comparisons of riding habits between different stages of ridership recovery and identification of emerging trends would be useful for short-term transit operations and longer-term strategic planning. Such research would also place assessments of predictions about transit recovery from the early stages of COVID-19 in the context of actual post-pandemic data, retrospectively identifying how their assumptions did or did not hold up.
Such caveats notwithstanding, Wi-Fi remains a promising tool for transit agencies to collect detailed data on travel patterns in general as well as track the post-COVID recovery specifically. Operators with access to such data are encouraged to leverage their own Wi-Fi networks and investigate how they can supplement other data streams, such as APC or fare card data. Following the exploratory work discussed in this study, the next proposed phase of research will shift toward building models for ridership recovery based on the Wi-Fi data. These will be augmented with supplementary data sources, potentially including office occupancy and retail activity indices as well as travel survey responses, to place transit’s recovery in context with the drivers of ridership. An initial review of the literature finds specifications such as Bayesian structural time series, as applied by Osorio et al. ( 13 ), to be potentially promising, in addition to more traditional time series models such as SARIMA and its extensions. Further work would be to adapt these models to ridership forecasting, allowing transit agencies with Wi-Fi capabilities to leverage their data more intelligently.
Footnotes
Acknowledgements
The authors thank BAI Communications Canada for providing access to Wi-Fi data from the TTC subway and for providing technical support for this research.
Author Contributions
The authors confirm contribution to the paper as follows. study conception and design: RC, AS, DDS; data collection: RC; analysis and interpretation of results: RC, AS, DDS; draft manuscript: RC. All authors reviewed the results and approved the final version of the manuscript.
Declaration of Conflicting Interests
The author(s) declared no potential conflicts of interest with respect to the research, authorship, and/or publication of this article.
Funding
The author(s) disclosed receipt of the following financial support for the research, authorship, and/or publication of this article: The research in this paper has been supported by the National Sciences and Engineering Research Council of Canada (NSERC) through the Canada Graduate Scholarship—Master’s and Discovery Grant programs.