
Abstract
An integrated Eulerian–Lagrangian method has been proposed to simulate liquid jet in supersonic flow. The carrier fluid surrounding the liquid droplets is described by multicomponent Navier–Stokes equations based on stationary (Eulerian) Cartesian grid, and the Lagrangian-discrete droplet method is employed to represent the behavior of atomized droplets in this work. A total of three classic breakup models, Taylor analogy breakup model, Reitz wave model, and Kelvin–Helmholtz/Rayleigh–Taylor hybrid model, are discussed under supersonic conditions, and model predictions are compared to experimental data through multiple perspectives quantitatively. More accurate predictions of liquid penetration, as well as droplet size distribution, can be achieved for specific conditions with Kelvin–Helmholtz/Rayleigh–Taylor hybrid model comparing to other breakup models. Additionally, a statistical injection model has been introduced to depict droplet dispersion in the near-nozzle region. The probability density function is utilized to predict the size and position of the injected droplet, and the four commonly used probability density functions, uniform, chi-squared, Nukiyama–Tanasawa, and Rosin–Rammler, are analyzed. The influence of statistical representation of injection condition is discussed. The simulation results indicate that the random components in the velocity and droplet size of the injected droplets have a significant impact on the structure of the liquid jet in high-speed flow.
Keywords
Introduction
A liquid jet flow injected into high-speed gaseous crossflows is one of the most widely used techniques for fuel–air atomization enhancement and mixing augmentation in propulsion systems such as the internal combustion engine, the liquid rocket engine, and the scramjet. 1 The understanding of procedures of fuel spray is a great challenge in liquid injection for practical applications. The procedure of these propulsion systems involves a number of complex, closely coupled physical and chemical processes, which include transient three-dimensional liquid atomization mixing with multicomponent gases and fuel combustion. The residence time of liquid fuel is millisecond ordered between the engine capture and exit through the nozzle in air-breathing vehicles, and therefore, the liquid breakup and fuel mixing fleeting become a key issue in high-speed crossflow. 2 Thus, an accurate prediction of liquid fuel spray process is necessary for better producing reliable engine performances.
Several studies on atomization of liquid jet have been presented in the literatures.3–11 Experimental investigations of nonturbulent round liquid jets injected into gaseous crossflows conducted by Mazallon et al. 12 show that liquid surface deformation and breakup properties were not strongly affected by the jet-to-air momentum flux ratio at relatively large liquid/gas density ratios. Lin and his research group considered both pure-liquid and aerated-liquid jets in supersonic crossflows, and their experimental studies focused on information about velocity, liquid volume flux, and drop size distributions after breakup.13–15 Early numerical studies of various liquid spray breakup models used to simulate liquid atomization were reviewed by Bravo and Kweon. 16 Madabhushi 17 developed a breakup model to simulate spray structures of water jets injected into subsonic crossflows, accounting for the effect of jet bending, aerodynamic forces, droplet distortion, and dispersion. Im et al. 18 performed a Reynolds-averaged Navier–Stokes (RANS) study of a Lagrangian-based supersonic crossflow and proposed a modified breakup model to simulate the catastrophic regime in a supersonic flow based on an existing Kelvin–Helmholtz/Rayleigh–Taylor (K-H/R-T) hybrid model. Detailed numerical studies of turbulent liquid jets injected into a subsonic gaseous crossflow were conducted by Herrmann, 19 indicating the breakup of the liquid jet via two main simultaneous atomization mechanisms. Further to density ratio, he found that the resulting drop sizes were a function of the chosen density ratio. Xiao et al.1,20 investigated the primary breakup mechanism of liquid jet in an air crossflow using a two-phase flow large eddy simulation (LES) and found that Rayleigh–Taylor instability plays an important role in the primary breakup of liquid jet in a supersonic crossflow, which is consistent with the atomization mechanism for a liquid jet in a subsonic incompressible crossflow. As reviewed by Huang 21 and Huang and Yan, 22 several aspects, including the jet-to-crossflow pressure ratio, the geometric configuration of the injection port, the number of injection ports, and the injection angle, could affect the transverse injection flow field structure.
In this work, a marker-based Eulerian–Lagrangian method for solving the atomization of a water jet in supersonic crossflow is outlined. The carrier fluid surrounding the liquid droplets is described by the multicomponent Navier–Stokes equations, and the behavior of the atomized droplets is tracked by Lagrangian markers. Effects of pressure gradient caused by shock wave and turbulence on the spray droplets are considered in the proposed method. Statistical descriptions of initial droplets, through the joint of probability density function (PDF) of the droplet velocity and diameter, are introduced to make the liquid jets closer to real situations. The statistical descriptions of injection conditions, which emphasize the effect of droplet sizes, velocities, and locations, are the unique feature of this approach. A total of three types of classical breakup models, namely, Taylor analogy breakup (TAB) model, 23 Reitz wave model, 24 and K-H/R-T hybrid model, 25 are compared with experimental data available from Lin et al. 14 for modeling validation as well as a case without breakup model to prove the necessity of using breakup models. A total of four types of PDFs, which are uniform, chi-squared, Nukiyama–Tanasawa, and Rosin–Rammler, respectively, are analyzed, and the influence on calculation results with different statistical representation of injection conditions is discussed. Numerical results are compared with those of experimental investigations by spray penetration height and droplet size distribution. The most reasonable injection model in this article is found out by comparing the numerical results.
Methodology
Gas-phase models
The effect of mass exchange and energy transportation between vapor and gas phase at the overall process of evaporation is significant. Thus, the calculation of the heat through latent heat contribution and the partial enthalpy of each component is based on real-gas mixture assumption, which is performed with multicomponent three-dimensional Navier–Stokes equations. The vector forms of the governing equations are given by 9

where the


with


where et denotes the total energy per unit mass, hi is the enthalpy of species i, Yi denotes the mass fraction, Dim is the effective binary diffusivity of species i,

where Ru is the universal gas constant and Wi is the molecular weight of species i.
In general, to determine an equilibrium temperature T of a gas mixture, Nsp+ 1 variables are needed where the explicit form of temperature cannot be found because the gas is in thermodynamical equilibrium, and all species possess the same temperature; thus, the temperature has to be calculated iteratively 27 where the Newton-iterative method is invoked.
Substituting equation (11) into equation (9)


where the superscripts n and n+ 1 denote the previous time level and new time level, respectively.
The mass, momentum, and energy coupling between phases are implemented as a source term

The production rate of species i due to evaporating spray

The momentum source terms Fx, Fy, and Fz are given by

The work done by droplets to the gas phase

where
Spray models
The Lagrangian-discrete droplet method is employed to represent the behavior of atomized droplets. This class of method tracks the spray droplets through Lagrangian markers moving on an Eulerian computational grid using a simple advection equation 16

where subscript d denotes the computational parcel, which represents a number of droplets with the same size, position, temperature, and velocity.
The force acting on the droplet includes aerodynamic drag and gravitational force in general. While in high-speed flows, the pressure is rapidly increased within the shock front when considering a droplet pass through a shock wave, and the velocity of the droplet is accelerated due to the nonnegligible pressure gradients. 27 Therefore, the droplet acceleration is given by

where
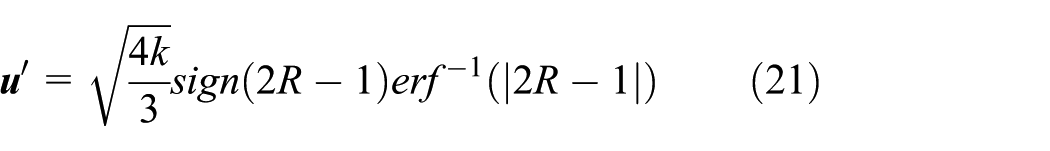
where R is a random number ranged from 0 to 1, which satisfies a normal distribution, and k is the specific turbulent kinetic energy of the gas in the computational cell calculated using shear stress transport (SST)


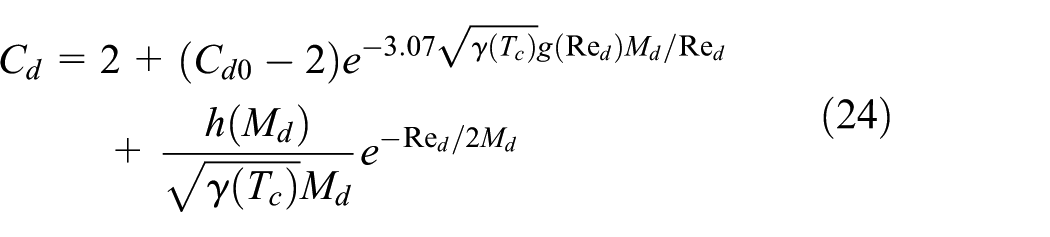
For better describing the drag acting on the droplets in the supersonic regime, the high Mach number drag law is used which is similar to the spherical law with compressibility correction.30,31 The Cd in equation (20) is the drag coefficient that can be expressed as
where

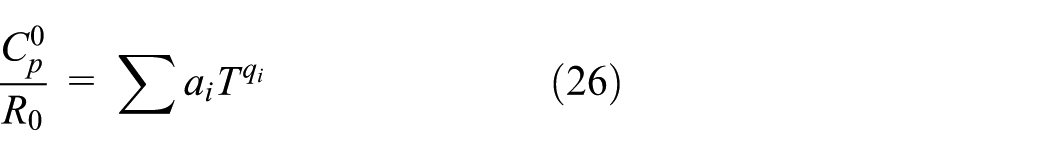
For each species, the specific heat as a function of temperature is given in the form of least squares coefficients. The general form of this equation is as follows 27
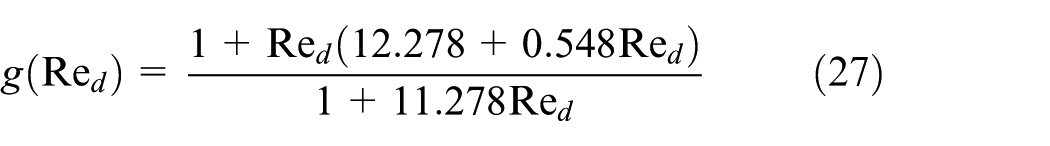
In equation (24), g(Re d ) and h(Md) are the two functions
and
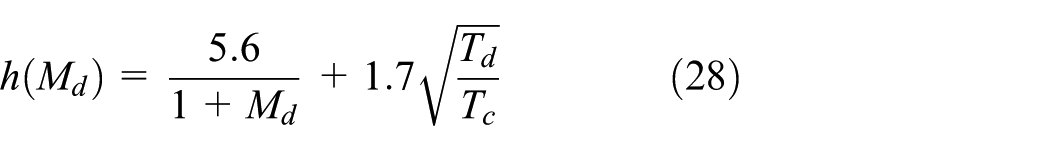
where Td is the droplet temperature and Tc is the temperature of the gas. Cd0 is the drag coefficient for a Mach number approach to zero, namely, the spherical drag law is given by
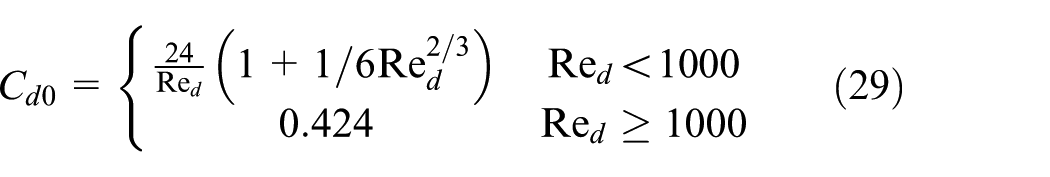
and the liquid Reynolds number Re d in equation (29) is given by

Injection model
An essential component of the theoretical model is the manner in which the effect of the initial droplet size distribution and the injection position on droplet dispersion is represented. In previous studies, an average droplet size and distribution have been used to simulate injected droplets.1,17,18 However, strong turbulence structures will develop inside the injector at high-speed flow condition, the average droplet size and distribution are no longer reasonable. 32 Furthermore, the droplet sizes of injected parcels are strongly dependent on atomizer configurations. The spray of the liquid jet is significantly influenced by droplet size and distribution. To accurately depict the physical characteristic of injected droplets, a statistical injection model has been created to predict the velocity, size, and position of droplets in the section of injector. 29 The spray injector is set as a point in space with specified droplet mass flow rate, droplet distributions, sizes, velocities, temperatures, and breakup parameters.
The diameter of droplets in the parcel is randomly chosen from a specific probability density distribution
The investigation of the influence on droplet size of atomizer design indicates that the radius of the droplet with different atomizers can usually be characterized by the PDF. 33 In this work, four types of commonly used PDFs f(x) are available: uniform, chi-squared, Nukiyama–Tanasawa, and Rosin–Rammler.
The position vector (x, y, z) is given by

where d and
The droplet injection velocity is randomly chosen from a Gaussian distribution with standard deviation
Model validation
To validate the simulation method, the structure of water jets injected into a Mach 1.94 crossflow is numerically studied as the baseline case, where well-defined boundary conditions and experimental data are available in Lin et al.’s
14
work. The free-stream conditions are defined by the pressure, temperature, and density which are 29 kPa, 304.1K and 0.331 kg/m3, respectively. The temperature and the radius of injected parcels are set to constant values of 298.15K and

Geometrical parameters of the test case. All length dimensions are in millimeter.
Grid sensitive test
The cell size is determined in the calibration process because the Lagrangian submodels are highly dependent on it. The rectangular duct is discretized by structured, hexahedral mesh elements (Figure 2). In this calibration study, three different meshes are evaluated to model the reference case condition where a coarse grid with

Computational grid.
In Figure 3 (left), spray penetration heights predicted by the proposed method using the three different meshes are compared with each other. Very close penetration heights are obtained with two refined grids, while the numerical result of the coarse mesh is relatively lower. In addition, the gas density distribution along the x-axis at the center plane of y-axis and z = 0 mm on the lower wall is also compared and analyzed for better illustrating the model predictions in Figure 3 (right). Gas density distributions show that predictions of the coarse mesh have a higher density in the near-injector region and further downstream region. It has to be noted that with higher spatial resolution, the liquid parcels contained in one computational cell becomes less, and as a result, the momentum transfer in the near-injector region from the fuel to the air in the refined grid is slower. Therefore, a higher penetration is reached compared to the coarse case. When the most refined mesh is used, the axial gas density in the near-injector region of the jet is slightly lower where liquid droplets are transported farther from the injector nozzle because of the smaller external aerodynamic drag on the parcels, which lead to a higher liquid penetration height of the specific simulation. Similar trends have been obtained by Desantes et al.’s
34
work. To save the computational cost reasonably, the mesh with the grid resolution of

Comparisons of spray penetration heights and x-axial gas density distributions in the near-injector region with three different meshes.
Breakup model
Spray breakup process plays the role in mixing the fuel with air which increases the droplet surface area for rapid evaporation and combustion. It significantly affects the droplet size, penetration height, flow field structure, especially in supersonic crossflows. The performance of various breakup models in high-speed crossflows is mainly studied in this section. A further investigation and comparison is carried out for three classical breakup models such as the TAB model, the Reitz wave model, and the K-H/R-T hybrid model for better understanding of the physical mechanisms. Detailed ambient conditions and the breakup models of all cases are presented in Table 1.
Conditions for spray atomization in supersonic crossflows.
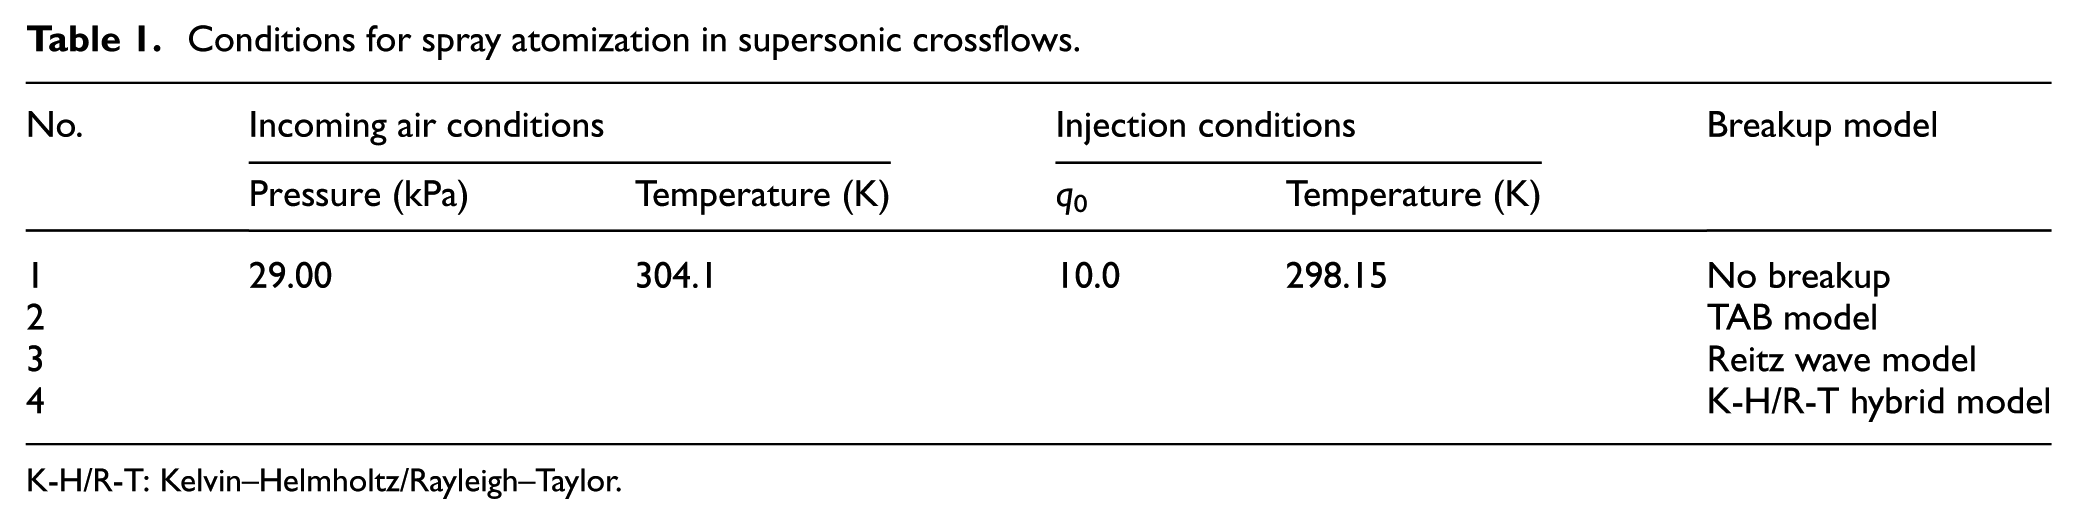
K-H/R-T: Kelvin–Helmholtz/Rayleigh–Taylor.
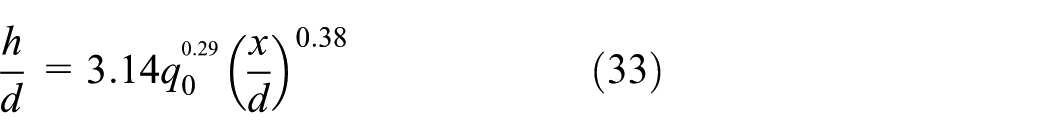
Figure 4 shows penetration heights of atomizing liquid jets when the physical flow time t > 0.2 ms where the liquid jet can be considered as stable state. The penetration height is compared with the experimental correlation function, which is developed by Liu, 35 namely
where

Comparisons of spray penetration heights: (a) no breakup, (b) TAB model, (c) Reitz wave model, and (d) K-H/R-T hybrid model.
Results show in Figure 4(a) depict that the case without breakup model significantly overpredicted the penetration height. This can be explained that the sizes and types of droplets remain unchanged when breakup contributions are ignored which results in a higher momentum and a slower momentum transfer from the fuel to the air for every droplet is obtained. Therefore, liquid droplets are transported farther away from the injector nozzle where the spray penetration overprediction occurred. The cases with different breakup models are shown in Figure 4(b)–(d). The case with Reitz wave model predicts a higher penetration height which outclasses that of K-H/R-T model which has a good match with the experimental data. This can be explained that in the near-injector region, where the fluid acceleration has a different direction to the density gradient, the R-T instabilities dominate. The K-H model is applied immediately after the injection region to provide the aerodynamic instabilities that will begin to grow on the droplet surface, which shear off smaller secondary droplets from the parent droplet surface compared to Reitz wave model and result in earlier breakup and hence lead to a shorter liquid penetration height. Additionally, it has to be noted that with the TAB breakup model, only one oscillation mode corresponding to the lowest order harmonic in the near-injector region can be represented which is the most important oscillation mode near the injector. But other modes dominate immediately once the droplets are transported farther from the injector, where the Weber number becomes larger in high-speed flow. 16 This explains that droplet appears at the bottom of the flow field in Figure 4(b), where Weber number is small and the TAB model results in earlier breakup compared to K-H/R-T model. As previously mentioned, the high Mach number drag law is used for accurately predicting the drag acting on droplets in the supersonic regime. For better understanding the influences of drag coefficients on calculation results, the simulation with the high Mach number drag law and the spherical drag law 31 is compared as shown in Figure 4(a)–(d). The predicted values of the simulation with high Mach number drag law are slightly higher than that of spherical drag law in terms of the penetration height profiles. This can be justified because of the fact that in the near-injector region corresponding to the higher relative velocity between the droplet and gas, a larger drag coefficient is predicted by the high Mach number drag law and hence results in earlier breakup, and the liquid penetration becomes shorter.
Figure 5 shows the Sauter mean diameter (SMD) profiles along the z-axis at the center plane of y-axis when x = 50 mm from injector origin. The droplet size predicted by the TAB model is the smallest, while the K-H/R-T model obtains the most accurate droplet size compared with the experimental data although there are still distinguishable differences on SMD distribution trends. So, the K-H/R-T model is the most reasonable one among these three breakup models.

SMD distribution of droplets.
Injection model
The proposed injection model is under the assumption where the droplet dispersion is dependent on the droplet size and initial injection conditions. The injection condition of each parcel is established by PDF where the state of the parcel is characterized by parameters such as position, velocity, and radius. Effects of the initial droplet size distribution and the injection position on droplet dispersion are studied in this section. A total of four types of PDFs are adopted (uniform, chi-squared, Nukiyama–Tanasawa, and Rosin–Rammler). In previous statements, simulation results of the K-H/R-T hybrid model are more accurate than that of the remaining two models. Therefore, the K-H/R-T hybrid model is used in combination of the injection model for further description on procedures of the fuel spray where the mesh used for this case remains unchanged. Table 2 illustrates representative equations of the PDFs.
Liquid spray atomization modeling table.

Thousands of dispersed droplets have been released from the center of the inlet section of the injector with the spray evolution in time and space. The number of droplets in each size interval

where N is the total number of intervals.

Droplet size distribution: discrete number frequency distribution and discrete cumulative number distribution: (a) uniform distribution, (b) chi-squared distribution, (c) Nukiyama–Tanasawa distribution, and (d) Rosin–Rammler distribution.
The cumulative distribution is another commonly used method to quantify droplet size, which is the sum of the frequency distribution as also shown in Figure 6 and associated with size Dk 31

Results shown in Figure 6 refer to all the droplets contained in a disk area near the injector which is perpendicular to the x–y plane, where the thickness is equal to the minimum cell size and has a radius of 0.5 mm. And the cylindrical centerline of the disk coincides with the center of the injector. The black bars represent the number frequency distribution characterized by PDF scaled by the vertical coordinate on the left, while the gray area shows the cumulative number distribution corresponding to the number frequency distribution scaled by the vertical coordinate on the right. Since the effect of the internal turbulent channel flow dominates at the region near the nozzle exit, which is characterized by the injection model, the profile of droplet size distribution satisfies the specific probability density distribution.
One of the most important and difficult measurements in the high-speed crossflow is the cross-sectional droplet distribution along the flow direction, because it is directly related to the mixing process and eventually the combustion performance. 18 Results shown in Figure 7 refer to all droplets contained in a slice with thickness of 0.5 mm and located at 400 mm from the injector normal to the x-axis. Different droplet size distributions are observed depending on the initial injection conditions. Strong aerodynamic forces acting on the droplet surface distort the liquid jet and promote the liquid atomization, and the droplet diameters are ranging from 20 to 40 µm, which are in accordance with experimental result. 16

Droplet size distribution at 400 mm from the injector nozzle: (a) uniform distribution, (b) chi-squared distribution, (c) Nukiyama–Tanasawa distribution, and (d) Rosin–Rammler distribution.
The number of droplets contained in Figure 7 and the mean radius of them are shown in Table 3. Quantitatively, the number of droplet prediction is the highest and the mean radius prediction is the smallest in the case of Nukiyama–Tanasawa distribution which can be explained that the percentage of small droplets injected compared to the other three cases is the highest. The smaller droplets, which are ripped out of the surface of both the liquid jet and fragment drops, are immediately transported with the gas flow due to their small inertia and highly accelerated by the co-flowing air which will reach the free-stream velocity on very short path lengths. In contrast, bigger drops with high inertia approach the free-stream velocity toward the end of the duct. With respect to spray spread, bigger drops are able to penetrate deeper into the duct because of their higher momentum which results in the higher penetration predicted by Nukiyama–Tanasawa distribution.
Comparison of droplet parameters for baseline conditions in the slice.

Figure 8 shows the numerical prediction of two-dimensional droplet distributions with different droplet size PDFs. It is clear that the case with Rosin–Rammler distribution shows a wider and higher droplet distribution. The droplet size of the newly generated parcel with Rosin–Rammler distribution is larger than other three cases as shown in Figure 6(d). Thus, the parcels are less decelerated, which augment the penetration and create a spray where the liquid is more spread in the z-axial direction.

Comparisons of spray penetration heights: (a) uniform distribution, (b) chi-squared distribution, (c) Nukiyama–Tanasawa distribution, and (d) Rosin–Rammler distribution.
Figure 9 shows the SMD profiles along the z-axis at the center plane of y-axis when x = 50 mm from injector origin. The Nukiyama–Tanasawa distribution more accurately predicted the size of child droplets, and the same behavior is shown also in the uniform distribution case and chi-squared distribution case. However, with the Rosin–Rammler distribution, the droplet size distribution is monotonously increasing which outclasses that of the experimental data. But calculation results are not able to catch the finer spray structure presented in experimental measures which is probably due to the nature of numerical method where time-averaged fields are obtained.

SMD distribution on varying probability density function.
As presented previously, in Figures 6–9 and Table 3, numerical results with four different droplet size PDFs are analyzed. Modifying the statistical description can affect the numerical results of spray procedure of free water injected into a supersonic crossflow, which are the penetration heights, SMD distributions, and so on. The primary atomization process and the exchange of momentum are greatly different, and different penetration heights and SMD distributions are achieved with different PDFs. According to comparisons of penetration heights and SMD distributions among four PDFs in this section, the prediction with the Nukiyama–Tanasawa distribution is closely related to the experimental value, showing a better spatial behavior reproducing the near-nozzle and far-nozzle flow structures.
Conclusion
An integrated Eulerian–Lagrangian method is proposed in this work which mainly emphasizes influences on numerical results when different breakup models and different statistical injection models are employed. The spray atomization of a water jet injecting into a supersonic crossflow is numerically studied by the method proposed in this article.
On one hand, detailed studies include the performance of three classic breakup models in the supersonic regime, TAB model, Reitz wave model, and K-H/R-T hybrid model, for breakup model evaluation. By comparing with the TAB model and the Reitz wave model, the K-H/R-T hybrid model shows the greatest accuracy on spray penetration height and droplet size distribution prediction, where the K-H/R-T hybrid model is selected for further study. On the other hand, studies of influences on the numerical results illustrated by the number frequency and the cumulative fraction with different PDFs are carried out. The droplet dispersion is also investigated with various droplet sizes and initial injection conditions. The droplet dispersion in the vicinity of the injector can be finely described which is related to initial injection conditions. Better reproduce of spray characteristics such as initial droplet size distribution and jet structure which will result in significant impacts on improving the engine combustion process can be obtained with reasonable PDF. Furthermore, the cross-sectional drop size distribution in the near-nozzle and far-nozzle regions is also discussed for better understanding the influence on the spray structure with different initial injection conditions. Numerical results show that simulations with the Nukiyama–Tanasawa PDF have the best match with the experimental data in terms of the local droplet size distribution and penetration heights.
Above all, the integrated Eulerian–Lagrangian method has a great ability to describe the entire spray process including the breakup that occurs near the nozzle exit in the primary breakup region.
Footnotes
Handling Editor: Takahiro Tsukahara
Declaration of conflicting interests
The author(s) declared no potential conflicts of interest with respect to the research, authorship, and/or publication of this article.
Funding
The author(s) received no financial support for the research, authorship, and/or publication of this article.