
Abstract
Port throughput, as an indicator reflecting port scale, is associated with the port–city’s population base. By establishing an allometric growth model between the two, we can well verify the delicate relationship between port throughput and urban population. This article takes the throughput of Shanghai port and the population of Shanghai city as an example and studies the relative growth rate ratio between the two, that is, the scaling exponent b. In this example, the exponent b = 0.58 which is smaller than the theoretical value of 0.85, suggesting the improper development relationship between the two for the current phase. Shanghai urban population tends to be saturated, with the growth rate slowing down, and the contribution of urban population to port throughput decreasing. If this development trend proceeds for long, Shanghai port growth scale will be severely restricted. Apart from quantitative research on the relationship between the development rates of Shanghai port throughput and Shanghai urban population, this article also uses the Logistic model to forecast Shanghai port throughput and Shanghai urban population in the future to develop a scientific plan for Shanghai port scale so that port and city can achieve coordinated development.
Introduction
International ports are, without exception, established attached to large-scale urban agglomerations, and they play a pivotal role for the economic growth and development of a country or a region. Ports are making an increasing contribution to urban economic development, while cities are the strong backing for ports to give full play to their potentials. Ports and cities are interlinked, and their relationship can be summarized as “city props up port, and port prospers city.” On one hand, port functions, scale, planning, and deployment will change accordingly in the process of port development, which will influence the functions of the city and urban spatial distribution. 1 On other hand, the social economic development in the city will not only adjust the city’s own space layout and development strategy, but also guide the port to make appropriate adjustments to constantly improve the port’s own service quality to meet the changing needs of the city and hinterland. In general, the relationship between port and city is complementary to each other. The relationship between port size and urban development reflects the rule of evolution between port and urban development, indicating the relative growth speed between port and urban development. Therefore, it is very important to study the relationship between the port scale and the urban development using allometric model.
The article consists of five parts. The remaining part of this article is organized as follows. After a relevant literature review, we will identify knowledge gaps in section “Literature review.” Section “Methodology” constructs the allometric growth model of port throughput and urban population so that a study on the rationality of relative development rates of the two can be carried out. In section “Case study,” the article carries out a case study on Shanghai port and Shanghai urban population, calculates the scaling exponent of the two elements as the coefficient determining whether the relative development speeds of the two are within a reasonable scope. Then the article uses the logistic model to predict development trends of Shanghai port throughput and Shanghai urban population, in the hope of proposing constructive suggestions on Shanghai port scale growth and Shanghai urbanization development to make port and city better coordinated for development. Section “Conclusion” summarizes the main research work and contribution.
Literature review
The correlation between a port and its city in global maritime transportation has long been a focus in the international shipping community. A number of previous studies have addressed the correlation aspects of world maritime transportation. A summary of these academic works is presented below. Much existing academic research focused on port and city relevance, different stages of port and city development as well as port and city mathematical model application.
Various scholars conducted studies on port–city relevance from a variety of perspectives including port and city economy,2–7 port and city scale,8,9 and port and city functions.11,12 Representative literature is listed as follows: Gripaios and Gripaios 2 studied the Port of Plymouth, pointing out that port development is an important tool driving regional economic growth. Musso et al. 3 and Bottasso et al. 4 studied the extent of the impact of the port’s employment rate on the local economy, and then Ferrari et al., 5 based on this study, calculated that the elasticity of service sector employment to maritime traffic is about 0.02. Ducruet 8 pointed out in his study on the relationship between the port and the city that the city scale and port throughput are highly correlated. In addition to verifying the relationship between the port and the city scale, Ducruet and Lee 10 also calculated the relative concentration indexes of 653 regions from 1970 to 2005 in other literature, to confirm the close relationship between the port and city functions.
The port and city development stage12–17 is another major direction of research. Notteboom and Rodrigue 12 pointed out in 2005 that port regionalization was a new stage of port development, and the study on relationships between urban hinterland and ports was gradually moved onto the agenda at the same time. In 2010, Wiegmans and Louw 13 pointed out that the development relationship of the Port of Amsterdam and its city, under the impact of spatial and environmental policies, had undergone significant changes—the port expansion had dramatically slowed down, and port development had entered a new phase. In 2013, Daamen and Vries 14 studied a number of big ports in Europe and found that urban planning in the new era was increasingly inclined to moving ports out of urban core areas. Such plans and guidelines also increasingly went against the sustainable development of ports. The above literature demonstrates that ports are witnessing a declining status in cities and the coordination relationship between ports and cities is gradually broken down.
Researchers on port and city models are constantly improving the existing models. Deng et al. 18 used structural equation modeling to measure the correlation between port and regional economy from the perspective of logistics, but failed to find any positive impact by the port supply and port demand on the regional economy. Tichavska and Tovar 19 set up a model for the impact by port pollutant emissions on the city’s environment, advocated to encourage regular monitoring of exhaust gas emissions and provided detailed information on pollutant emissions to address the contradiction between port pollution discharge and urban development. Other studies on relationship models between ports and cities focused on the use of analytic hierarchy process (AHP).20–24 Yang and Yu 20 as well as Yanbing et al. 21 used AHP to evaluate port functions and port competitiveness, while the AHP in ports and cities was mostly applied to port site selection in cities.
Allometric models have been introduced into the study of cities and related problems in recent years, explaining the relationship between a city and urban agglomeration, such as the allometric relationship between the largest urban population and the total population of the urban agglomeration, the relationship between the urban population and the urban geographic space. Chen and Jiang 25 presented a computer-based analytical framework for the spatio-temporal evolution of urban systems using the ideas from the allometric growth. Chen 26 explored why urban area and population size had been empirically demonstrated to follow the scaling law of allometric growth. Adhikari and de Beurs 27 used allometric analysis method and multi-temporal Landsat images to map the urban extent of six small to large cities in West Africa at four different time steps from the early 1970s to 2010s. Chen 28 developed a process of multiscaling allometric analysis for the studies of urban and regional development.
To sum up, relevant literature is dominated by those studying port and city relevance, port and city development stages, and port and city mathematical models. However, not much research has been done on associating port throughput growth with the city’s population growth rate as well as on research and forecast of their development relevance. In this article, the relationship between urban development and port logistics development is studied, and the relative growth rate between port and urban population is studied. Allometric models are used to explain the development trend of port throughput and urban population. Therefore, this article is committed to solving the following three questions: (1) to study the relationship of growth rates between port throughput and urban population, (2) to forecast the future trends of port throughput and urban population, and (3) to propose constructive suggestions on scaled development of ports and urbanization development. In this article, we use the allometric growth model to study the relationship between port throughput and urban population development and use a logistic model to predict the two elements, proposing suggestions to enable cities to better support port development and ports better serve cities.
Methodology
Basic framework of the model analysis
We can establish an allometric growth model between port throughput and urban population, two elements in an urban system, to determine the ratio of the relative growth rate of port throughput to the relative growth rate of urban population. Port throughput is affected by international economic and trade, urban population development, regional industrial structure and other factors, and the various factors are complex and influence each other. In order to better explain the problem, this article focuses on the relationship between port throughput and the development of urban population. By this means, we can compare the difference and work out the relationship between the development speeds of the two and explore the time when and the reason why the scaling relationship is broken down. Based on this, we can use the logistic model to forecast the development trends of port throughput and urban population to determine the planned port scale for the next phase of development and well coordinate the relationship between port area scale and city scale.
Allometric growth model formulation
Allometric models are different from other correlation analysis models, because they can not only explain quantitatively the relative growth relationship among two factors, but also the model is nonlinear, which is superior to other models under the background of linear research. The allometric growth model in this article applies to the longitudinal allometric growth, and the subject of study is the dynamic process of a single object in the evolution over time, which is different from the horizontal allometric growth that studies multiple objects in a static pattern. In recent years, the longitudinal allometric growth model has been widely used to study the correlation between urban population and urban land, so as to work out the land use rate and the urban population saturability. The dynamic evolution of urban population is the focus of such research and the mathematical model constructed is

where
According to the above equation, we can see that the allometric scaling exponent


In the equation,
Logistic model formulation
Allometric model is used to study the relative development relationship between port throughput and urban population. This research is mainly based on historical data research, while the logistic model is mainly used for prediction and analysis of future trend. The integration of the two methods is not only a study of the relationship between the past and present development of the two variables, but also the future development trend of the two. The allometric growth model does not apply to throughput and population prediction, because the exponential growth process is unconstrained, while any factor in reality is subject to constraints of natural conditions. The first half of the logistic growth curve follows the exponential growth process, while the latter half is similar to logarithmic growth. We can use the second half of the logistic model to estimate the maximum carrying capacity for port throughput and urban population and effectively predict the future scales of the two. The specific model is as follows


In the equation,
Take the derivative of Equation (5) with respect to t, and we will get

Discretize equation (7), and we will get the following form
Expand equation (8), it will be

Substitute

Make


In equation (10), we can then convert equation (10) to

Then, with the known
Case study
Descriptive analysis of the case studied
The rapid economic rise of port cities will further accelerate the urbanization process. However, urbanization is a double-edged sword, bringing both development opportunities and grim tests, such as the dramatic increase in urban population, scarce land areas, and shortage of natural resources. While booming city development, urbanization also positively affects port cargo throughput and workload growth, thereby driving economic development in favor of urbanization. The problems brought about by urbanization also pose new challenges to ports. For example, the urgent need of expanding the urban area may form conflicts with the expanding port land areas and the increasing number of machinery equipment at ports among other situations, which is not conducive to coordinated development of the port and the city.
Shanghai acts as an important part of China’s international trade, and its trade development will play a due role in Shanghai’s economy, promoting the urbanization process in Shanghai. With the launching of international or domestic trade activities in Shanghai, a lot of population will flood into Shanghai, which directly accelerates the urbanization process in Shanghai. This article explores the impact of Shanghai’s urbanization process on Shanghai port. Combined with the actual situation, Shanghai port is gradually expanded, with its land area surging, forming a conflict with the shortage of natural resources that are needed for Shanghai urbanization. To this end, we establish a model for discussion.
This article studies the allometric growth relationship between Shanghai port throughput and Shanghai urban population and selects the cargo throughputs (unit: 10,000 tonnes) of Shanghai port from 2005 to 2015 and the population of Shanghai city (unit: 10,000 people) as the raw data. The data source is the China Statistical Communique, as shown in Figure 1.

Raw data of cargo throughputs of Shanghai port and Shanghai urban population from 2005 to 2015.
Model establishment
The study on the allometric growth relationship between the cargo throughput of Shanghai port and Shanghai urban population and the prediction of the future scales of the two variables are composed of the allometric growth model in section “Allometric growth model” and the logistic forecast model in section “Logistic forecast model” (Figure 2). Specifically, the allometric growth model is mainly used to measure the scaling exponent b to analyze the development relationship between throughput and urban population, and the logistic model will be applied to the forecasts of port throughput and urban population, respectively.
Allometric growth relationship between Shanghai port cargo throughput and Shanghai urban population from 2005 to 2015.
Allometric growth model
Basic allometric growth model

Take the logarithm on both sides of equation (1), and we will get

Define

Apply linear fitting to the data using the ordinary least squares method to get the values of constants
However, considering that the data points corresponding to 2009 and 2010 (i.e. the points in red circles in Figure 2) are far away from the fitting straight line, the total port throughput is too small relative to the urban population in 2009. With respect to port throughput, the urban population is too large and can be regarded as exceptional. The existence of these outliers will affect the accuracy of the model fitting and parameter estimation. Therefore, outliers need to be eliminated, and then the regression analysis is carried out after elimination.
Apply linear fitting and we will get

Similarly, we can work out

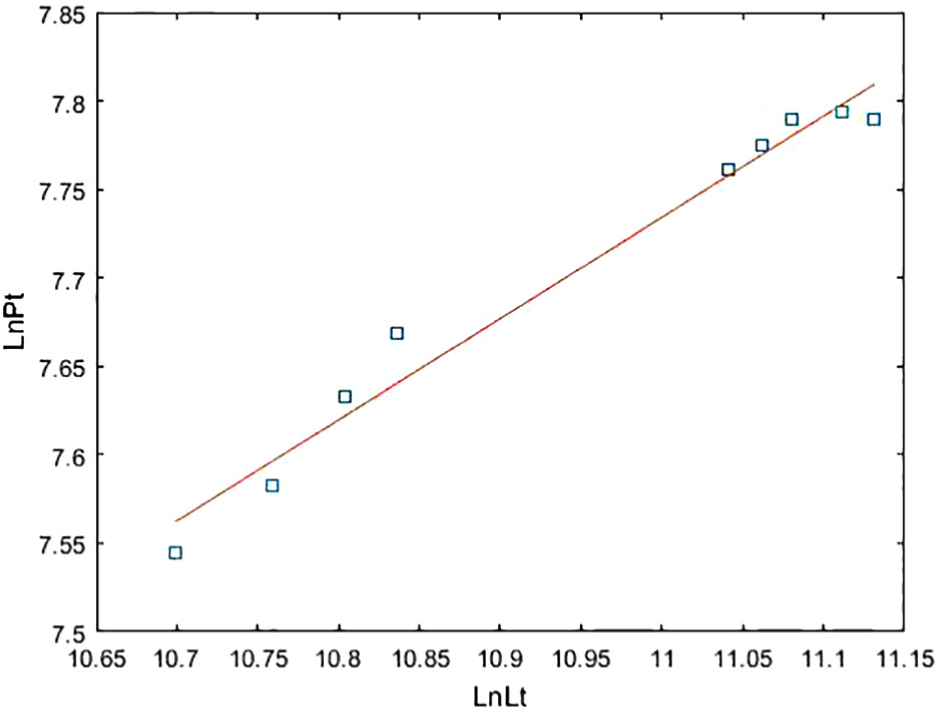
Allometric growth relationship between Shanghai port cargo throughput and Shanghai urban population after the removal of exceptional points.
Apply the linear fitting method for the data from 2005 to 2008, and we can get

Similarly, we can work out

Allometric growth relationship between Shanghai port cargo throughput and Shanghai urban population from 2005 to 2008.
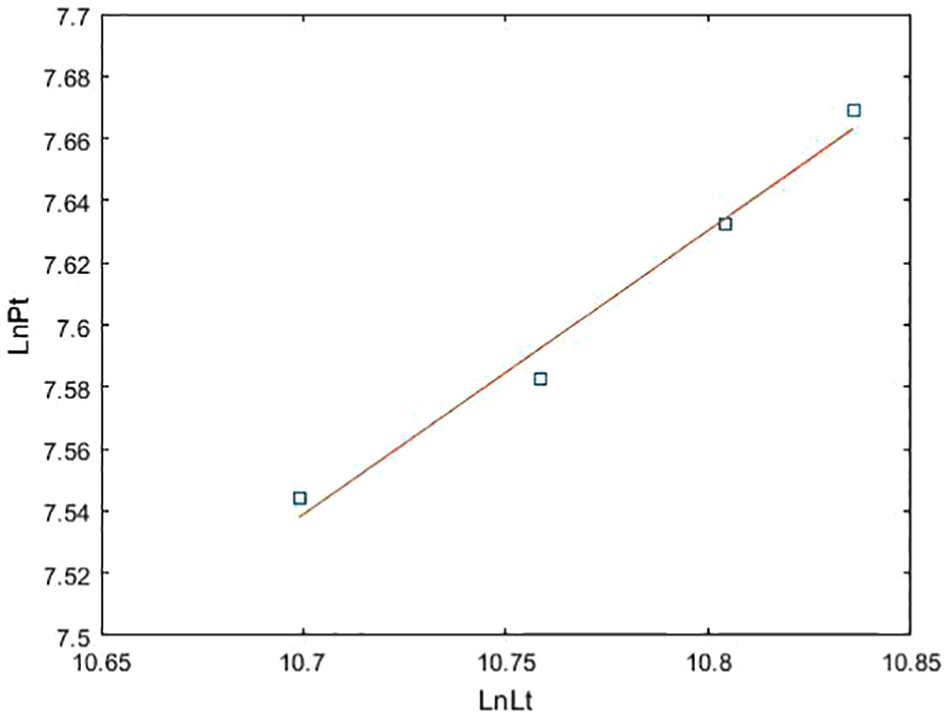
Apply the same linear fitting method for the data from 2009 to 2013, and we can get

Similarly, we can work out

Logistic forecast model
The scarcity of resources determines that things will not grow infinitely forever and will eventually reach the ceiling. In the long run, the cargo throughput of Shanghai port and the urban population of Shanghai city are both in line with the logistic model, meeting the exponential growth in the early period, then slowing down in the later period, and finally approaching saturation. There are three parameters in the logistic model. Ordinary regression methods are difficult to fit such a curve. That is why we need to flexibly use the ordinary least squares method to fit the curve function. The second half of the curve is similar to a logarithmic growth process, and we can use the second half of the logistic model to effectively predict the port throughput and urban population. The forecast model is

We can deduce from equations (8) to (12) that

At this point, we can use the existing data and equation (13) to forecast variables following the ordinary least squares principle.
Direct forecast
The direct forecast method is to use historical data to estimate the coefficients of the logistic model and then substitute the time sequence
The allometric growth model (2) after the removal of exceptional points regards the port throughputs in 2009 and 2010 as exceptional in the fitting process. But when we use the logistic model, it is necessary to introduce the time sequence
Based on the
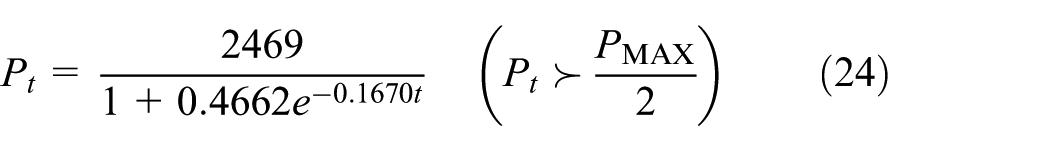
Using equations (6) and (11) simultaneously, we can get
Thus, the second half of the logistic forecast model for port throughput will be

Integrate the entire port throughput forecast model, namely integrating the first half of the allometric growth model and the second half of the logistic model
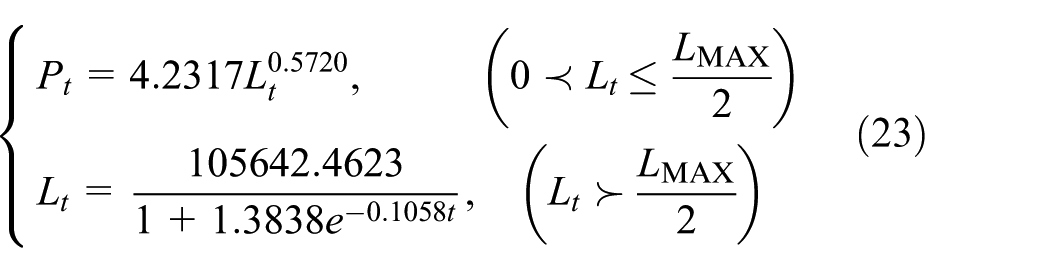
Using the same method, we can get the urban population forecast model
Indirect forecast
The indirect forecast method is to use the allometric growth model for prediction and study the inter-relationship between the two factors, without involving the impact of time sequence
The allometric models (3) and (4) take into account the data for 2005–2008 and 2009–2013, respectively, and need to perform a comprehensive evaluation on the two sets of data. As a result, in the fourth column in the above table, the allometric models (3) and (4) average the population projections for the two sets of data.
Data analysis
From our research results, we can find that Shanghai port throughputs and Shanghai urban population between 2005 and 2008 well comply with the longitudinal allometric growth relationship (see Figure 1). From 2005 to 2008, the allometric growth model (3) for port throughput and urban population is

Allometric growth relationship between Shanghai port cargo throughput and Shanghai urban population from 2009 to 2013.

Shanghai port cargo throughput Lt-1 and Lt.
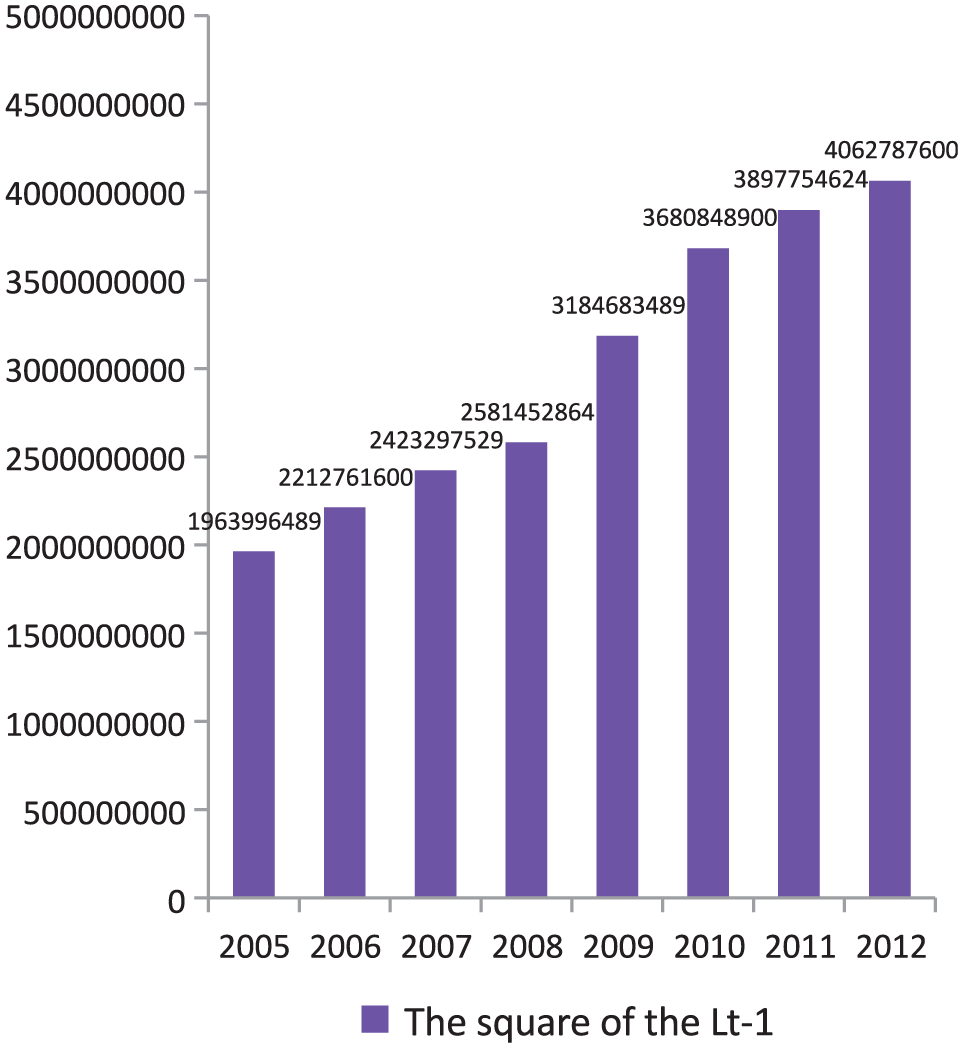
The square of Shanghai port cargo throughput Lt-1.
In the long run, both Shanghai port throughput growth and Shanghai urban population growth are subject to the logistic model. In this article, we use the nonlinear fitting method to estimate the logistic model parameters. Based on the data from 2005 to 2013, we can work out the logistic growth model of Shanghai port throughput

Using the same method, we can get the logistic growth model of Shanghai urban population

With the help of the above models, we can forecast Shanghai port throughputs and urban population from 2017 to 2030 (Figures 8 and 9). Only one method is available for forecasting port throughput which is the direct forecast using equation (18). For the Shanghai urban population from 2017 to 2030, however, we can use equation (20) for direct forecast, or three allometric growth models for indirect forecast.

Forecast of Shanghai port cargo throughput from 2017 to 2030.
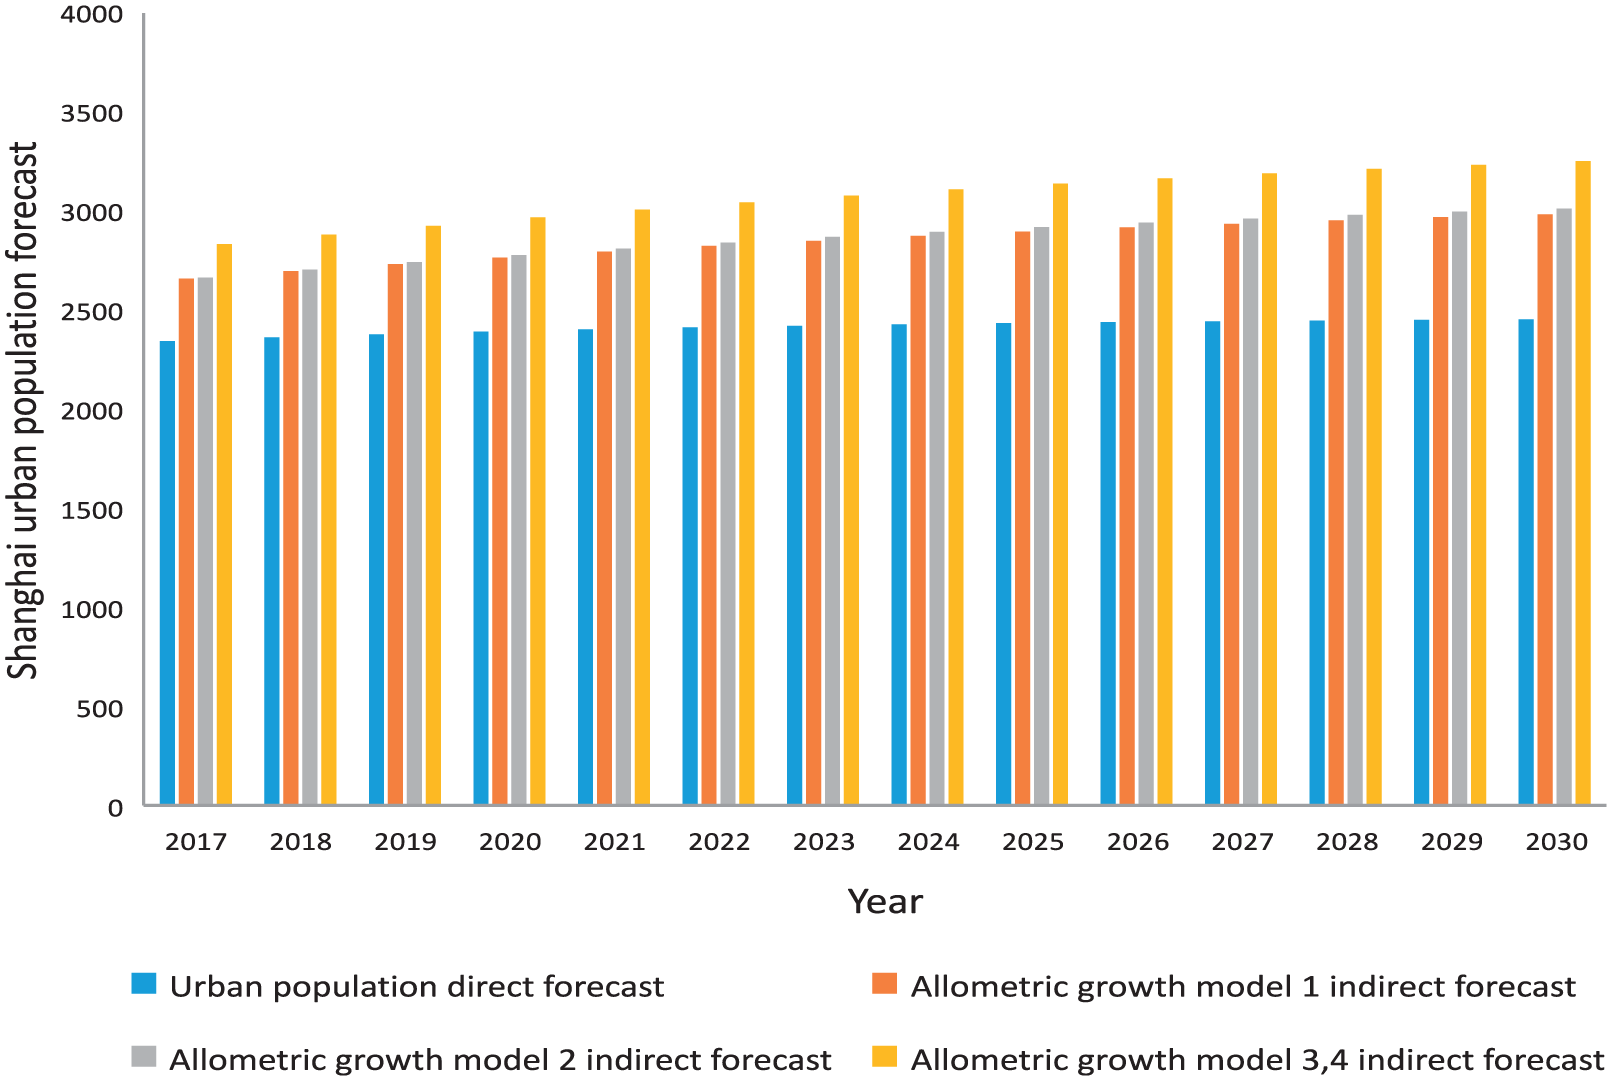
Forecast of Shanghai urban population from 2017 to 2030.
Logistic growth suggests that port throughput growth and urban population growth are in line with the first-accelerated-then-decelerated trend. When the port throughput reaches half of the maximum value, that is, 528.212312 million tonnes, or the year of 2010, the port throughput growth reaches the maximum rate. When the urban population reaches half of the maximum value, the population growth rate reaches the highest. Shanghai’s urban population growth precedes the port throughput growth, with a time lag in between.
According to the aforementioned allometric growth model (2) for Shanghai port cargo throughput and Shanghai urban population after removal of exceptional points, we can learn that when Shanghai port cargo throughput increases by a percentage point while other conditions remain the same, Shanghai urban population will increase by about 0.5720% points. That is to say, the increase in Shanghai port cargo throughput is greater than that in the urban population. The current situation is that Shanghai’s urban population is close to saturation and the potential for driving port scale growth through increasing urbanization level is small. Shanghai port scale may be limited to some extent. Once the population is saturated, increasing the breadth of population has little space, so we need to switch to exploring the depth of population, namely improving people’s unit goods demands and production capacity and elevating port cargo shipping demands to enable port throughput to continue high-speed development.
Conclusion
The contribution of this study is threefold. First, this study makes an initiative for the assessment of the relationship of growth rates between port throughput and urban population. Second, this research provides a practical tool for the tendency analysis of port throughput and urban population. Third, the achievements of this study can provide decision-making basis and information reference for relevant governments or policy makers to formulate reasonable and effective governance strategy of port production and port–city development. In recent years, with the construction of Shanghai International Shipping Center, the development of Shanghai port has become a top priority, with the port size increased. However, because of the current slowdown in the urbanization progress, a larger port does not generate a considerable facilitating impact on Shanghai urban development. Shanghai urban population grows by a very small margin, which fails to strongly push forward Shanghai port throughput. The development of the two does not match, and the gap between the port and city becomes wider.
To improve the scale effectiveness, port area utilization, and operation efficiency of infrastructure at Shanghai port, the port needs to occupy valuable land areas. Shanghai urbanization development should address the following two issues: First, the high housing prices. Shanghai’s high housing prices reduce the number of people in Shanghai, which is not conducive to the development of urbanization in Shanghai. The central and local governments should introduce effective policies to maintain the housing prices within a reasonable range. Second, Shanghai needs to create more job opportunities. At the same time, the two-child policy may boost the population growth in Shanghai. Currently, Shanghai population grows slowly, and the potential for driving port scale growth through elevating urbanization levels is small. Shanghai port scale will be limited to some extent. Given that the breadth of population growth is limited, we can start from another angle—improving the unit good demands and production capacity of people and elevating port cargo shipping demands to promote port throughput rise. At the same time, the forecast results in this article also imply that the growth of Shanghai port scale has exceeded the maximum growth rate and growth slowdown is an indisputable fact. Therefore, Shanghai port should focus on maintaining the throughput and meanwhile gradually introducing high-end shipping services and improving shipping soft power, so as to transform its shipping center construction from the elementary shipping phase to the service-oriented shipping and intelligent shipping phase.
Footnotes
Acknowledgements
The authors thank the reviewers and editors for their valuable comments and kind help with this article. However, the authors are solely responsible for all the views and analyses in this article.
Handling Editor: Gang Chen
Declaration of conflicting interests
The author(s) declared no potential conflicts of interest with respect to the research, authorship, and/or publication of this article.
Funding
The author(s) disclosed receipt of the following financial support for the research, authorship, and/or publication of this article: The authors gratefully acknowledges the support from the National Natural Science Foundation of China (grants nos 51409157 and 51508319), Program of Humanities and Social Science of Ministry of Education of China (14YJC630008), and Shanghai Pujiang Program (17PJC053), and Shanghai Science & Technology Committee Research Project (15590501700).