
Abstract
This article investigates weak thruster fault detection problem for autonomous underwater vehicle subject to the external disturbances. A weak thruster fault detection method is developed based on the combination of artificial immune system and single pre-processing. The number of measurable autonomous underwater vehicle’s signals is limited and the weak thruster fault is easy to be compensated by the closed-loop control system. In this developed method, signal pre-processing is first used in the original autonomous underwater vehicle signals, including signal transformation, data fusion based on Dempster–Shafer evidence theory, and feature extraction based on isometric mapping algorithm, to reduce the external disturbance effect and prominently reflect thruster fault. Then artificial immune system is applied to conduct anomaly detection based on the processed autonomous underwater vehicle signals. In the process of fault detection, it includes two stages, training stage and testing stage. In training stage, the detectors are generated at first based on the autonomous underwater vehicle signals in healthy condition based on negative selection and positive selection. And then in testing stage, the generated detectors are used to detect whether fault occurs or not based on the principle of self and non-self discrimination. Finally, to evaluate the performance of the developed fault detection method, Beaver 2 autonomous underwater vehicle is used to conduct experiments. The comparative results demonstrate the effectiveness of the developed method.
Keywords
Introduction
Autonomous underwater vehicles (AUVs) operate in a complex ocean environment without any umbilical cable.1,2 Safety is one of the most important issues in AUV operation.3,4 Thrusters are the most essential component to provide thrust, but faults are liable to occur.5–8 In general, thruster fault always begins from a weak fault and then develops to a serious fault. 9 Therefore, it is much important and useful to investigate the weak thruster fault diagnosis problem, which is also one of the hot topics in AUV field.
Nowadays, the fault diagnosis methods can be classified into qualitative diagnosis and quantitative diagnosis. 10 In the quantitative diagnosis methods, it includes dynamic model–based diagnosis and data-driven-based diagnosis. 10 Since it does not need an accurate AUV dynamic model, the data-driven-based fault diagnosis has attracted an increasing number of researchers’ attention. 10 Fault diagnosis method was proposed based on discrete wavelet transformation and neural network. 11 A thruster fault diagnosis method was proposed based on particle filter, 12 where thrusters’ abnormal cases were described using a switching-mode Markov model. Zhu and Sun 5 investigated the jammed thruster fault diagnosis method based on information fusion. In addition, the authors have also investigated thruster fault diagnosis method based on wavelet decomposition, 13 single-channel blind source, 14 and support vector domain description. 15 In the above references, the fault is always serious, and they have not involved with weak thruster fault diagnosis problem.
This article investigates fault detection method for AUV with weak thruster fault (the magnitude of fault is less than 0.1). In research, it is found that it is not effective to detect weak thruster fault based on the conventional data-driven diagnosis methods. The fault feature is always hidden by the external disturbance, resulting in high probability of false alarm or undetected fault. According to the analysis of the experiment data and diagnosis results, it is found that the difference between the weak thruster fault feature and external disturbance feature is small, even the former may be smaller. If directly applying the existing thruster fault diagnosis methods, the fact would cause some problems, such as the extracted feature is not enough or does not follow a strong rule. All these would cause that false alarm or undetected fault always occurs.
So far, there is no report on weak fault diagnosis based on artificial immune systems (AISs) for AUVs subject to external disturbances. This article aims to provide a new algorithm for weak thruster fault detection of an AUV. AISs can make full use of a great number of the available data in the healthy condition to generate detectors used for anomaly detection. 16 AISs are inspired by biological immunity system where the surface receptors in the immune cells can discriminate the body’s own cells (called self), from foreign ones (called non-self).17,18 Nowadays, AISs have been widely applied for fault detection, pattern recognition, and classification. 19 It has be noticed that AIS itself is not totally perfect, and it still has some problems to be investigated further. But in this article, we do not investigate the AIS algorithm, but apply AIS to detect weak thruster fault in AUVs.
Due to space and size limit, the signals provided by an AUV are limited. For example, in Beaver 2 AUV designed by the authors’ group, AUV velocity, attitude, and the controller output (control voltage) can be provided and we cannot obtain information on the thruster itself, such as thruster voltage, current, or rotation speed. When fault, especially weak fault, occurs in a thruster, it does not have a serious influence on the AUV velocity and attitude, due to the action of the closed-loop controller. This means that AUV velocity and attitude cannot directly reflect the thruster fault effect. Therefore, when directly adopting these signals as input of the AIS algorithm 20 for fault diagnosis, it is found that the detection result is not satisfactory, that is, the false alarm or undetected fault always occurs. Therefore, before conducting fault detection based on AIS, we need to extract the feature from the available AUV signals.
Based on the above-mentioned consideration, this article investigates weak thruster fault detection problem for AUV subject to external disturbances based on the combination of AIS algorithm and signal pre-processing. In this research, Beaver 2 AUV is controlled to track a fixed longitude velocity and yaw angle. To adjust the magnitudes of those signals into a same range and remain their raw feature as much as possible, at first, a novel signal transformation is developed based on the ratio between the deviation degree of a signal from its desired value or mean value. After signal transformation, Dempster–Shafer (D-S) evidence theory is used to conduct data fusion. According to data fusion, the high-dimensional signals are reduced to be one-dimensional signal. After that, phase space reconstruction and isometric mapping (ISOMAP) are used to extract feature points from the one-dimensional signal. Finally, according to the extracted feature points, the AIS algorithm is used to detect whether weak thruster fault occurs or not. In the process of fault detection based on AIS, it includes two stages, training stage and testing stage. In training stage, the detectors are generated at first based on the AUV signals in healthy condition based on negative selection and positive selection. Then in testing stage, the generated detectors are used to detect whether fault occurs or not based on the principle of self and non-self discrimination. In experimental verification, experiments with different kinds of weak thruster fault are performed on Beaver 2 AUV to demonstrate the effectiveness of the developed fault detection method.
The article is organized as follows. Beaver 2 AUV and experiment setup are described in section “Beaver 2 AUV and experiment setup.” In section “Weak thruster fault detection based on AIS and signal pre-processing,” the developed fault detection method based on AIS and signal pre-processing is presented. Then the experimental verification is shown in section “Experiment verification.” Finally, we draw the conclusions of this article.
Beaver 2 AUV and experiment setup
In this study, Beaver 2 AUV 14 (see Figure 1) is used to perform experiments. Beaver 2 AUV was designed in the authors’ laboratory in 2014. Beaver 2 AUV’s length, width, and height are 0.8, 0.5, and 0.4 m, respectively. Its dry weight is 50 kg and it is slightly positively buoyant. 7 In Beaver 2 AUV, the sensor system includes Micro 6000 DVL (measuring AUV’s velocity in body-fixed frame), HMR3000 digital compass (measuring AUV’s attitudes), and depth gauge (measuring AUV’s depth). Figure 2 shows the thruster distribution, and the current of thrusters is not measurable, since the thrusters are designed to be as small as possible by the authors’ laboratory. In addition, the simulated water current is generated based on our designed device, as shown in Figure 3. 14
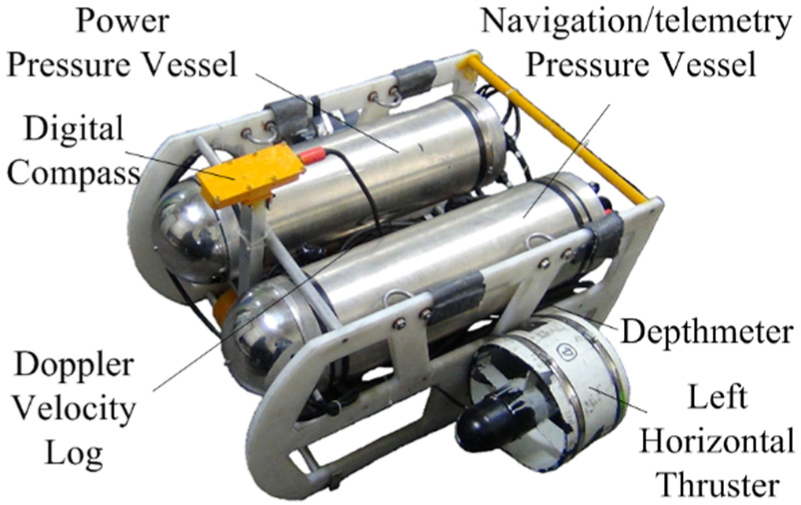
Beaver 2 AUV. 14

Thruster distribution. 14

Water current simulation. 14
In experiments, Beaver 2 AUV is controlled to track the fixed longitude velocity and yaw angle. The desired longitude velocity and yaw angle are 0.3 m/s and 90°, respectively. Proportional–integral–derivative (PID) controller is adopted. During experiments, thruster fault occurs in the left horizontal thruster from 100th to 400th control steps. The thruster fault is simulated according to a software method, 14 where the expression is shown as equation (3)

where

Experiment data in the case of 10% thruster fault: (a) control voltage, (b) longitude velocity, and (c) yaw angle.
This article researches on thruster fault detection method for AUV at stable speed. It should be noted that in the later experiment verification, the data from only 100th control step to 500th control step are used, since during the first 100 control steps, AUV states are not stable. Due to the limits of the sensors carried by Beaver 2 AUV, in this study, only longitude velocity, yaw angle, and control output are used. Since Beaver 2 AUV moves on the horizontal plane, the depth signal is not used.
Weak thruster fault detection based on AIS and signal pre-processing
In this article, AIS and signal pre-processing are combined together to constitute a novel fault detection method for an AUV with weak thruster fault. In the developed fault detection method, wavelet denoising is used in AUV raw signals to reduce the influence of external disturbance as much as possible, and then due to the great differences among the signals, the signals are transformed, so as to keep the signals in the same range. Next, D-S evidence theory is used to conduct data fusion, changing the three-dimensional data into one-dimensional data, so as to retain the main feature used for fault detection. Furthermore, to use ISOMAP to extract feature from the fused data, one-dimensional data need to be increased as higher dimension. Finally, the extracted feature points are used to detect whether a fault occurs or not among these signals based on AIS algorithm. The systematic diagram of the novel weak thruster fault detection method based on AIS and signal pre-processing is presented in Figure 5.

Diagram of thruster fault detection based on AIS and signal pre-processing.
In the following, data fusion based on signal transformation and D-S evidence theory, feature extraction based on ISOMAP, and anomaly detection based on AIS, respectively, will mainly be introduced.
Data fusion based on signal transformation and D-S evidence theory
To make the developed method clearer, first, some basic processes of tradition D-S evidence theory will be presented. Then in this study, a novel signal transformation and D-S evidence theory are combined to fuse data.
1. D-S evidence theory
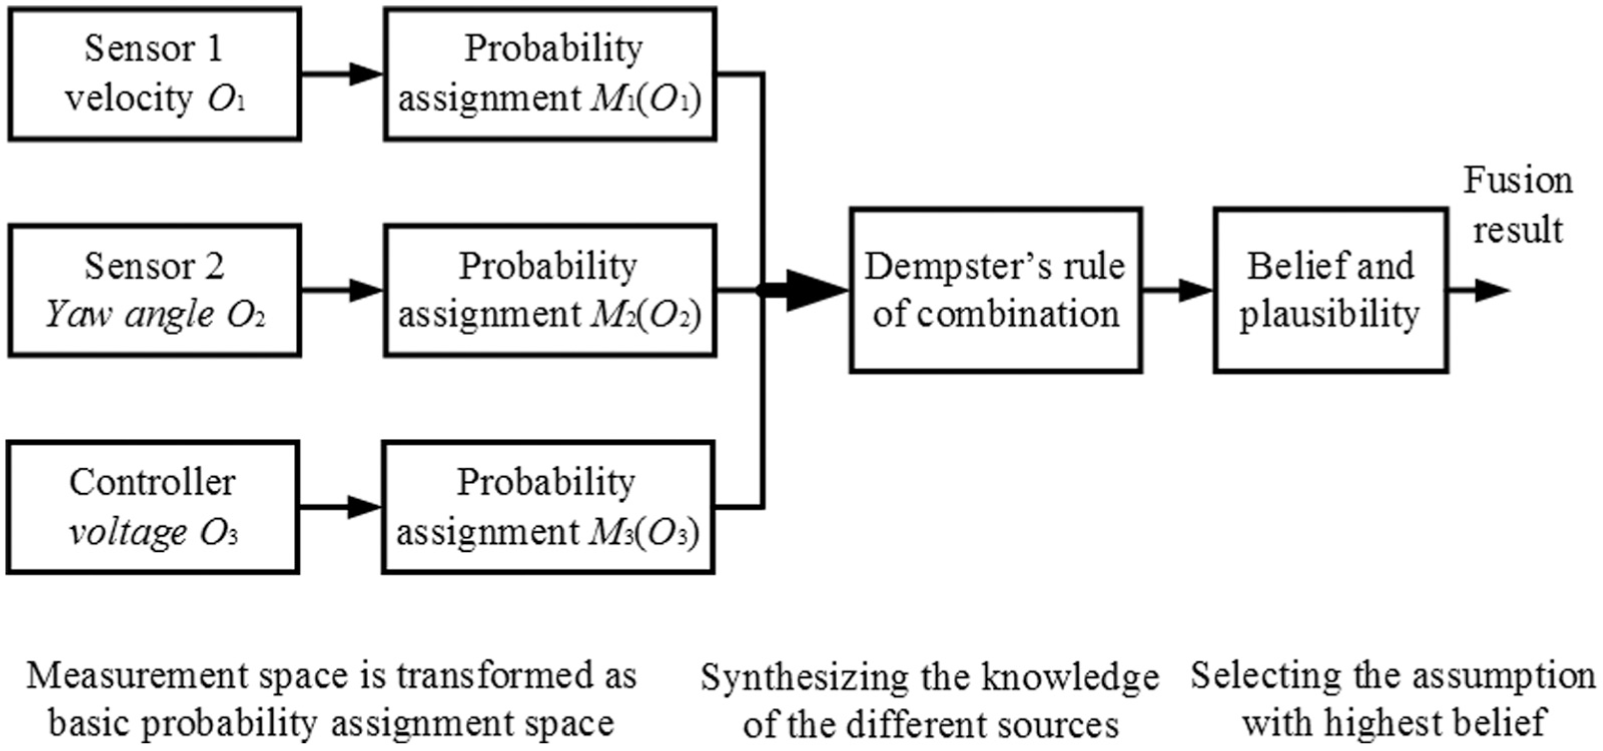
D-S evidence theory has attracted a number of researchers’ attention, due to its good ability to deal with uncertainties in data fusion. Based on the process of the classical D-S evidence theory, Figure 6 is given to show the process of data fusion for AUV signals. The measurement values from sensors or controller are used to construct a measurement space. Mk is the basic probability assignment, and it is within the range of [0, 1], which quantifies the strength of the reliability of the measurement value. Then the measurements from different sources can be combined with Dempster’s rule of combination. The assumption with the highest reliability is selected as the final fusion result.
2. The developed data fusion based on D-S evidence theory and signal transformation
Data fusion process based on D-S evidence theory.
From Figure 4, great differences in the magnitudes among AUV longitude velocity, controller voltage, and yaw angle can be seen. To keep these signals in the same range, normalization is always considered at first. But in this study, it is found that although normalization could reduce the deviation of yaw angle, it also increases the deviation of longitude velocity and control voltage. To transform the AUV’s signals into the same range and maintain the feature of the raw signals in general, a novel transformation method is provided by adopting the expected value rather than the difference value between highest and lowest points of each AUV’s signal. The details of the new signal transformation method are given below.
The classical normalization is finished according to equation (2)

where xi denotes the signal;
In this article, the classical normalization cannot improve the fusion result. The signal is transformed based on our developed transformation method shown as equation (3)
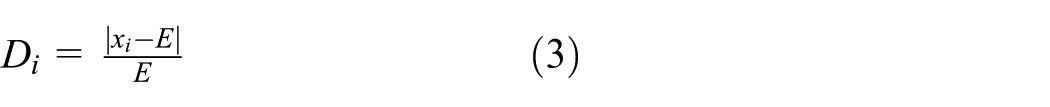
where E is the expected or mean value, and Di denotes the transformation result at ith time.
After using equation (3) to transform the raw signals to the same range, D-S evidence theory is adopted to fuse the transformed signals. The process of D-S evidence theory is shown in Figure 6. In section “Experiment verification of data fusion,” the effectiveness of the combination of D-S evidence theory and signal transformation is demonstrated by experiments on Beaver 2 AUV.
Feature extraction based on ISOMAP algorithm
ISOMAP is a kind of manifold learning algorithms and has been considered a good way to extract feature from high-dimensional data, due to its advantage of high efficacy, less parameters, and global optimization. 21 It provides a simple way to analyze and manipulate high-dimensional observations in terms of their intrinsic nonlinear degrees of freedom.22,23 It also recovers the known low-dimensional structure of high-dimension data with noise.22,23 In general, it includes three steps, constructing neighborhood graph, computing shortest paths between all pairs, and constructing k-dimensional coordinate vectors. The basic procedures of the ISOMAP algorithm are summarized as follows: 21
1. Construct neighborhood graph
As for any two points (xi, xj) in input space, calculate their distance, denoted as dx(i, j). If the distance is less than ε, or xi is one of the point’s (xj) K nearest neighbors, these two points will be connected, and the length of this edge is set as the same as the value of dx(i, j).
2. Compute shortest path
The geodesic distance is estimated by the shortest path dG(i, j), and the matrix of geodesic distance (Dm) is obtained.
At first, as for any two points (xi, xj), if these two points are connected, the initial value of dG(i, j) is set as dx(i, j); otherwise, dG(i, j) = ∞. For each value of k = 1, 2,…, N, the value of dG(i, j) is replaced by min{dG(i, j), dG(i, k) + dG(k, j)}. Finally, the matrix DG = {dG(i, j)}.
3. Construct d-dimensional embedding
Calculate the first d eigenvalues (λ1≥λλ2≥ … ≥λλd) of the matrix

where I is the identity matrix; e is a column vector and its elements are 1.
Then construct a diagonal matrix V as

Another diagonal matrix is constructed by the corresponding eigenvalue vectors (u1, u2,…, ud)

Finally the d-dimensional vector (also extracted features) is given by

According to the above mentioned ISOMAP steps, when directly extracting features from the original signals, including control voltage, longitude velocity, and yaw angle, respectively, the result is as shown in Figure 7.
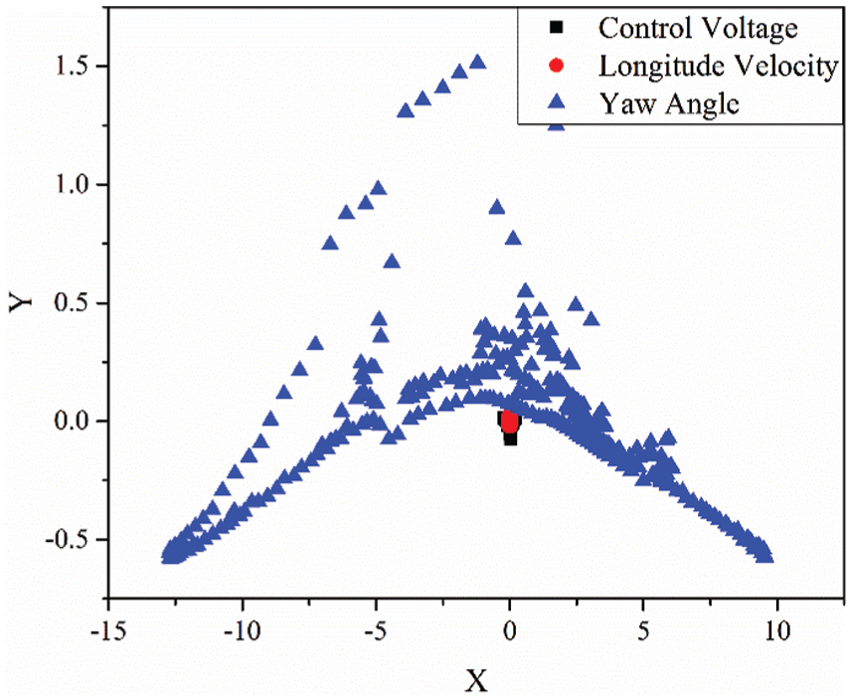
Feature extraction results based on ISOMAP.
From Figure 7, the feature distributions of these three signals are not central and very different. Specifically, the features from yaw angle signal are widely distributed, while the features from the other signals are almost focused on a point. Based on the extracted features, it will still be difficult to detect weak thruster fault.
In this study, the fused results in section “Experiment verification of data fusion” are used to extract features based on ISOMAP. But the fused results are one-dimensional. To use ISOMAP algorithm to extract features, phase space reconstruction is used to allow the one-dimensional fused results to increase as higher dimensional signals (three dimensions in this study). The process is shown in Figure 8. The effectiveness of the developed feature extraction method is verified in section “Experiment verification of feature extraction.”
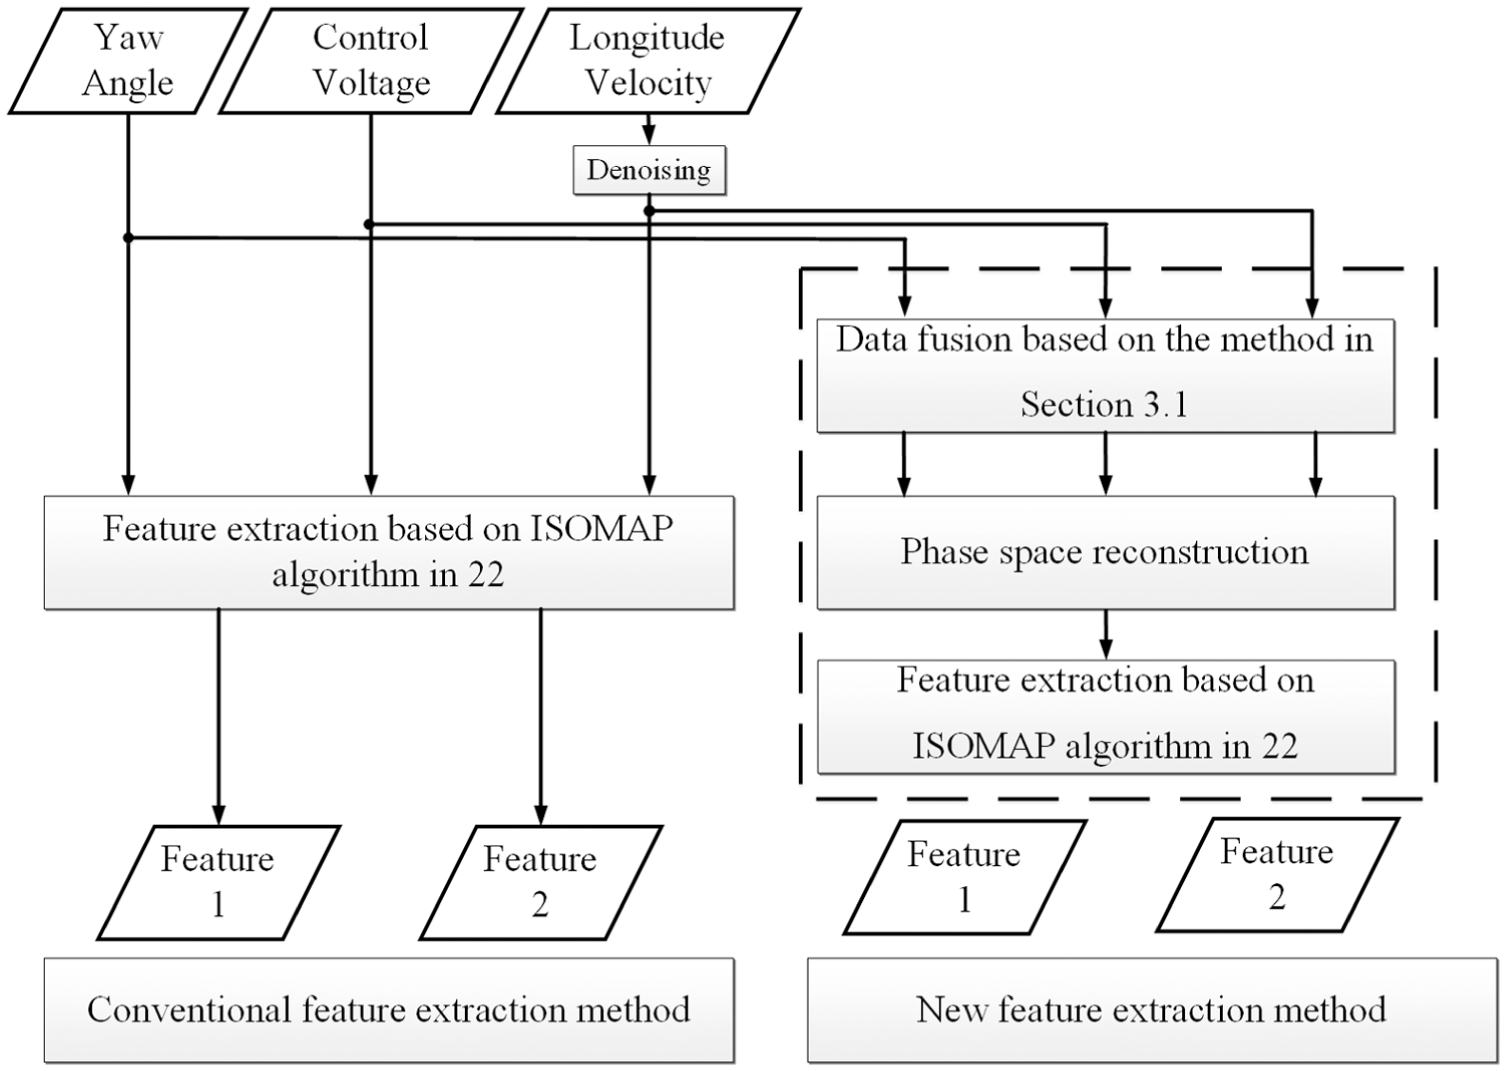
Diagram for feature extraction.
Anomaly detection based on AIS
After extracting the feature from the raw AUV’s signals, it is still difficult to detect whether a fault has occurred or not. In traditional fault detection methods, it always uses residual error to detect, where thresholds are needed. However, as for weak thruster fault in AUV with the presence of ocean current disturbance, the thresholds are difficult to design, since the magnitude of the weak thruster fault is less than that of the external disturbance sometimes. An unsuitable threshold would increase the probability of false alarm or undetected fault.
The biological immunity system has the ability to detect exogenous entities, but not reacting to the self cells. AIS is an intelligent system inspired by the principle of biological immunity to detect the self cells and non-self cells. 18 There are many algorithms to achieve AIS, including negative selection strategy and positive selection strategy. Recently, AIS has been widely used in fault detection.17,19 The process of AIS in general includes determination of identifiers, normalization, clustering of data, generation of detectors, optimization based on positive selection, and detection of anomalous patterns.
In this article, AIS and the extracted features in section “Experiment verification of feature extraction” are combined together to constitute a novel fault detection method for an AUV with weak thruster fault. In the developed fault detection method, the extracted features are used as the input of AIS. The basic process of anomaly detection is shown in Figure 9.

Basic procedures for anomaly detection based on AIS in this article.
According to Figure 9, it will focus on the process of the generation of self and detectors, and how to detect whether a fault occurs or not based on the generated detectors.
1. Generate the self and detectors based on the data in healthy cases
At first, the data are obtained by experiments on Beaver 2 AUV without thruster faults. Then for experimental data, the pre-processing mentioned before is used to reduce the effect of external disturbance as much as possible and extract feature points used in the generation process of self. Next, these extracted feature points are clustered and the maximum radius (rs, the maximum radius of each element of the self-set) is calculated based on clustering algorithm in Sanchez. 20 Based on the steps, the self-set is determined.
The next step is to generate detectors based on the self. According to Sanchez, 20 the real-value negative selection strategy is first used to generate detectors. At first, a certain number of detectors with an initial radius are randomly distributed in non-self space (the other part non-belonging to self in the whole space). And then two optimization criteria are considered from Sanchez 20 to adjust the radius of the detectors, including no overlap among the detectors and self and the maximum covered areas in the non-self. In this process, some detectors would be deleted if the optimized radius is less than a certain value (given a priori).
After obtaining the detectors based on negative selection strategy, positive selection strategy is also used to further make the detectors more effective. Similar to the process above, some experiment data of Beaver 2 AUV with thruster fault are used, and signal pre-processing is used to extract feature points. Then it needs to check whether the new feature points match any of the generated detectors. If matched, then the specific detector should be adjusted so as to not match the feature points. Otherwise, a new detector should be generated according to the feature points. Now, the mature detectors are finally generated and can be used to detect whether a fault occurs or not.
2. Anomaly detection based on the mature detectors
As for a new tested data, the signal pre-processing is used at first. If setting the tested feature points in a group as C = [c1, c2,…, cn]T and the detectors as D = [d1, d2,…, dm]T, matching test needs to be conducted between C and D. According to Sanchez, 20 the matching rule is selected as the Euclidean distance between the test feature point and any of the detectors. If the Euclidean distance is less than the radius of the detector, then the test point will be treated as fault point. Finally, calculate the number of the fault points, and to reduce the possibility of false alarm, threshold value could be used to determine whether fault occurs or not.
The effectiveness of the developed weak thruster fault detection method will be demonstrated in section “Experiment verification of anomaly detection.”
Experiment verification
To verify the effectiveness of the developed weak thruster fault detection method based on AIS and signal pre-processing, experiments are performed on Beaver 2 AUV. In experiments, different magnitudes of thruster fault are considered, including λ = 0, λ = 0.02, λ = 0.05 and λ = 0.08. To clearly demonstrate the performance of the developed method, comparative experiments are also conducted at these three different stages, including data fusion, feature extraction, and anomaly detection.
Experiment verification of data fusion
In this section, to show the effectiveness of D-S evidence theory and signal transformation in data fusion, comparative experiments are conducted based on D-S evidence theory only.
According to the experimental data (control voltage, longitude velocity, and yaw angle), the fusion result based on D-S evidence theory and signal transformation is presented in Figure 10(a). The comparative result is given in Figure 10(b).
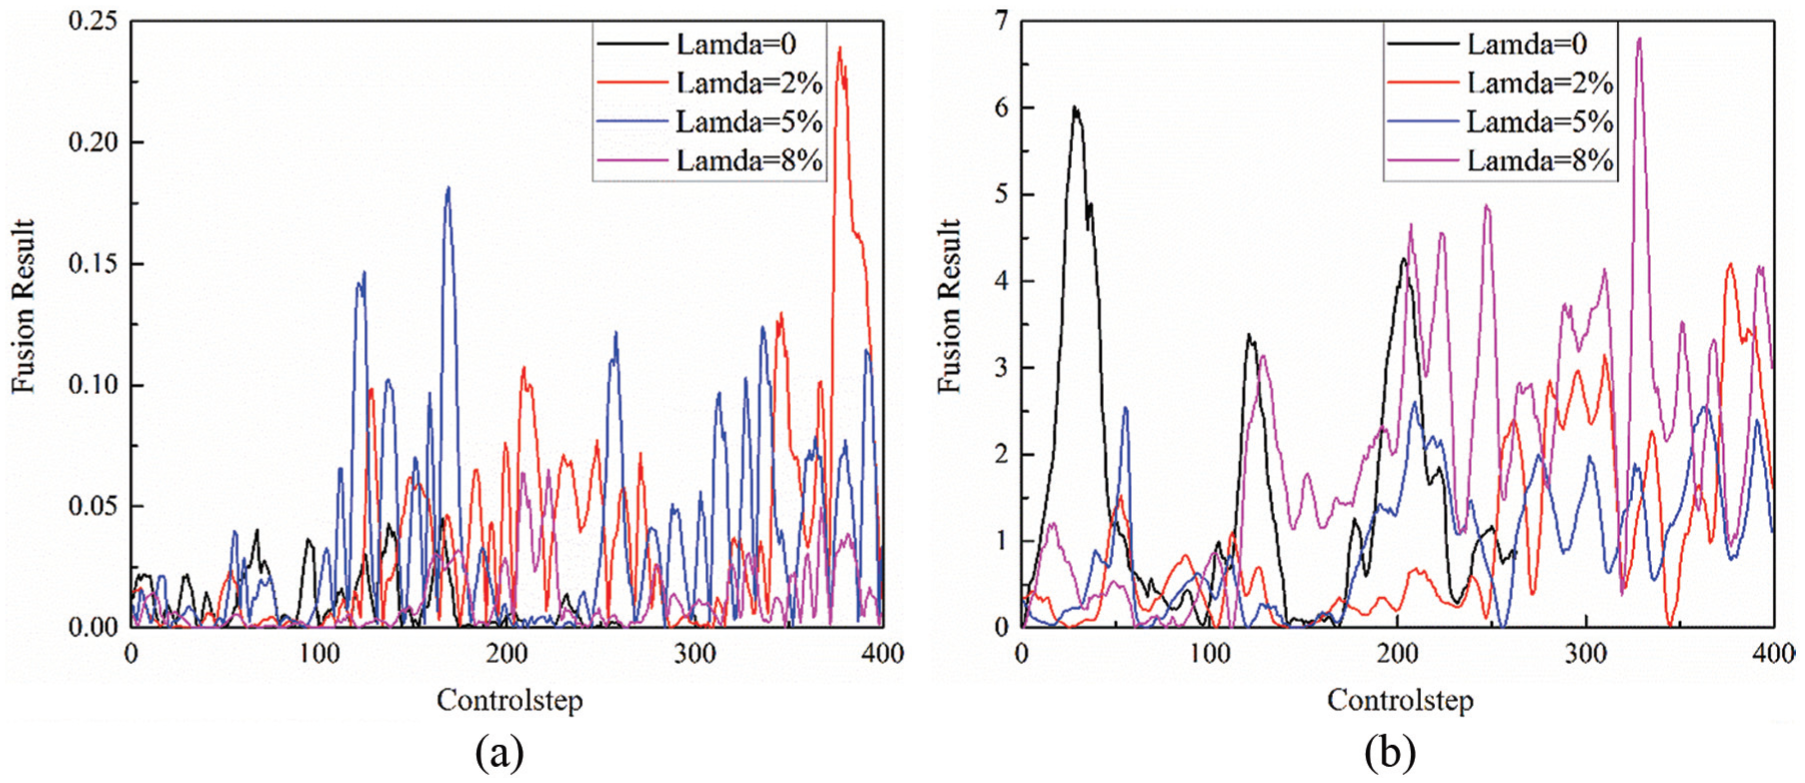
Data fusion results for different magnitudes of thruster fault: (a) results based on the proposed method and (b) results based on the comparative method.
From Figure 10(a), in healthy case, the magnitude of the fused data based on D-S evidence theory and signal transformation is close to zero and its change is also small. It also shows that there are distinctive differences between the fused result in healthy case and that in faulty cases. However, from Figure 10(b), in the healthy case, the magnitude of the fused data based only on D-S evidence theory is changed seriously, and even seriously overlapped with the results of the faulty cases. From Figure 10(b), it is very difficult to distinguish the results between the healthy case and the faulty cases. Although it is not obvious to evaluate the effectiveness of the developed data fusion method in the faulty cases, it would be clearer if we use descriptive statistics of the fused results, including mean value and variance of the fused results. The descriptive statistics are shown in Table 1.
Descriptive statistics of the fusion results for different magnitudes of thruster faults.

From Table 1, it can be seen that the mean and variance of the fused results gradually increase with the increase in the magnitude of the weak thruster fault based on D-S evidence theory and signal transformation, while it is not the case in fused results based on D-S evidence theory only. And we also use a figure to present the relationship between the magnitude of thruster fault and the mean value of the fusion result, shown in Figure 11. From Figure 11, it is found that the relationship obtained from the proposed method is monotonically increasing, while the mapping is not unique in the comparative results.
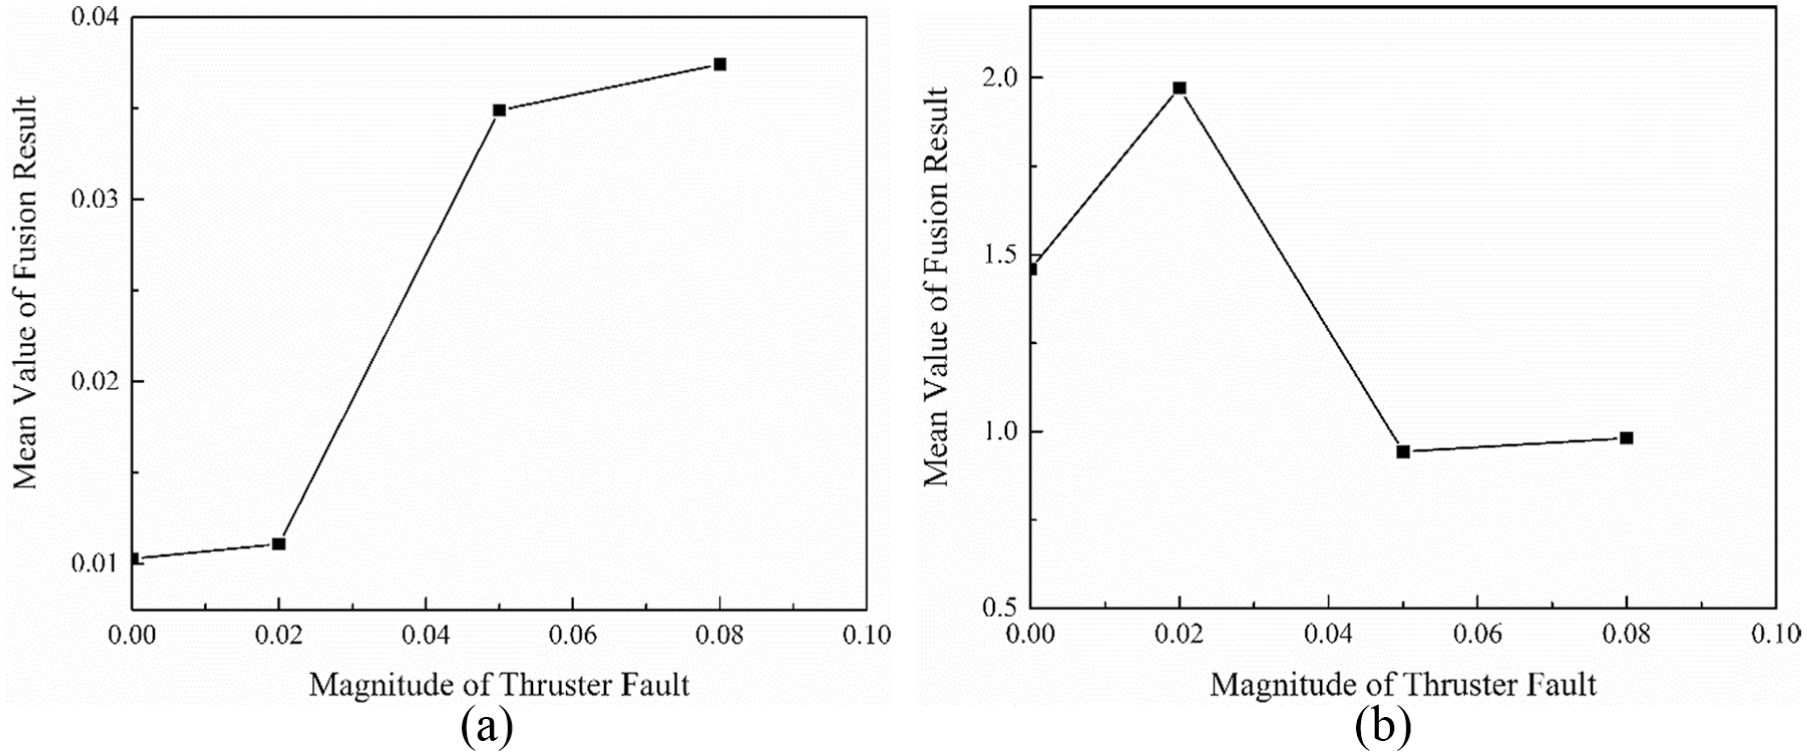
Relationship between the magnitude of thruster fault and the mean value of the fusion result: (a) based on the developed method and (b) based on the comparative method.
According to the experimental results, the effectiveness of the developed method is demonstrated in terms of data fusion, compared with D-S evidence theory without the developed signal transformation. The monotonic relationship result would contribute to the later feature extraction and fault detection.
Experiment verification of feature extraction
To demonstrate the effectiveness of the developed feature extraction method, ISOMAP algorithm with raw signals is used to conduct comparative experiment. The fused signal from AUV’s signals in section “Experiment verification of data fusion” is input to the ISOMAP algorithm, and the feature extraction result is as shown in Figure 12(a), while Figure 12(b) is the result based on ISOMAP algorithm with raw AUV’s signals.

Feature extraction results for different magnitudes of thruster fault: (a) results based on the proposed method and (b) results based on the comparative method.
In feature extraction, as described earlier, phase space reconstruction is required. At this stage, there are two parameters to be determined, embedding dimension and delay time. According to the C-C method, 24 the embedding dimension and delay time are set as 3 and 1, respectively.
From Figure 12(a), based on ISOMAP algorithm and the fused data in section “Experiment verification of data fusion,” the extracted feature points are mainly located close to the origin of the coordinate in the case when all thrusters are healthy. These feature points are gradually distributed from the origin point of the coordinate with increase in magnitude of the weak thruster fault. In this study, the case of λ equal to 0.08 (most serious fault), the distribution area of the feature points is widest. However, from Figure 12(b), the distribution of the feature points is disorder in the case of different magnitudes of the weak thruster fault, and it is difficult to find any rules they would follow. The feature points in the healthy case cover most of those results in the faulty cases. Based on the results in Figure 12(b), it would be very difficult to use AIS to detect the weak thruster fault. The distribution area of the feature points is presented in Table 2.
Distribution area of the feature points.

From Table 2, the distribution area is irregular. The distribution area is 0.00221, 0.00511, 0.04102 and 0.07056, respectively, in the case of λ = 0, λ = 0.02, λ = 0.05, and λ = 0.08, which shows that the distribution area increases when the magnitude of thruster fault becomes larger. Based on the above experimental results, it shows effectiveness of the developed feature extraction method by combining ISOMAP algorithm with fusion algorithm, compared with the result of using only ISOMAP algorithm to extract feature from raw AUV’s signals.
Experiment verification of anomaly detection
To demonstrate the effectiveness of the developed fault detection method for AUV with weak thruster fault, the fault detection method based on artificial immune algorithm in Sanchez 20 is used to be compared.
As mentioned in section “Anomaly detection based on AIS,” in the process of generating self-set, this article uses clustering algorithm in Sanchez 20 to calculate the elements’ radius of the self-set, and after calculation, the maximum radius is 0.15. The initial number of detectors is 5000 and their initial radius is 0.5. In our developed fault detection method, we used the extracted feature points from healthy AUV’s signals to generate self-set and detectors, and the result is shown in Figure 13(a). The self-set and detector-set generated directly based on artificial immune algorithm from raw AUV’s signals are presented in Figure 13(b).

Results of the generated detectors: (a) results based on the developed method and (b) results based on the comparative method.
From Figure 13, after data fusion and feature extraction, the self-set is relatively concentrated based on the artificial immune algorithm, locating around the origin point. Based on the generated detector-set, the fault detection experiments are carried out in different magnitudes of the weak thruster fault. The results are presented in Figure 14, where Figure 14(a) and Figure 14(b) are the results based on our developed fault detection method and the comparative method, respectively. The related data are tabulated in Table 3.

Detection result for different magnitudes of thruster fault: (a) detection results based on the proposed method and (b) detection results based on the comparative method.
Detection results (rs = 0.15).

Here, taking the point that is the center of the self as the center, the article selects a radius, so as to cover at least 95% of the faulty points. The radius is defined as “radius of fault.” From the experimental results (Figure 14 and Table 3), it can be seen that there are three feature points located inside the detectors when the thruster is healthy, and the thruster fault (λ = 0.02) cannot be detected based on the developed fault detection method. It is reasonable that we can select a threshold to avoid false alarm, since the number of the detected feature points in different magnitudes of thruster fault is distinct. However, in the comparative result, the number of the detected feature points is 77 in the condition of healthy thruster, resulting in the detection result of the comparative result being not reliable. Now, according to the results and analysis, it can be concluded that the developed fault detection method is effective for the case where the magnitude of thruster fault is higher than 0.05. In addition, when the thruster fault become more serious, i.e., the magnitude of the thruster fault becomes larger, the parameter “radius of fault” will become larger. In the future, we will research on the thruster fault identification based on the rule.
Conclusion
A novel fault detection method is presented for an AUV with weak thruster fault based on AIS and pre-processing. The experimental result of data fusion shows that the relationship between the mean values of fusion result and its corresponding magnitude of thruster fault is unique, after the developed data fusion method based on the combination of D-S evidence theory and signal transformation. The experimental result of feature extraction shows that the developed method can make the extracted feature in different magnitudes of thruster fault more distinct and its distribution more regular. In addition, the experimental result of fault detection shows that the proposed method has a more reliable detection result and is effective for the thruster fault larger than 0.05. In future research, the authors will investigate on weak thruster fault identification method based on “radius of fault” mentioned in section “Experiment verification of anomaly detection,” since the authors find that the when the thruster fault become more serious i.e., the magnitude of the thruster fault becomes larger, the parameter “radius of fault” will become larger.
Footnotes
Handling Editor: Shun-Feng Su
Declaration of conflicting interests
The author(s) declared no potential conflicts of interest with respect to the research, authorship, and/or publication of this article.
Funding
The author(s) disclosed receipt of the following financial support for the research, authorship, and/or publication of this article: This work was supported by the National Natural Science Foundation of China (grant no. 51679054) and National Key R&D Program of China (grant no. 2017YFC0305703).