
Abstract
To obtain accurate computer numerical control lathe cutting force signals and improve the precision of load stress cycle statistic, an improved multi-wavelet denoising with neighboring coefficients method is proposed. First, statistical variance smoothing is applied to remove the singular points in the original signal. The processed signal is then denoised with the multi-wavelet with neighboring coefficients method. Second, based on the change laws of the correlation dimension and the values of Brock, Dechert, Scheinkman statistic of load signal, reasonable decomposition levels of the multi-wavelet and the length of neighboring coefficients are used. Third, four synthetic signals with different signal-to-noise ratios are denoised with the wavelet threshold denoising method and improved multi-wavelet denoising with neighboring coefficients. Then, the difference between the values of correlation dimension and Brock, Dechert, Scheinkman statistic in the original and denoised signals is analyzed. Meanwhile, its validity is further verified with the signal-to-noise ratio and mean square error. The results show that the improved multi-wavelet denoising with neighboring coefficients is better than wavelet threshold. Finally, turning force signals are denoised by wavelet threshold and improved multi-wavelet denoising with neighboring coefficients. Comparison result shows that the improved multi-wavelet denoising with neighboring coefficients can not only remain largely low-frequency signal energy and suppress high-frequency noise signals effectively but also improve the accuracy of load stress cycle statistic.
Keywords
Introduction
Load spectrum is the load-time history of a product, and it reflects the law of load variation with time. The load spectrum of computer numerical control (CNC) machine tools is the basis of reliability design, reliability test, and life prediction.1–5 The primary objective of compiling the load spectrum is to obtain accurate load data. However, load signals are susceptible to subjects outside interference in load measuring experiments, such as electromagnetic signals of CNC machine tools, environmental noise, and cutting fluid jet.6–8 These inevitably lead to the generation of several noise signals and singular points in the original signals, so it must be more random in load signals. Therefore, reasonable denoising is necessary for load signals. Otherwise, the accuracy of the load spectrum of CNC machine tools would be significantly affected. The load signal is large, and its signal-to-noise ratio (SNR) is high in the process of rough cutting. However, in precision and high-speed cutting, the load signal is typically very small. As a result, the SNR is relatively low (SNR < 10 dB). Denoising for signals with a low SNR is difficult.6,9
Wavelet threshold (WT) denoising techniques have been widely utilized in signal processing fields. 10 However, scalar wavelets cannot present orthogonality, symmetry, compact support, and high order of vanishing moments simultaneously. 11 Therefore, researchers pay more attention to multi-wavelet research. Alpert 12 proposed multi-wavelet processing when solving polynomial problems. The GHM (Geronimo, Hardin, and Massopust) multi-wavelet was developed by Geronimo, Hardin, and Massopust. Given that a multi-wavelet has multiple scaling and wavelet functions, it can match different signal feature information from different angles. Thus, multi-wavelet not only retains the advantages of scalar wavelet but also overcomes its defects. 13 Thus, multi-wavelet presents several obvious advantages in signal denoising, image processing, identification of tool wear, and mechanical fault diagnosis.9,14–17 In multi-wavelet denoising, Strela et al. 18 introduced the scalar WT into the multi-WT and proposed a multi-scalar WT denoising method. Downie and Silverman 19 considered the correlation among multi-wavelet vector coefficients and proposed a multi-wavelet vector hard and soft threshold denoising method. To et al. 20 proposed a signal filtering method based on multi-wavelet noise variance threshold. Hsung et al. 21 proposed a multi-WT denoising method in which the threshold was selected through the optimal threshold method.
However, the following problems occur in the conventional multi-wavelet denoising process. First, the Gibbs phenomenon occurs near the singular points of the denoised signal.22–24 Second, the correlation between wavelet coefficients and their neighboring coefficients is disregarded. 25 Third, whether the wavelet function, preprocessing method, and decomposition levels of the multi-wavelet selected are reasonable also affect the denoising effect. 9
To eliminate the Gibbs phenomenon effectively, Yuan et al. 14 and Bui and Chen 22 extended translation-invariant method to denoising processing, and the time-domain position of the singular point was changed effectively. Zhu et al. 23 and Li et al. 24 used wavelet transform or the statistical variance smoothing method to detect and remove singular points.
To consider the correlation among neighboring wavelet coefficients, Chen and Bui 25 introduced scalar wavelet denoising, considered the neighboring coefficients in the multi-wavelet, and proposed a multi-wavelet denoising method with neighboring coefficients. Wang et al. 11 presented GHM multi-wavelet-based neighboring coefficients that are dependent on level method, which has reasonable neighbors and thresholds at each multi-wavelet decomposition level. Chen et al. 15 further improved the existing neighboring coefficient threshold rule by considering the intra-scale and inter-scale dependencies of multi-wavelet decomposed coefficients. Yuan et al. 14 introduced neighboring coefficient denoising into translation-invariant multi-wavelets, and translation-invariant multi-wavelet denoising with neighboring coefficients was applied to the diagnosis of a gear box and a locomotive rolling bearing.
According to the feature of the load signal of CNC machine tools, an improved multi-wavelet denoising with neighboring coefficients (IM-NC) method was proposed in this study. First, statistical variance smoothing method was utilized to remove the singular points, and the processed signal was denoised through multi-wavelet neighboring coefficient method. Second, based on the change laws of correlation dimension (CD) and the values of the BDS (Brock, Dechert, Scheinkman) statistic of the load signal, reasonable decomposition levels of multi-wavelet and the length of neighboring coefficients were used. Finally, four synthetic signals and cutting face signals of CNC lathes were denoised by WT and IM-NC, respectively. A comparative analysis was conducted from the time-domain waveform, frequency-domain energy, and rain-domain damage aspects.
Theory and method
Experimental setup and summary of noise
By analyzing the cutting face in turning, the cutting force can be decomposed into three-directional component forces (axial, main cutting, and radial forces). As shown in Figure 1, a good-performance, high-stability Kistler dynamometer (Type: 9129AA) 26 was used in the cutting experiment. The measured signals were inputted into a computer through the charge amplifier (Type: 5070A) and the data acquisition system (Type: 5697A).

Cutting force measuring system.
In the process of measuring dynamic turning force, the measured signals are easily disturbed by various noises, such as electromagnetic noise, mechanical noise, hydraulic noise, aerodynamic noise, cutting fluid jet, and environment noise. Electromagnetic noise is mainly caused by the motor inverter in the spindle and feed system. The sinusoidal pulse width modulation control signal is generated in the inverter process, and this signal is a steep edge of the pulse signal and produces strong electromagnetic interference. Mechanical noise occurs from the friction or collisions in the contact area when rolling bearings, couplings, and other transmission parts present gap or processing errors. Hydraulic noise is mainly due to the oscillation close to the pump mouth and the vibration of the relief valve when the hydraulic pump outputs pulse hydraulic oil. Aerodynamic noise is mainly from the motor cooling fan and air conditioning. The fixing position and pressure of the jet of the cutting fluid in the cutting process also exert a certain influence on the measurement. Mika and Józwik 27 showed that the intensity of noise generated in CNC machine tools during operation can generally reach 70–88 dB and sometimes even 104 dB.
Multi-wavelet theory
Multi-wavelet theory extends the multi-resolution analysis that is generated by a single scaling function in a single wavelet to multiple scaling functions.9,14,15 The multiple scaling function is Ф(t) = [φ1(t), φ2(t), …, φr(t)] T , and the corresponding multi-wavelet function is Ψ(t) = [ψ1(t), ψ2(t), …, ψr(t)] T , where T denotes the transpose. In the scalar case, they satisfy two-scale refinement equations as follows


where Hk and Gk are r × r matrix low-pass and high-pass filters. In the frequency domain, equation (2) is
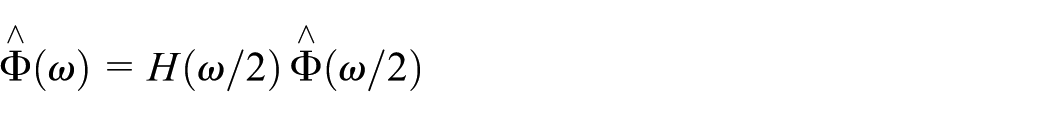

where H(ω) and G(ω) are two-scale refinement symbols corresponding to Ф(t) and Ψ(t)

The multi-wavelet decomposition of signal x(t) can be obtained with the Mallat algorithm as follows


where Cj – 1(k), Dj – 1(k) are r dimension vectors of low-frequency and high-frequency coefficients. The decomposed signal can be reconstructed from the multi-wavelet coefficients using the synthesis equation

where
Multi-wavelet filter coefficients are r × r matrices that need an r dimension vector input. However, the load signal of CNC lathes is a one-dimensional (1D) data sequence. Thus, the input signal x(n) needs to be preprocessed before decomposition, and the output signal must be post-processed after reconstruction. 9 Two common methods are generally used to preprocess the input signal. One is an oversampling scheme, and the other is a critical sampling scheme. The effectiveness of oversampling representations when GHM is selected as multiple scaling functions and multi-wavelets has been proven.9,15
CD
CD is utilized to describe the characteristic quantity of a signal that is non-stationary and even random. It is sensitive to noise. Thus, CD is used to determine whether a signal contains noise.24,28–30
The actual time-domain load signal of CNC lathe is a 1D time-domain signal that cannot reflect multi-dimensional information effectively. Thus, for a given time series x(t) (t = 1, …, N), according to the theory of phase space reconstruction by time delay technology, 31 the phase point of phase space Rm of m-dimensional reconstruction can be obtained. The reconstructed phase space is

where m is the embedding dimension, τ is the delay time, t = 1, 2, …, Nm, and Nm is the total number of phase point of phase space Nm = N – (m – 1)τ.
CD is expressed as a function of the embeddingm-dimension as follows

where C(m, N, r) is the correlation integral in the reconstructed attractor D(m, N, r); its expression is
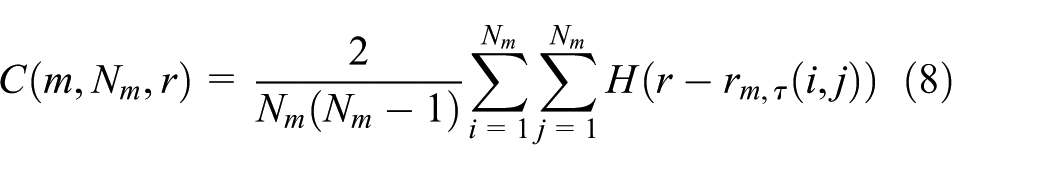
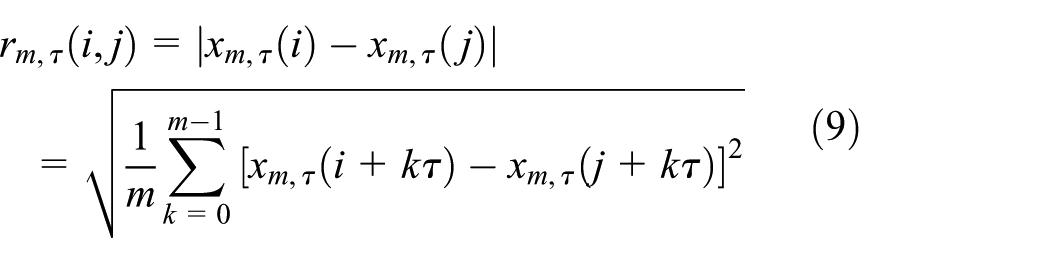
where r is the effective radius of rm,τ(i, j) and H(.) is the Heaviside function. 32 The expression of latter is

Draw a scale line log r – log C(m, Nm, r), its slope is the CD of the one-dimensional cutting load sequence x(t).
BDS statistic
The correlation integral (equation (9)) represents the ratio of the distance between two points being not more than r to the number of all two points in a time series (set of phase points); thus, it is a measure of the degree of spatial correlation. 31
If Nm→∞, each r satisfies
If the data are generated through a strictly stationary stochastic process that is absolutely regular, then this limit exists. 31 In this case, the limit is as follows
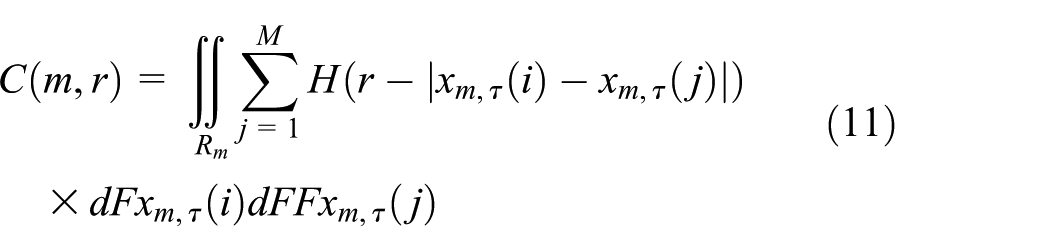
When {Xm,τ(t)} is an IID sequence, then C(m, r) =C(m, r) m .
Then, BDS statistic is

where

IM-NC
Given that the correlation between wavelet coefficients and their neighboring coefficients is disregarded in the process of traditional WT denoising and multi-wavelet denoising, the analysis results cannot fully reflect the characteristics of the signal. The threshold of multi-wavelets neighboring coefficient denoising is determined by several neighboring coefficients for an improved denoising effect.
Different from the scale wavelet transform method, multi-sequences of two-dimensional (2D) wavelet coefficients and a sequence of 2D scaling coefficients can be obtained through multi-wavelet transform. Suppose that Dj(k) represents the j-level and kth multi-dimensional wavelet coefficients obtained by the multi-wavelet transform method and meets

where
At the same time,
The detailed procedures of improved multi-wavelet denoising method with neighboring coefficients are as follows:
1. Remove the singular points of the original signal x(n) with statistical variance smoothing method. 24
2. Using the GHM wavelet function, preprocess the signal x′(n) whose singular points have been removed.
3. Use equation (4) to decompose the preprocessed signal into p-levels (initially p = 2) by multi-wavelet to obtain the scaling coefficients and wavelet coefficients.
4. Estimate the matrix Vj with a robust covariance estimation approach9,25 based on the observed transform coefficients. The processes are as follows:
Define: mad(y)=1.4826×median(abs(y–median (y))),
a 1 = 1/mad(row1),
a 2 = 1/mad(row2),
b 1 = mad(a1row1 + a2row2),
b 2 = mad(a1row1-a2row2)
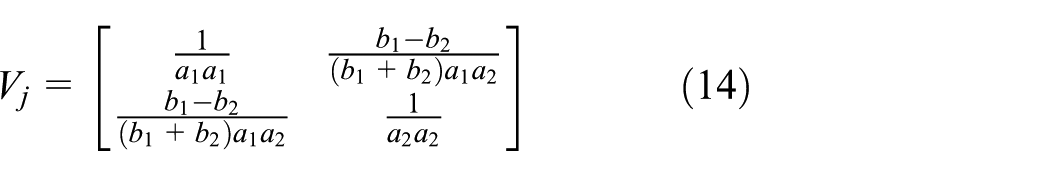
where row1 and row2 denote the first and second rows of multi-wavelet coefficients, respectively.
5. Calculate θj(k) using
6. Neighboring coefficients are incorporated as
7.
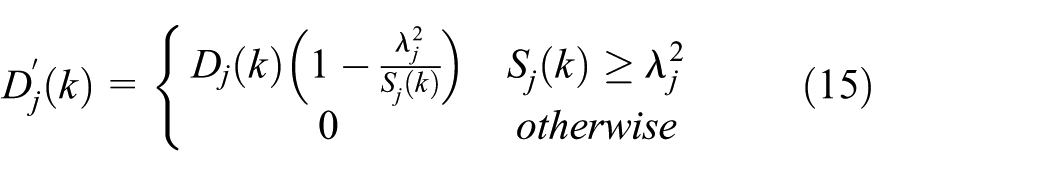
where λj = 2logN 31 and N is the length of the multi-wavelet coefficients.
8. Reconstruct the denoised decomposition coefficients with equation (5), and post-process them to acquire the denoised signal.
9. Reconstruct the denoised signal in phase space and obtain the change law of CD with the addition of embedding dimensions and the value of BDS statistic of the denoised signal. Afterward, proceed to step 6, increase the length of the neighboring coefficients (q = q + 1), and calculate the value of CD and BDS statistic again. Then, compare these results with the previous ones; if the current results are better, proceed to step 6 and increase the value of q until the most optimal CD and BDS statistic are obtained.
10. Proceed to step 3, increase the number of wavelet decomposition levels (p = p + 1), and implement steps 3 to 9. The optimal CD and BDS statistic of the decomposition level are obtained.
11. The optimal CD and BDS statistic are chosen as the final denoising results.
Synthetic signal analysis
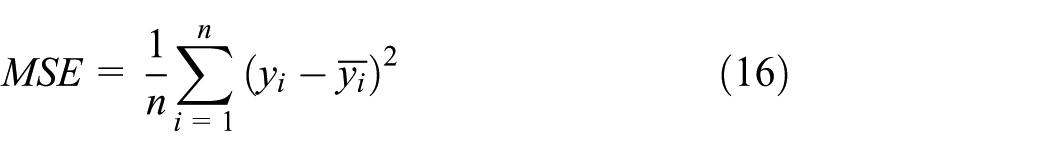
Four types of synthetic signals were analyzed to verify the performance of the proposed method. The four types of synthetic signals are bumps, blocks, Doppler, and heavy sine. These signals were analyzed by superposing white noise with different SNRs (1, 2.5, 5, 7.5, 10, 12.5, and 15 dB), which were processed by WT denoising and IM-NC. Then, the denoising effects of these two methods were compared with four important assessment indicators, namely, CD, BDS statistic, SNR, and mean square error (MSE). SNR and MSE are expressed as equation (16). In Figure 2, synthetic noisy signals with SNR 7.5 and 15 dB are represented by a pink line and a blue line, respectively. The length of each synthetic signal is 2048 units of time


Four synthetic signals before and after IM-NC denoising.
The threshold of WT denoising was selected through the adaptive threshold Stein unbiased risk method. Aiming at synthetic noisy signals with different SNRs, reasonable wavelet functions were used by comparing the influence of different wavelet functions (db1, db3, db5, db7, haar, and sym4) on the results. When the synthetic signal is bumps, the best wavelet function of hard threshold denoising is db3 (7.5 dB) and db1 (15 dB), and the best wavelet function of wavelet soft threshold denoising is db3 (7.5 dB) and db1 (15 dB), and so on. Based on the change laws of CD and the values of the BDS statistic of the synthetic signal, reasonable decomposition levels of multi-wavelet and length of neighboring coefficients were used, namely, three neighboring coefficients (p = 1) and two-level (q = 2). For the blocks synthetic signal, the reasonable length of the neighboring coefficients and multi-wavelet decomposition levels of IM-NC are five neighboring coefficients (p = 2) and two-level (q = 2). For the Doppler and heavy sine synthetic signals, the reasonable length of neighboring coefficients and multi-wavelet decomposition levels of IM-NC are five neighboring coefficients (p = 2) and two-level (q = 2).
To investigate the relationship between noise signals and their CD, the CD with embedding dimensions from 2 to 40 of the four synthetic noisy signals with different SNRs was calculated. In Figure 3, synthetic signals without noise are represented by a black line, and synthetic noisy signals with different SNR are represented by -*- lines. In Figure 3, the volatility of the CD of synthetic noisy signals becomes increasingly intense as the embedding dimension increases; the SNR of noisy signals decreases. However, the CD of synthetic signals without noise does not change. Therefore, the influence of noise on the CD of the signals is orderly. In Figure 3, the blue and red solid lines indicate the CD of the denoised synthetic noisy signals (SNR = 7.5 dB) with WT denoising and IM-NC, respectively. The CD of denoised signals with IM-NC is smaller than the CD of denoised signals with WT denoising, which is close to the CD of the signal without noise.

CD with added embedding dimensions of four synthetic noisy signals with different SNRs.
To examine the relationship between noisy signals and their BDS statistic, the BDS statistic (the embedding dimensions is 5 33 ) of the four synthetic noisy signals with different SNRs was calculated. As shown in the left side of Table 1, the BDS statistic increases as SNR increases. For a better comparison of the denoising effect of different denoising methods, the BDS statistic of synthetic noisy signals (whose SNR are 7.5 and 15 dB) and their denoised signals obtained by the WT (hard and soft) denoising method and IM-NC method were calculated. As shown in the right side of Table 1, the BDS statistic of the denoised signal with IM-NC is larger than that of the denoised signal with WT. Therefore, the denoising effect of IM-NC is better than WT.
BDS statistic values of the four synthetic signals.

Bold indicates the best BDS value. BDS: Brock, Dechert, Scheinkman; IM-NC: improved multi-wavelet denoising with neighboring coefficients.
The values of SNR and MSE of the denoised signals, which were obtained with the WT (hard and soft) denoising, and IM-NC, were calculated. As shown in Table 2, the SNR values of the denoised signal obtained with the IM-NC method are larger than the ones obtained with the WT denoising method. The MSE values of denoised signal obtained with IM-NC are smaller than the ones obtained with the WT denoising. Therefore, the denoising method proposed in this study was verified to be better than the WT denoising. The result also verifies that using the CD and BDS statistic to judge the denoising effect is rational.
SNR and MSE values of denoising of the synthetic signals.

Bold indicates the best SNR value or MSE value. SNR: signal-to-noise ratio; MSE: mean square error; IM-NC: improved multi-wavelet denoising with neighboring coefficients.
Case analysis
Cutting force measurement experiments were conducted with the cutting force measuring system set up in section “Experimental setup and summary of noise.” The cutting parameters are provided in Table 3, which are selected from a large number of machining parameters acquired in user field. The actual three-direction cutting force obtained from the experiments was processed with the WT denoising method and IM-NC. The results were compared from three aspects: time-domain waveform, frequency-domain energy, and rain flow-domain damage.
Cutting parameters.

Time-domain waveform comparison
The time-domain waveform results of the original and denoised signals obtained with IM-NC are shown in Figure 4. The denoising effect of IM-NC is obvious, it does not only contain the basic outline and tendencies of the noisy signal but also filters most of the minor fluctuations caused by noise. The denoising effect of the WT denoising method is not obvious, and the result has minimal difference from the original signal. As shown in Figure 5 and Table 4, the values of CD and BDS statistic are generally unchanged after WT denoising. However, the values of CD are stable with the addition of embedding dimensions. The values of BDS statistic increased after denoising with IM-NC. Thus, the proposed denoising method is more effective.

Time-domain waveform of three direction cutting force before and after IM-NC denoising.
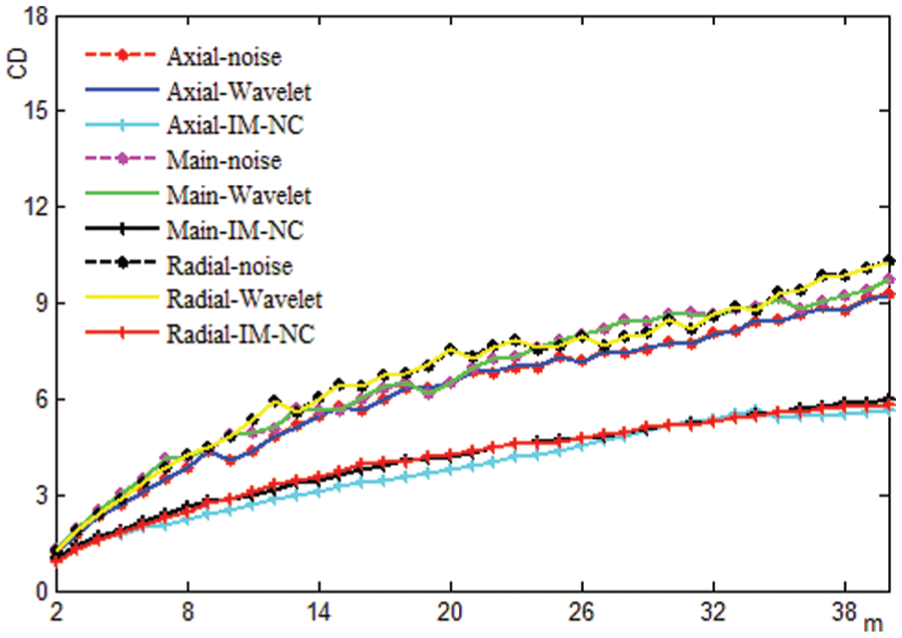
CD values for the data series in each case.
BDS statistic values in each case.

BDS: Brock, Dechert, Scheinkman; IM-NC: improved multi-wavelet denoising with neighboring coefficients.
Frequency-domain energy comparison
Power spectral density pertains to the power carried by per unit of frequency wave. The classic periodogram method was utilized to estimate the power spectral density of the original and denoised signals. The results are presented in Figure 6, in which the power spectral density of the original and denoised signals is represented by red and blue lines, respectively. The main power of the denoised signal is reserved within 100 Hz and high-frequency noise, which is more than 100 Hz and is suppressed effectively. Thus, the denoised signal can be the basis of the compilation of the CNC lathe load spectrum.

Periodogram power spectral density estimate.
Rain flow-domain damage comparison
One of the key steps in the compilation load spectrum is obtaining the combination coefficients of different typical conditions depending on the calculation of damage values. Damage values can be obtained with the rain-flow method. However, the noise can produce false stress cycles, which will produce pseudo damage value.
The number of stress cycles is an important indicator in the evaluation of fatigue life. The rain-flow cycle statistics of the original and denoised signals are shown in Figure 7. Several fatigue cycles composed of small amplitudes and means are filtered, and several fatigue cycles composed of small means are reduced in Figure 7. For convincing comparison, the nominal fatigue cumulative damage of each load spectrum were normalized by the S-N curve. The fatigue cumulative damage was divided into five parts according to the amplitude value of cutting force (axial cutting force, main cutting force, radial cutting force), and the proportion of the damage of each part to all the damage, respectively, is calculated. Table 5 shows that the ratio of damage of the five parts changes before denoising and after denoising. Noise exerts a significant effect on the calculation of fatigue damage. If the noise cannot be reduced effectively, the modeling accuracy of the load spectrum would be affected. The actual fatigue cycles can be retained after IM-NC denoising.

“From-to” counting matrix of the original and denoised signals.
Rate of pseudo-damage after denoising.
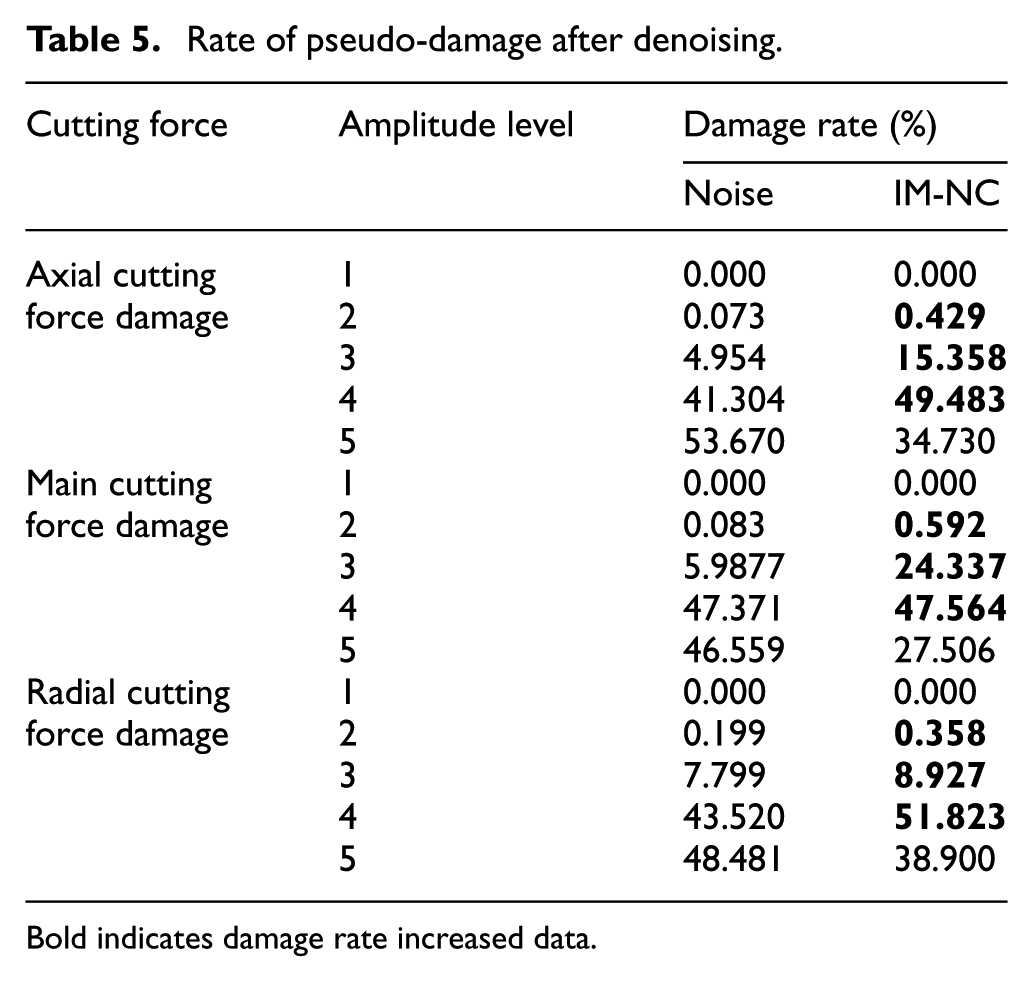
Bold indicates damage rate increased data.
Conclusion
Dynamic cutting signals are susceptible to subjects outside interference in load measuring experiments. In order to obtain accurate CNC lathe cutting force signals and improve the precision of load stress cycle statistic, an IM-NC method is proposed, according to the feature of the cutting force signal and the source of noise. The CD variation of the embedding dimension and the values of BDS statistic were calculated to select the reasonable length of the neighboring coefficients and the multi-wavelet decomposition levels.
Four synthetic noisy signals with different SNRs (1, 2.5, 5, 7.5, 10, 12.5, and 15 dB) were processed by WT and IM-NC. The values of CD and BDS statistic of the denoised signal were calculated. The CD and BDS statistics values of the denoising signal with IM-NC were obviously better than WT denoising, and the SNR and MSE were utilized to verify the effect of denoising. The results verified the validity of the proposed method.
The proposed method was applied to denoise CNC lathe dynamic cutting force signals. The denoised signals of WT denoising and IM-NC were compared from three aspects: time-domain waveform, frequency-domain energy, and rain flow-domain damage. The comparison results showed that the denoised signal could maintain main energy within 100 Hz and high-frequency noise signals were suppressed effectively. In addition, the stress cycle statistical accuracy was improved. Therefore, the proposed denoising method can be used as a pre-analysis approach for the CNC lathe load spectrum and provides a new means of dynamic cutting force signal denoising.
Footnotes
Handling Editor: Hiroshi Noguchi
Declaration of conflicting interests
The author(s) declared no potential conflicts of interest with respect to the research, authorship, and/or publication of this article.
Funding
The author(s) disclosed receipt of the following financial support for the research, authorship, and/or publication of this article: This work was supported by National Natural Science Foundation of China: Key technology research on multi-degree of freedom dynamic load spectrum under complicated operating conditions (Grant No. 51505186), Doctoral Fund of Ministry of Education of China (Grant No. 2017M621204), and Science Research Plan of Jilin Province: Compilation method of dynamic load Spectrum of CNC lathes and application in the reliability test of key component (Grant No. (2016) 414).