
Abstract
Recently, interior noise levels of passenger cars have been significantly reduced. The reduction of major cabin noise led to the recognition of small noises that are previously unnoticed. Specifically, the button noises of electrical devices in passenger compartments have been identified as belonging to this category of noise. The aim of this study is to improve the auditory quality of a car audio button while maintaining its tactile quality that is familiar to users. The tactile and auditory qualities can be described by the load versus stroke characteristics and the operation noise level. For buttons with rubber domes, the buckling behavior of the domes governs the tactile and auditory qualities. To preserve the tactile quality, the sensitivity of load versus stroke characteristics to each of the eight identified parameters is obtained from the finite element analyses using model parameters varied by ±10%. Four parameters to which the tactile quality was insensitive are selected. To identify the contributions of these four design parameters to auditory quality, finite element analyses were performed in conjunction with design of experiments. The improved design obtained by the subsequent response surface methodology optimization was validated by a prototype test with a 12 dBA reduction in noise.
Keywords
Introduction
Automobiles are rated by safety, performance, comfort, and fuel economy. Comfort includes ride, noise, controls, display, cabin access, interior fit, interior finish, and cargo space. Many studies have been conducted to investigate the noise inside the cabin, including the optimization of beads in the body panels to reduce the noise transmitted from the power train, 1 an evaluation of the noise characteristics of a car air conditioner, 2 a method for increasing the sound quality during acceleration, 3 an investigation of auditory impressions during driving, 4 and evaluations of the noise quality of premium-class passenger cars 5 and the sound quality of automobile power windows. 6 With the technical progress in the field of noise vibration harshness, small sounds, such as audio-button clicking, became far more noticeable. For vehicles with higher ergonomic qualities, requests for quieter buttons are becoming increasingly common for car audio systems. The noise from a car audio button consists of a push clicking sound and a release rebounding sound. The former is more prominent in most cases. Car audio buttons are expected to satisfy a certain tactile quality that cannot be compromised. Under this constraint, reducing the button noise can be a difficult task.
Most audio buttons employ a rubber-dome substructure to satisfy the tactile-quality requirements. The rubber dome can be designed to buckle in a way that is suitable for human tactile satisfaction during its operation. In many patents, buttons with a rubber dome have been developed for keyboard key switches, 7 automobile power-window switches, 8 two-stage switches, 9 and so on.
Rubber dome is one of the most essential parts within the button assembly and thus its design is expected to have significant effects on the ergonomic feature of the button. However, studies on the dynamic behavior of silicone rubber-dome buttons are very rare. Bufton et al. 10 studied the typing force for various keyboards and tried to find the type of keyboard with less fatigue and discomfort. Lee et al. 11 studied the effects of computer keyboard force–stroke characteristics on the typing force using electromyography (EMG) sensor in order to reduce dynamic loading of the muscles. Gerard et al. 12 studied the relationship between the typing force and auditory feedback.
Herein, a systematic approach using finite element method and response surface methodology (RSM) is proposed for reducing the noise of rubber-dome-type audio buttons under the constraint of the tactile quality. It is assumed that the clicking noise can be characterized by the combined kinetic energy of the button and the rubber dome at the end of the push stroke. Moreover, the tactile-quality constraint is defined in terms of the upper and lower envelopes of the rubber-dome force–stroke curves. According to these premises, a set of key parameters governing the tactile quality are identified. The rest of the parameters are selected to minimize the noise with respect to a reference design of insufficient auditory quality.
Dome type button
Structure
A car audio button consists of a button case, a button, a rubber dome, and a printed circuit board (PCB), as shown in Figure 1. When the button is pushed, the rubber dome buckles and collides with the PCB. The impact energy of the button and the rubber dome is converted into acoustic energy during the collision. The impact energy is related to the acceleration characteristics that depend on how the rubber dome buckles during the push stroke. Therefore, the sound level changes with the shape of the rubber dome.

Sectional view of a car audio button. The button housed in a case is supported by a rubber dome mounted on a printed circuit board (PCB).
Tactile response
According to the studies on keyboards conducted by Lee et al., 11 the tactile response may be assessed with respect to the reaction force measured while the button is pressed at a constant velocity. Figure 2 shows an apparatus for measuring the reaction force for rubber domes. It consists of a desktop force tester (Aikoh Engineering 1305VC) and a force analyzer (Aikoh Engineering FA1015A). This force analyzer has resolution of 0.001 N. The force tester pushes the rubber dome at 10 mm/s while the force analyzer records and displays the reaction force. Figure 3 shows four force–stroke curves for each of the rubber domes from the car audio buttons under study. All four samples shown in Figure 3 satisfy the tactile-quality standard. For the samples, as shown in Figure 3, the upper and lower envelopes of the force–stroke curves can be defined as illustrated by hatches in Figure 3. These envelopes define the upper and lower limits of the reaction force for any given value of the stroke. As long as the force–stroke curve remains in the shaded zone for a rubber dome, the button complies with the tactile-quality standard.

Apparatus for measuring force–stroke curves. The desktop force tester pushes the rubber dome, while the force analyzer records and displays the reaction force.

Force–stroke curves of the original car audio buttons. The hatched area indicates the region between the upper and lower envelopes.
Noise
The noise from a car audio button consists of a push clicking sound and a release rebounding sound. The former is more prominent in most cases; hence, the latter is ignored in this work. The noise level was monitored in an anechoic room during the push stroke of a button. Figure 4 shows the experimental setup for measuring the noise level. This setup consists of a microphone, a silent button operator, and a car audio button. The microphone was placed 100 mm away from the button. The silent button operator includes a button driver enclosed in an acoustic insulation case, as shown in Figure 5(a). The driver employs a button pusher mounted on a compression spring. The spring is driven by a set of nut and screw with a direct-current motor, as shown in Figure 5(b). Figure 6 shows the measured noise level of the car audio button under study.

Apparatus for measuring the noise level in an anechoic room. The silent button operator pushes the car audio button while the microphone measures the noise during the operation.

Silent button operator (Figure 4): (a) assembly and (b) button driver. For silent operation, acoustic insulation was employed.
Noise level of a car audio button during a push stroke. The maximum value reached 59 dBA.
Finite element model of the rubber dome
To evaluate the tactile response and the noise level, finite element analysis (FEA) was performed with ABAQUS. 13 The rubber dome made of silicone rubber was represented by the Mooney–Rivlin hyperelastic material model. The strain energy of a Mooney–Rivlin material is expressed as

Here, U is the strain energy, and C10, C01, and D1 are material parameters. The last term represents the effect of thermal expansion. It is assumed that the temperature change of the button for room temperature operation is minimal and the last term in equation (1) can be ignored. I1 and I2 are the first and second deviatoric strain invariants, which are defined as
with respect to the deviatoric principal stretches

Stress–strain curves for the rubber-dome material. Three types of tests were performed.
Mooney–Rivlin parameters.


Finite element model of the button assembly. The axisymmetric model includes 1134 four-node solid elements (CAX4, ABAQUS).
The friction coefficients for the contacts among the button, dome, and PCB were measured, as listed in Table 2. The desktop force tester shown in Figure 2 pushes the button at a constant speed of 10 mm/s. In compliance with the apparatus, the same constant speed is specified to the button in the FEA while the PCB is fixed. A button assembly of a reference design was used in the FEA for validation of the finite element model. Figure 9 shows the force–stroke curve predicted by FEA for the reference design.
Friction coefficients of contact interfaces.

PCB: printed circuit board.

Force–stroke curve predicted by the FE model for a button assembly of the reference design. The dashed and dotted curves represent upper and lower envelopes obtained from test data for a number of audio button samples.
When the button is pressed, the rubber dome buckles and collides with the PCB. The push button noise is a result of a complex interaction between the button, rubber dome, PCB, and the housing structure. It is assumed that the combined momentum of the button and the dome head (Figure 1) plays a major role in this process. During the audio button operation by a human finger (mostly by the index finger), the contact force is increased until the moment of rubber-dome buckling. The post-buckling behavior of the finger and button combination is unclear. It is believed that the finger and button are subjected to a complex mutual dynamic interaction until the point of impact. The silent button operator shown in Figure 5 was designed to apply a monotonically increasing load to the car audio button up to the point of dome buckling. Once the buckling is initiated, the button is further driven by elastic energy stored in the spring. For consistency with the silent button operator, a force that increases linearly with time is applied to the button for the prediction of the post-buckling behavior of the button and rubber dome by FEA.
To compare the noise levels for various design candidates, the combined momentum change of the button and rubber dome immediately before and after impact with the PCB is adopted as an indicator. Here, it is assumed that the momentum change may be represented by the change in the velocity ΔV of the rubber-dome head with respect to the PCB.
Optimizations of the dome design
Tactile quality and dome geometry
Figure 10 shows eight design parameters of the rubber-dome structure:
Eight design parameters of the rubber-dome structure.
Figure 11 shows the results of the FEAs. The tactile load exceeds the upper envelope or falls below the lower envelope for ±10% variations in each of the four parameters:

Influence of design parameters on the force–stroke curves of rubber dome: (a) Dh, (b)
Parameters for noise reduction
To analyze the contributions of the four changeable design parameters, Dh, Tb, Ds, and Hh, to the velocity change ΔV, an L8 (27) orthogonal array was used. The values of the reference design parameters are referred to as level 1, and the values changed by 10% level 1 are referred to as level 2; the 10% change was either positive or negative in order to reduce the mass of the rubber dome. The parameter values at the two levels are listed in Table 3. The velocity changes obtained with FEAs for the L8 (27) orthogonal array are listed in Table 4. The contributions of each parameter to the velocity change are shown in Figure 12. Tb and Hh were confirmed to be the major parameters affecting the velocity change.
Design parameters for DOE.

DOE: design of experiments.
FEA results for the L8 (27) orthogonal array.

FEA: finite element analysis.
Mean-value analysis of the design parameters.
Optimization with RSM
RSM 14 was used to determine the optimal values of the design parameters for the minimal velocity change (ΔV). The level 1 and level 2 values of Tb and Hh from the design of experiments (DOE) were used in models 1–4 of first-order RSM. Level 2 of Ds and level 1 of Dh from run 2 in Table 4 were used in models 1–4, as they exhibited minimal effects on the velocity change. The resulting values for ΔV are shown in Table 5, which were used in first-order RSM to obtain equation (3) describing the influences of Tb and Hh on ΔV. The coefficient of determination, R 2 , of equation (3) is 0.950. This means that equation (3) is accurate within an error of 5.0%

Design parameters and ΔV results for first-order RSM.
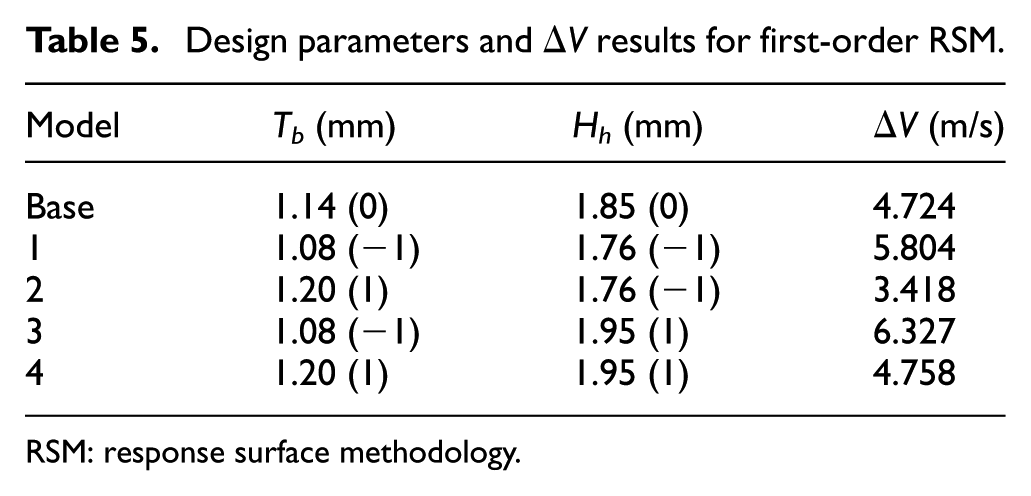
RSM: response surface methodology.
To obtain the minimum value of ΔV, the optimum conditions of (Tb, Hh) outside the domain of equation (3) remain to be found. To efficiently approach the optimum point, sequential experiments were performed along the path of the steepest gradient. In equation (3), the steepest gradient vector (Δ) is defined as

The step size of Tb, which has a larger effect on ΔV than Hh, was chosen to be 5% of the value of Tb in Table 5, and the step size of Hh was then chosen according to the steepest gradient vector. With these values for Tb and Hh, FEAs were performed, and the results are presented in Table 6. Figure 13 shows the force–stroke curves for the base model to the base + 6Δ model. Here, the base, base + Δ, base + 2Δ, and base + 3Δ models stay within the envelopes; the base + 4Δ and base + 5Δ models cross the upper envelope by a small margin; and the base + 6Δ model exceeds the upper envelope by a larger margin. Therefore, no further variations beyond base + 6Δ were considered.
Design parameters and ΔV along the steepest gradient path.


Variant force–stroke curves around the load peak in the steepest gradient method.
As shown in Tables 5 and 6, model 2 in Table 5 resulted in the minimum ΔV. Thus, the condition for model 2 (Tb = 1.20, Hh = 1.76) is expected to be the approximate optimum point. To achieve a higher degree of optimization, second-order RSM was conducted near the conditions of model 2. To achieve a fit in the second-order RSM, the central composite design (CCD) of the DOE was applied. The parameters and results of the CCD are shown in Table 7. Second-order RSM was used with the values in Table 7 to derive equation (5). The value of R 2 for equation (5) is 0.978, which means that equation (5) is accurate within an error of 2.2%
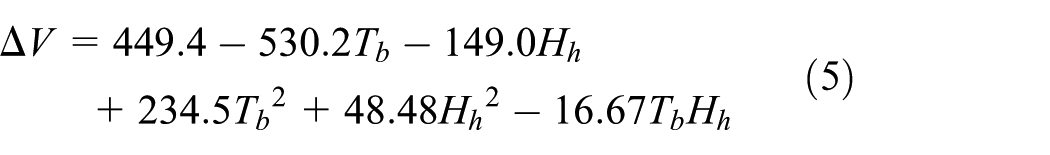
Design parameters and ΔV of CCD second-order RSM.

CCD: central composite design; RSM: response surface methodology.
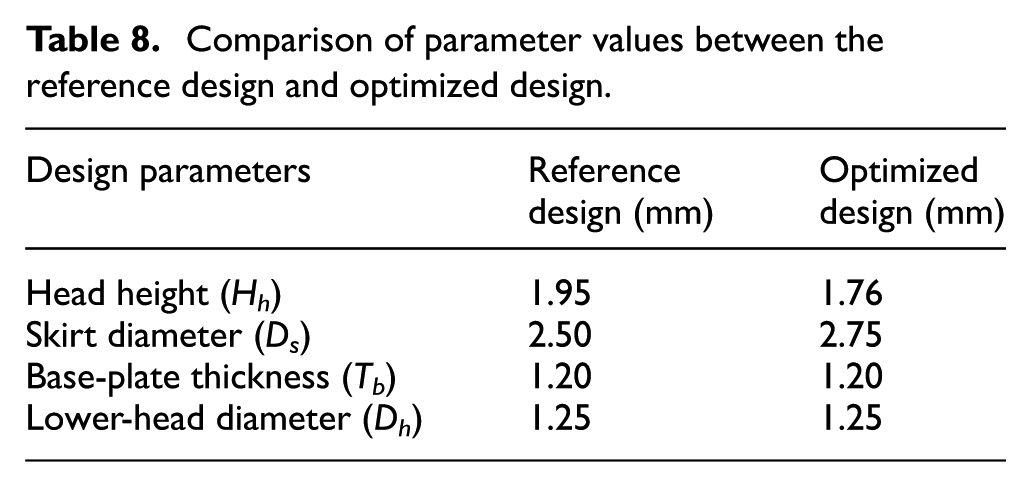
The stationary point of equation (5) is (Tb = 1.19, Hh = 1.74), and ΔV at the stationary point is 3.399 m/s according to equation (5). In FEA conducted under this condition, ΔV was calculated as 3.435 m/s, which is slightly higher than that of model 2 in Table 5. The difference is within an error of 2.2%. Rather than to scrutinize for meager improvements, the conditions for model 2 were taken to be the optimal point from a practical point of view. Figure 14 shows the response surface near the optimum point. The design-parameter values for the reference design and the optimized design are listed in Table 8.
Comparison of parameter values between the reference design and optimized design.

Results of second-order RSM: (a) contour plot and (b) surface plot. Minimum velocity change of 3.34 m/s is expected at Tb = 1.19, and Hh = 1.74.
Test results for tactile and auditory qualities
To validate the improvement, a prototype was manufactured with the optimal parameter values of the rubber dome. Figure 15(a) shows the force–stroke curves of the optimized and reference models. The force–stroke curve of the optimized model stays within the upper and lower envelopes. Figure 15(b) shows the noise level during button operation. The maximum noise level of 59 dBA of the reference model was reduced to 47 dBA with the optimized model.

Comparison between the optimized and reference models of the audio button: (a) force–stroke curves and (b) noise versus time curves. The force–stroke curve of the optimized model stays within the upper and lower envelopes. The maximum noise level of 59 dBA of the reference model is reduced to 47 dBA with the optimized model.
Discussion
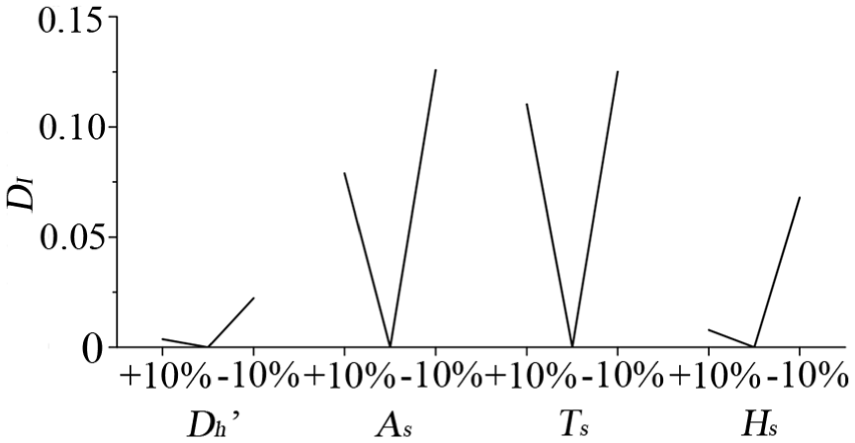
As shown in Figure 11, the deformation behavior of the rubber dome is very sensitive to certain parameters, such that the tactile force deviates from the tactile envelopes in Figure 3(b) with relatively small variations in their values. Figure 16 illustrates the deviation from the tactile envelopes for a 10% reduction in As. In this example, the force–stroke curve falls significantly below the lower envelope. To characterize the degree of deviation from the tactile envelopes, the following index is defined

Here, AR is the area under the force–stroke curve of the reference design, and AD is the shaded area in Figure 16. The deviation index for 10% variations from the reference values of

Effect of the reduction in the parameter value As by 10% on the load–stroke curve. The degree of degradation in the tactile quality is represented by the shaded area AD.
Effects of the parameters
In previous studies, the following simple relationship for the critical buckling load of the conical frustum was proposed according to theoretical analysis15,16

Here, E is Young’s modulus, α is the cone angle, t is the cone-wall thickness, and C is a correction factor to compensate for the discrepancy between theoretical predictions and experiments. Equation (7) indicates that the cone-wall thickness and cone angle are major parameters governing the critical buckling load. Considering the geometrical similarity between the conical frustum and the rubber dome, the major contribution of the skirt thickness (Ts) and skirt angle (As) to the deviation index may be understood in light of equation (7).
Within the tactile envelopes, the contributions of the other parameters—Dh, Tb, Ds, and Hh—to the velocity change of the dome head (Figure 10) during the impact are shown in Figure 12. Among these, the head height Hh and base-plate thickness Tb show higher contributions than the lower-head diameter Dh and skirt diameter Ds. Hh directly affects the moving mass and thus the impulse. Dh also affects the head mass but to a far lesser extent than Hh because the mass increase for Hh is 4–5 times that for Dh. The reduction in Tb leads to an increase in the skirt length and a reduced load, as shown in Figure 11(h). This means that the head acceleration increases as Tb decreases. The variation in Ds has little effect on the buckling characteristics or the moving mass, and the noise level is insensitive to it.
This study has room for improvement. The collision between the rubber dome and the PCB is not the sole source of sound during button operation. When the finger is removed, the rubber dome springs upward, and the button collides with the button case. To reduce the overall sound, the entire button operation cycle should be considered, as well as the viscoelasticity of silicone rubber.
Conclusion
A car audio button assembly consists of several components, including a button, a button case, a rubber dome, and a PCB. When the button is pressed and released, different noises are generated. Among these, the clicking noise occurring during pressing is of particular interest because it is related to the tactile quality of the button. The auditory and tactile qualities during pressing are governed by the buckling behavior of the rubber dome.
In this work, it was shown that the clicking noise can be reduced while maintaining the tactile quality by the shape optimization of the rubber dome. For the optimization, the kinetic energy of the buckling rubber dome was represented by the relative velocity of the dome head with respect to the PCB base. With careful selection of the rubber-dome geometry parameters for the optimization, a noise reduction of 12 dBA was achieved.
Footnotes
Handling Editor: ZW Zhong
Declaration of conflicting interests
The author(s) declared no potential conflicts of interest with respect to the research, authorship, and/or publication of this article.
Funding
The author(s) disclosed receipt of the following financial support for the research, authorship, and/or publication of this article: This research was supported by the Basic Science Research Program through the National Research Foundation of Korea (NRF), which is funded by the Ministry of Science, ICT & Future Planning (MSIP) (No. 2007-0056094).