
Abstract
In the overall design and performance prediction of spacecrafts intended to accomplish soft landing on the moon, touchdown dynamics analysis during the landing phase is one of the most important tasks. Due to uncertainties of the landing site and flight states of the vehicle at touchdown, the landing stability is systematically studied in this article by employing the techniques of computer experiments. Firstly, the landing dynamics simulation model of a lunar lander is established and verified by physical tests. Then, design of experiments and response surface methodology have been utilized to analyze the landing stability. Consequently, main effects of initial landing conditions (inputs) on landing dynamics responses (outputs) have been investigated. Response surface models for approximating relationships between inputs and outputs are also acquired. The worst sets of landing conditions and boundaries of initial velocities for stable landings are finally determined with the help of response surface models. The approach for landing stability analysis proposed in this article has been proven effective and efficient and provides valuable guidance for the lander design and analysis.
Keywords
Introduction
Recently, with scientific and technological advancements, many countries or organizations are carrying out extensive research on space and the Moon. The Moon, as the nearest celestial body to the Earth, has become increasingly attractive for space scientists because of its abundant natural resources and high potential as a future territory. 1 Given these benefits of lunar exploration, Americans, Europeans, Japanese, Chinese, and Indians are all planning to go back to the Moon. From the Apollo Program to Lunar CATALYST designed by NASA, 2 it indicates that scientists and engineers at NASA have never lost interest in lunar exploration.
In lunar exploration, the achievement of soft landing is a challenging task, since the landing operation will occur at an unprepared site, and the vehicle could be oriented randomly with respect to the flight path. Generally, the engine of a lunar lander is shut down at a certain height from the lunar surface to prevent the splash of the lunar regolith, then the lander will freely fall to the lunar surface. 3 During the touchdown seconds, great impact forces may be induced to the spacecraft. Therefore, effective measures must be taken to attenuate the shock energy. As reported in the previous lunar exploration missions, such as unmanned Luna, Surveyor, and manned Apollo Program, the legged-type lander is widely used in spacecraft to implement soft landing. 4 Such landers employ shock absorbers located in the landing gears as the primary shock attenuation component. To assure a successful landing, the landing gear must provide sufficient energy absorption capabilities and also must prevent the landing vehicle from toppling. Thus, in the overall design and performance prediction of the landing gear, touchdown dynamics and landing stability analysis are always of great concern for guaranteeing safe landings of the lunar module and protecting the devices inside it from being damaged. 6,7
Researchers have been dedicated to developing mathematical models to accomplish the soft landing dynamics simulation of legged-type lunar lander in the past decades. 5 –8 The finite element method and the multi-body system dynamics method are two primary modeling approaches. The finite element method is able to consider the nonlinear characteristics of the geometry, materials, and contact so that more accurate results are usually produced. One drawback of this method is that the analysis is too time-consuming. The multi-body dynamics model, despite less precise, can improve the computational efficiency substantially. In this article, a lunar landing dynamics model is built based on the multi-body system dynamics approach and verified by physical tests, which is the foundation for subsequent landing stability analysis. In addition, the analysis of landing stability has received great interest from the literature. Jones and Hinchey 9 and Black 10 studied the effect of landing condition parameters on stability capability and provided guidelines for the design of landing gears. Alderson and Wells 11 and Sperling and Garba 12 created mathematical models and computer programs for investigating the interaction of several parameters on landing stability of Surveyor lunar landers. Hilderman et al. 13 and Rogers 14 proposed a new analytical method to determine the worst landing conditions and stable landing boundaries for Apollo lunar landers. Drop tests on scaled and full-size landers were also conducted to verify the landing stability capabilities of these landers. 15,16 Landing stability analysis approaches for the Surveyor and the Apollo landers are still in use nowadays. 17 –20 However, the related works mentioned above only considered limited landing conditions and selected values of input factors by arbitrary judgments. No theoretical analysis on the experiment results has been carried out to indicate whether the experiments were sufficient and the consequences were convincing enough. This article proposes a more effective approach by applying design of experiments (DOE) and response surface methodology (RSM) on landing stability analysis. DOE based on the statistical theory has been employed to arrange the landing experiments, which aims to acquire as much information as possible with the least possible effort. Regression analysis is then conducted to infer the influence trend and extent of each input factor on the outputs. The RSM helps provide surrogate models, which have been validated by the analysis of variance (ANOVA), for predicting the extreme value of each response, which contributes to find the worst landing cases more conveniently and convincingly.
The outline of this article is as follows. The first section is the introduction; the landing dynamics model is established and verified in “Landing dynamics model” section; “Computer simulation experiment” section gives the theoretical backgrounds on DOE and RSM; landing stability analysis by using DOE and RSM as well as the results and discussions are finally presented in “Results and discussions” section; the last section is the conclusion.
Landing dynamics model
Configuration of the lunar lander
The lunar lander discussed here is composed of a main body and four landing gear assemblies, which are uniformly distributed around the main body. Each landing gear consists of a primary leg strut, two secondary leg struts, and a footpad, as shown in Figure 1. The leg struts are the primary load-bearing components and serve as supports for the whole lander. Shock absorbers located inside the strut are employed to absorb the landing energy while the lander impacts with the lunar surface. The footpad is beneficial to decreasing the impact penetration on the low bearing strength surface.

Configuration of the landing gear.
From Figure 1, it can be seen that each leg strut comprises an outer cylinder, an inner cylinder, and a shock absorber. The outer cylinders of all the leg struts are attached to the main body at their upper ends. The inner cylinder of the primary leg strut is connected to the footpad at its lower end, while that of each secondary leg strut is connected to the primary leg strut. Crushable aluminum honeycomb cartridges, which collapse at a constant load, are used as the primary type of shock-attenuation devices. 21 The primary shock absorber is only capable of absorbing energy during the strut’s compressing, while each secondary shock absorber can absorb energy during the strut’s extending or compressing.
Dynamics model
The landing dynamics simulation model is established by using the multi-body dynamics simulation software ADAMS [version MSC ADAMS 2005]. Each leg strut is attached to the main body through a universal joint with two rotational degrees of freedom. A translational joint is applied to enable the strut’s compressing and extending between the outer and inner cylinders of each leg strut. Each secondary strut is connected to the outer cylinder of the primary strut with a spherical joint permitting all three rotations, and the joint connecting the footpad and the inner cylinder of the primary strut is also a spherical type.
The significant forces acting on the landing vehicle include the gravity, the shock absorber forces, and the contact forces between the footpads and the lunar surface. The honeycomb shock absorber in each strut is assumed to produce acting and reacting forces directing along the axis of the strut at the outer and inner cylinders of the strut. Figure 2 illustrates typical honeycomb configurations for primary and secondary strut assemblies. Note that two stages of load level are designed for the primary strut. The initial low force level is intended to enhance the toppling stability, while the higher force level limits loads on the vehicle body without bottoming out the strut. 22
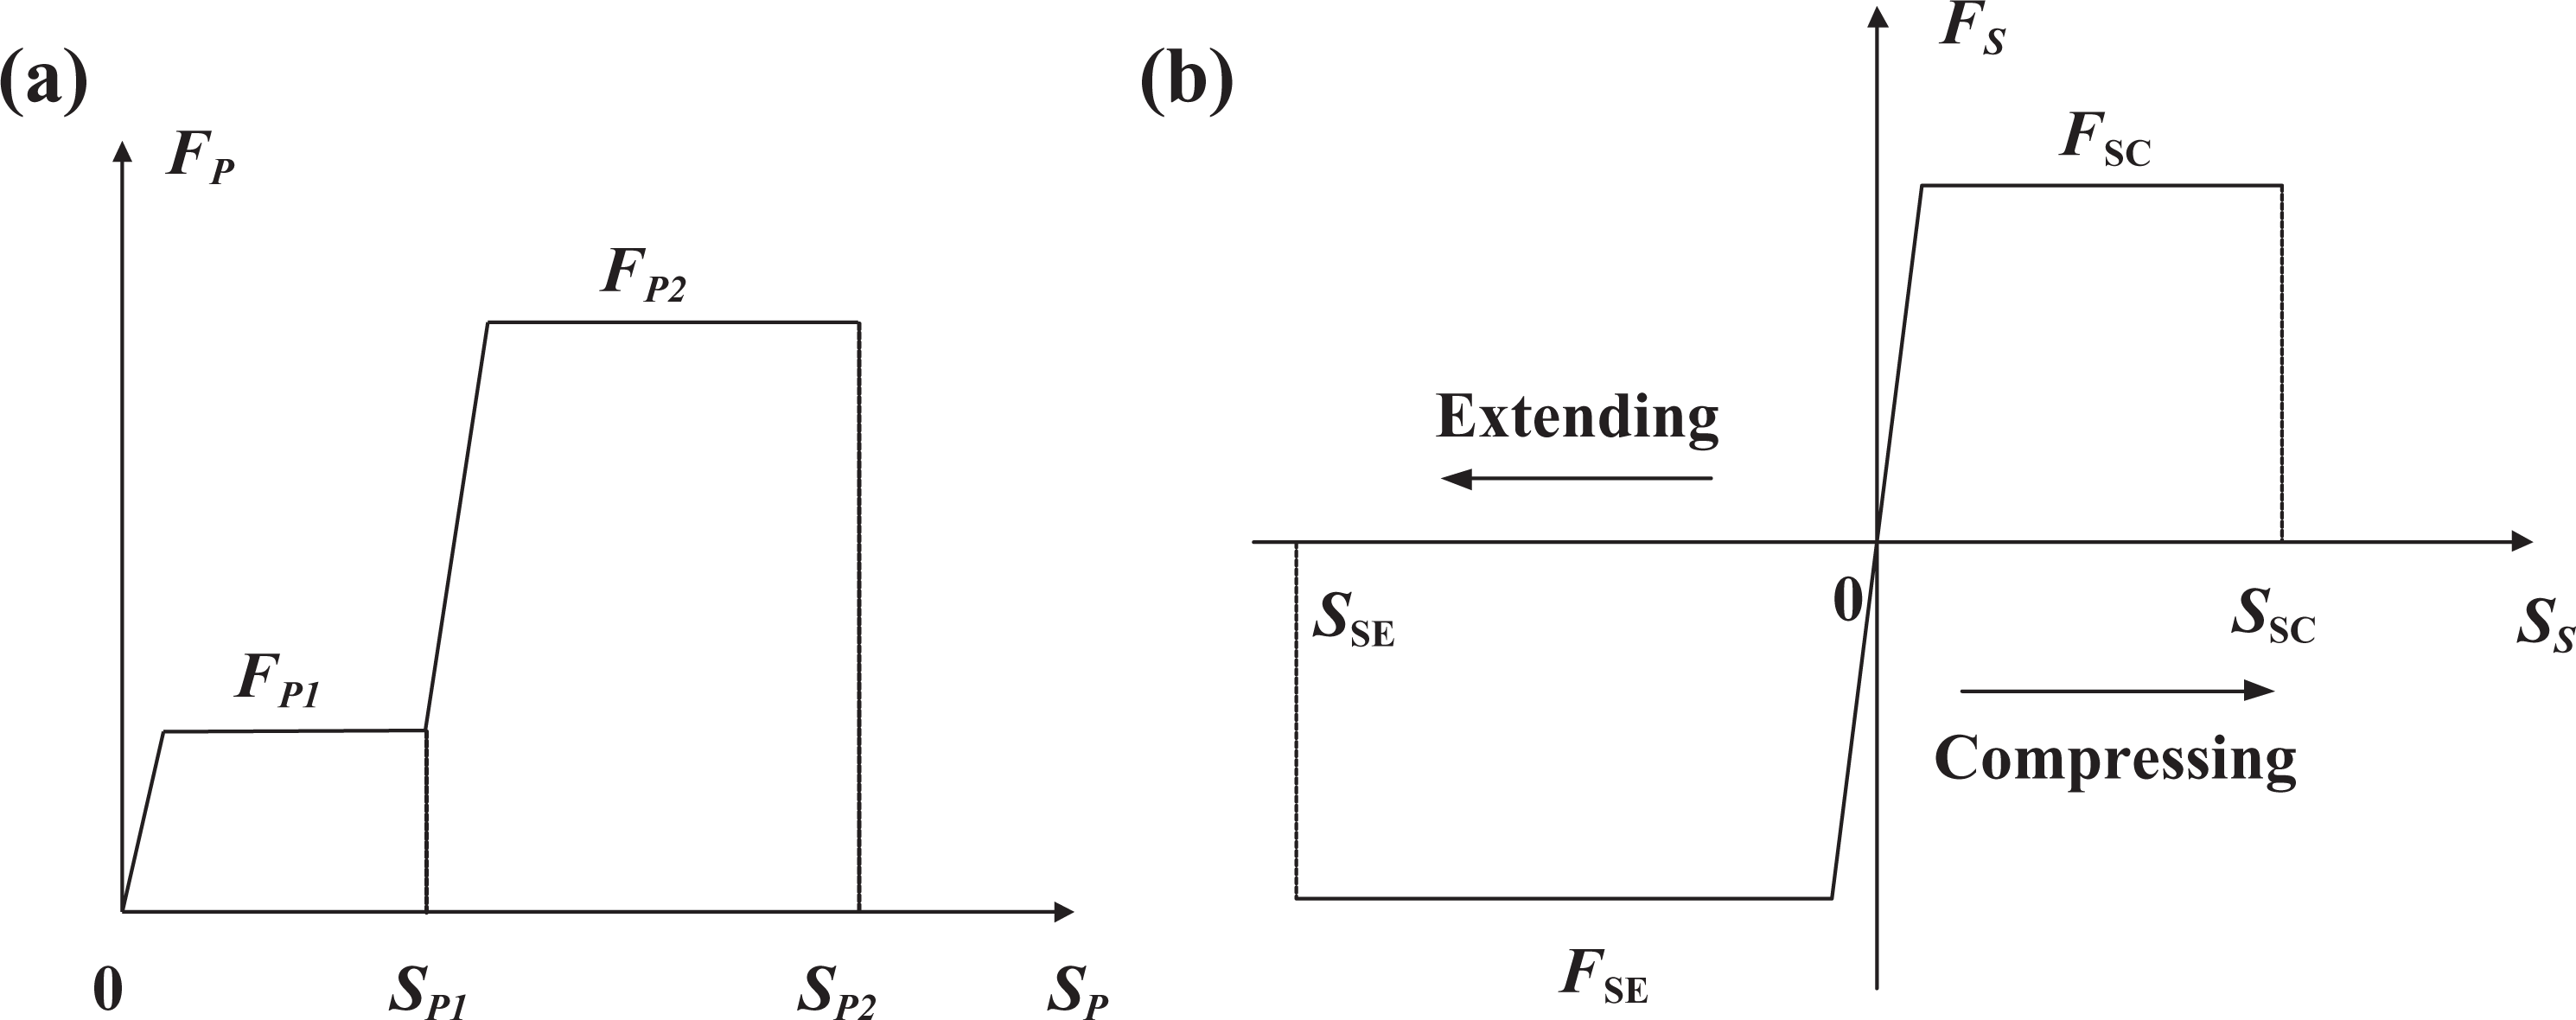
Honeycomb configurations for primary and secondary struts. Load-deflection curves of honeycombs in the (a) primary strut and (b) secondary strut.
The shock absorber force of the primary strut F P is mathematically expressed as

where F
HP(S
P) is the honeycomb force as the primary stroke varies, whose value equals F
HP1 when 0 < S
P ≤ S
HP1 and takes F
HP2 when S
HP1 < S
P ≤ S
HP2, as illustrated in Figure 2(a). cv
P represents the vicious damping coefficient of the primary strut, and
The shock absorber force of each secondary strut F S is computed by

where F
HS(S
S) represents the honeycomb force as the secondary stroke varies, whose value equals F
HSC when 0 < S
S ≤ S
HSC and takes F
HSE when S
HSE ≤ S
S < 0, as illustrated in Figure 2(b). cv
S represents the vicious damping coefficient of the secondary strut and
The contact force between the footpad and the lunar surface is divided into a normal force perpendicular to the lunar surface and a tangential force parallel to the surface. The normal force Fn is modeled as a nonlinear spring damper 23

in which δ is the penetration of the footpad into the lunar surface and

where μ is the Coulomb friction coefficient, vt is the tangential velocity of the footpad, and fv ⋅ vt represents the friction force due to velocity.
Physical landing tests have been conducted on a 1/4 lander with only a single leg. The corresponding dynamics model is also built in ADAMS (Figure 3). Results of tests are compared with those of simulations to verify the effectiveness of the modeling approach mentioned above. Physical tests are implemented under two cases with different landing weights and the same release height as shown in Table 1. Figures 4 and 5 illustrate the comparisons of the time history curves of the primary and secondary strokes between tests and simulations under the two landing cases. It can be seen that simulation results are in good agreement with test results, which validates the correctness of our dynamics model. The single-leg model is then expanded to the complete four-leg model (Figure 6), ready for use in subsequent landing stability analysis.

Dynamics simulation model for the single-leg lander.
Cases for landing tests of the single-leg lander.

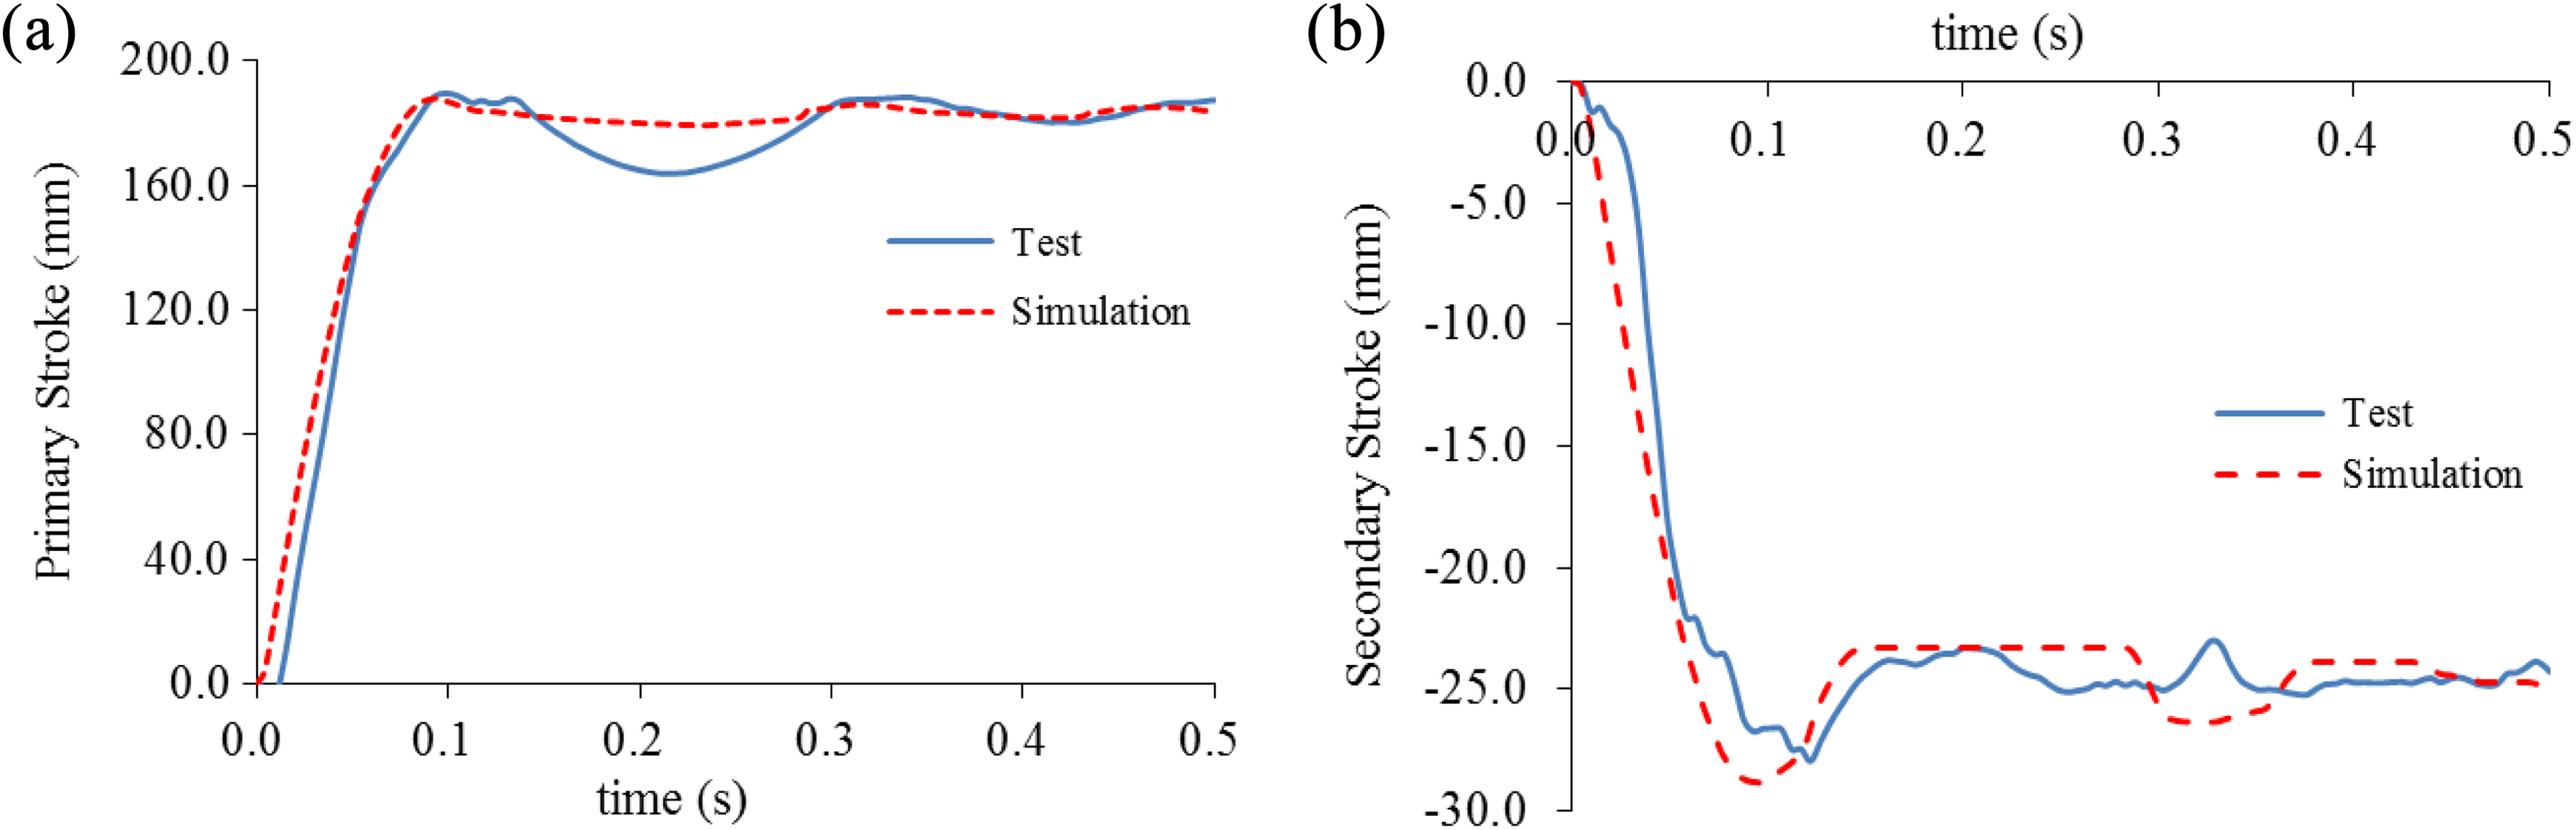
Comparison of test and simulation results under case S1. Time history curves of the (a) primary stroke and (b) secondary stroke.
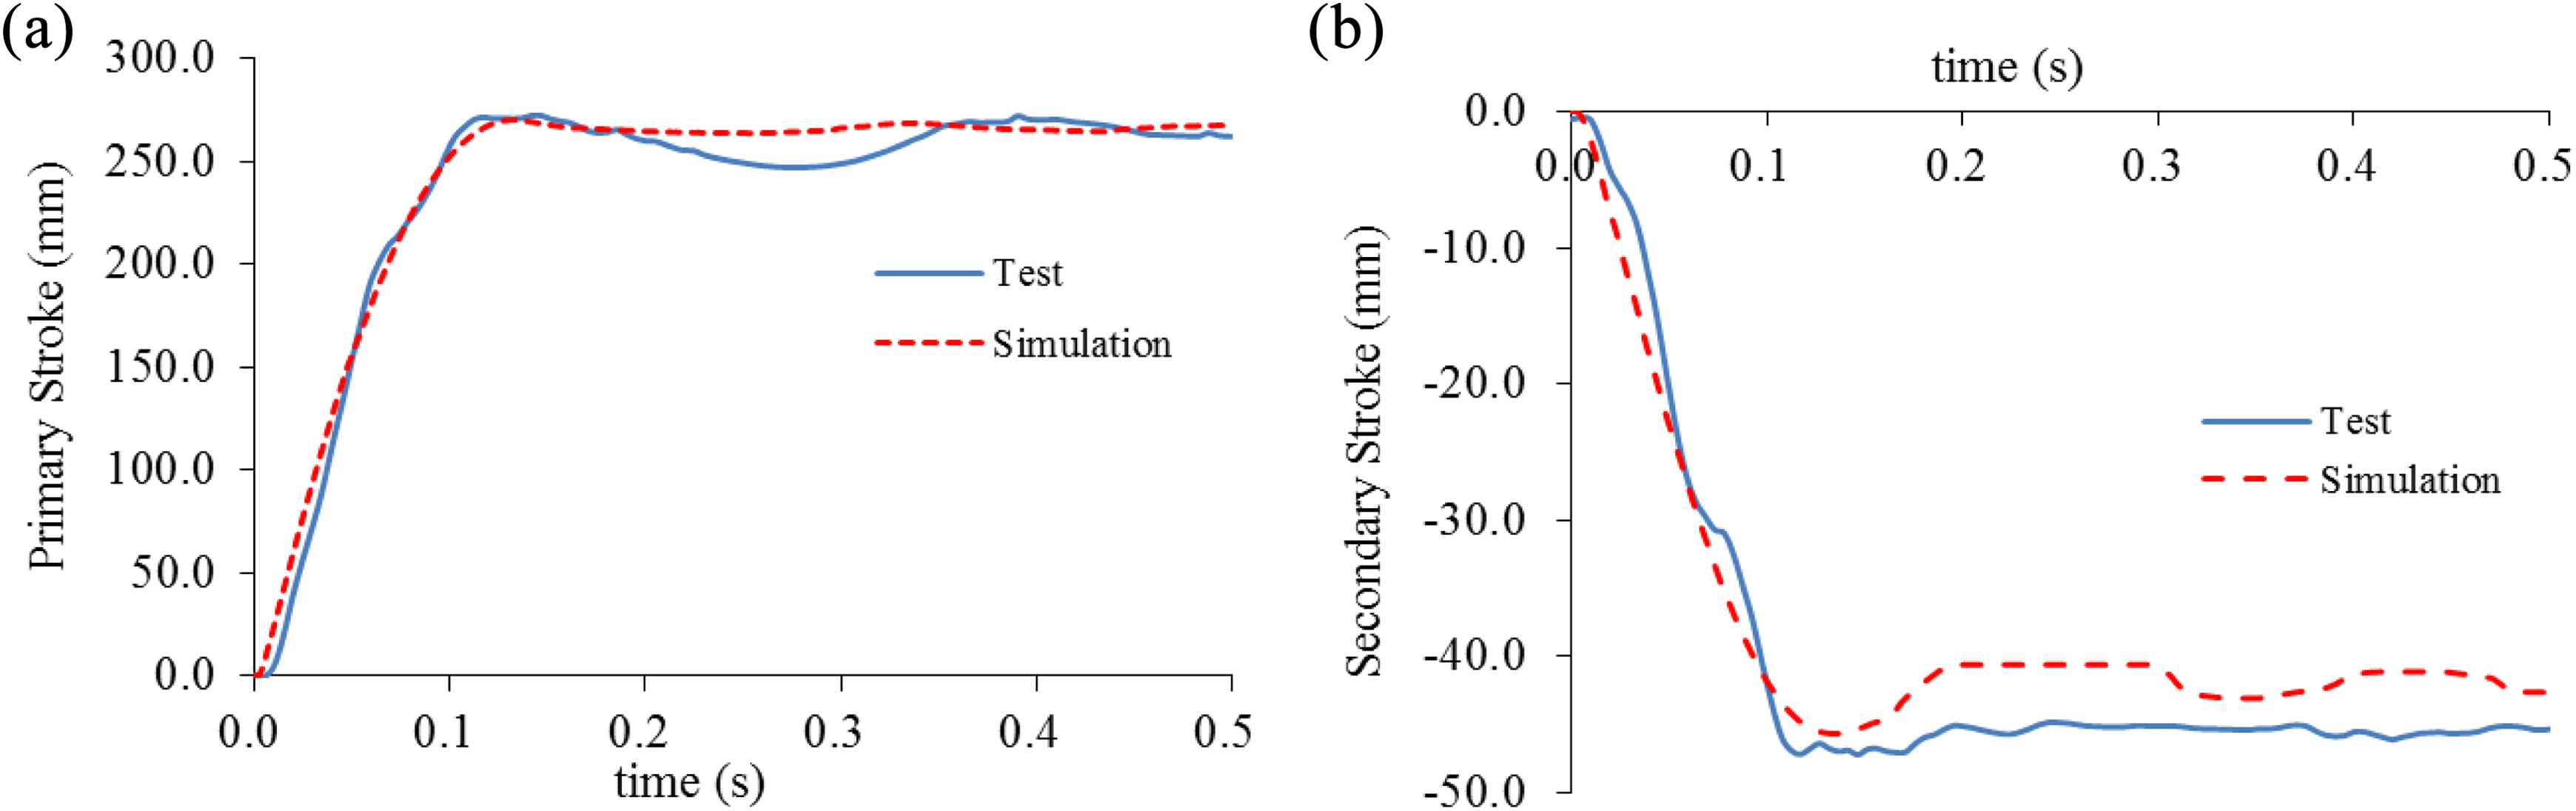
Comparison of test and simulation results under case S2. Time history curves of the (a) primary stroke and (b) secondary stroke.

Dynamics simulation model for the four-leg lander.
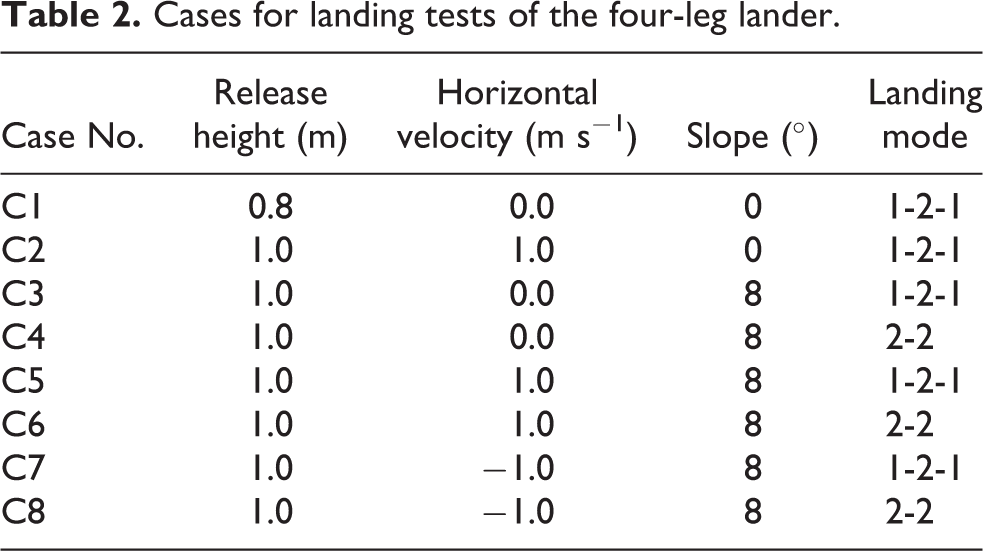
Physical landing tests on the complete four-leg model are also carried out under eight different cases as listed in Table 2. Figure 7 illustrates a schematic diagram for physical landing tests of the four-leg lander. 24 Landing case parameters include the release height, the initial horizontal velocity, the slope of the landing surface, and the landing manner. The release height is the vertical distance from the landing surface to the bottom of the footpad that lands first. The initial horizontal velocity is directed toward the slope. A positive value denotes a downhill landing, while a negative value denotes an uphill landing. Two symmetrical landing manners are considered in the tests, known as the 1-2-1 and the 2-2 landing manner. The former represents initial touchdown of one leg, followed by simultaneous touchdown of the middle two legs, and then subsequent touchdown of the remaining legs, as shown in Figure 8(a). The latter represents initial simultaneous touchdown of two legs, followed by simultaneous touchdown of the other two legs, as shown in Figure 8(b).
Cases for landing tests of the four-leg lander.

Schematic diagram for physical landing tests of the four-leg lander.

Schematic diagrams for symmetrical landing manners. (a) 1-2-1 landing manner and (b) 2-2 landing manner.
According to the landing cases listed in Table 2, dynamics simulations are also executed with the model shown in Figure 6. Results of the maximum primary strokes for all legs under each case from simulations are listed in Table 3 and compared with those from tests. It can be seen that most of the simulation results are close to the corresponding test results. Significant differences in several cases are mainly caused by three major factors. Firstly, the dynamics simulation model is incapable of being completely consistent with the actual scenario. In particular, it is very difficult for accurately simulating the nonlinear forces between footpads and the landing surface. Secondly, fabrication deviations may cause test results different from theoretical ones. Especially, since honeycomb forces play great roles in the landing process, manufacturing precisions of the honeycombs (which are nonreusable and diverse honeycombs have been used in different test cases) may have a big impact on test results. Thirdly, the inaccuracy of observation or measurement is another source of error for physical tests. In conclusion, we consider that the simulation model is accurate enough for prediction of landing dynamics responses.
Comparisons of maximum primary stroke results between simulations and tests.

Computer simulation experiment
To analyze the landing stability, the techniques of computer simulation experiment are introduced in this section, which are composed of the DOE and the RSM.
Design of experiments
In general, DOE is a statistical method for arranging experiments and analyzing experimental data. It is an effective strategy for examining the behavior of a physical phenomenon when changing its input values in order to detect their effects on the output. 25 DOE helps in understanding the input–output relationship and also in identifying the relative importance of the inputs.
To start with, some fundamental terms involved in the DOE technique are introduced. The factors are the inputs of an experiment, which are varied during the DOE. A factor may be assigned at least two distinct values in the DOE, and each value is called a level. In other words, levels are the different possible values taken from each factor. The response is the output of an experiment, which reflects how the system responds to a certain combination with different values of input factors. The relationship between the response y and the factor vector

Practically, the mean of the response is calculated, after the implementations of n experiments, as follows

where

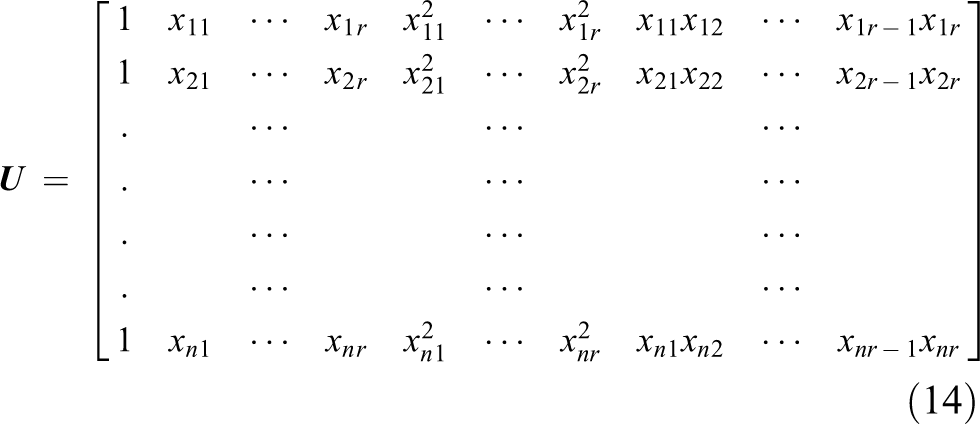
In DOE, the most important task is how to construct the design matrix

where d(

Response surface methodology
The RSM provides an approximate mathematical expression for the relationship between a response y and its factors x 1, x 2,…, xr through regression analysis. 27 Consider the following second-degree polynomial expression as the approximation model
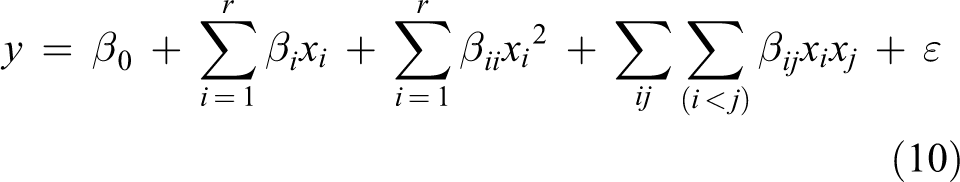
The model contains (r + 1)(r + 2)/2 regression parameters, including coefficients for main effects βi , coefficients for quadratic main effects βii , and coefficients for interaction effects βij . ε is the fitting error and assumed to follow a normal distribution. In order to estimate the unknown coefficients of equation (10), a series of experiments should be carried out, and the response is observed after each experiment. This creates a set of equations in the following form

where


Using the least squares regression, the estimate of

Furthermore, each component of
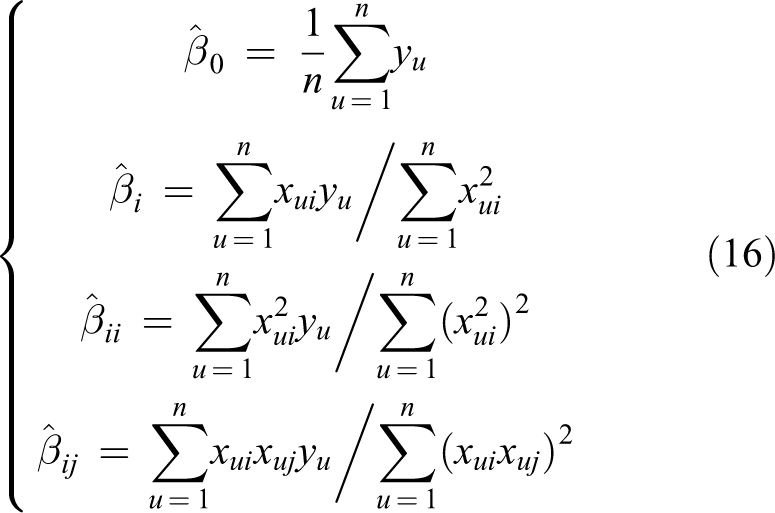
By differentiating equation (10), the first-, second-order main effects, and interaction effects can be calculated as follows


After obtaining the response surface model, ANOVA is performed to test the significance and the goodness of fit of the model. 28 In ANOVA, F-test is usually employed to test the significance of regression. For significance test, we suppose the hypothesis
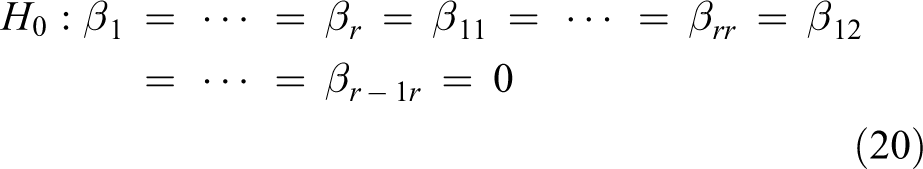
If H
0 is accepted, it indicates that the regression is not significant, which means that it is not appropriate to use model (10) to formulate the relationship between the input vector

where yi
(i = 1, 2,…, n) are real observed values of the response in the n experiments, and

in which

where m is the number of regression coefficients excluding the constant term and called SSR’s degrees of freedom. (n − m − 1) is called SSE’s degrees of freedom. It can be proved that F follows an F-distribution with parameters m and (n − m − 1), that is, F ∼ F(m, n − m − 1). We then compare the ratio F with the 100(1 − α)% point of the tabulated F(m, n − m − 1) distribution. If F > Fα (m, n − m − 1) (α is termed as the significance level), we reject the hypothesis H 0 and infer that the regression model is significant running a risk of less than 100α% of being wrong.
A useful statistic for checking how well the regression model approximates the real observed data is the coefficient of determination R 2, which is defined as
R 2 measures the proportion of total variation about the mean explained by the regression. The closer R 2 value is to 1, the better fit of the model will be. An R 2 of 1 indicates that the regression model perfectly fits the data.
Results and discussions
In “Landing dynamics model” section and “Computer simulation experiment” section, we have established the dynamics model of the lunar lander and introduced the theoretical background on computer simulation experiments. In this section, the techniques of DOE and RSM are applied for analyzing the landing stability of the lunar lander. Results and discussions are then presented to demonstrate the effectiveness of the proposed method. Firstly, criteria for judging a safe landing of the lunar lander are specified. After that the main effect analysis is conducted to investigate the trend and the extent of each input factor on the landing stability responses. Then, the worst landing condition for each response is acquired by using the RSM. The envelope of initial velocities for stable landing is given at last.
Landing stability criteria
According to the requirements of lander toppling prevention and impact energy absorption, criteria for stable landing are given as follows: no vehicle toppling happens; no excessive stroke of any primary shock absorber occurs; and no excessive compression or extension stroke of any secondary shock absorber takes place.
A parameter representation of lander toppling is defined as the minimum stability distance D min. Stability distances are measured from the mass center of the lander to overturn planes, which are vertical planes that pass through every two adjacent landing gear footpads as shown in Figure 9. The stroke of each primary shock absorber is denoted as SPC i (i = 1, 2, 3, 4), and SPCmax denotes the maximum value taken from results of the four primary strokes. The compression stroke and the extension stroke of the secondary shock absorber are denoted as SSC i and SSE i (i = 1, 2, 3, 4), respectively. SSCmax and SSEmax denote the maximum absolute values among results of the four secondary compression and the four extension strokes, respectively

Parameter for measuring lander toppling.
Hence, the landing stability criteria can be also expressed as follows:
D
min > 0, where D
min = min(D
1, D
2, D
3, D
4); SPCmax ≤ SPCth, where SPCmax = max(SPC1, SPC2, SPC3, SPC4); SSCmax ≤ SSCth, where SSCmax = max(SSC1, SSC2, SSC3, SSC4) and SSEmax ≤ SSEth, where SSEmax = max(SSE1, SSE2, SSE3, SSE4).
SPCth, SSCth, and SSEth denote threshold values for the stroke of the primary shock absorber, the compression stroke of the secondary shock absorber, and the extension stroke of the secondary shock absorber, respectively.
Main effect analysis
Concerning the landing stability analysis, input factors are selected as follows: the initial vertical velocity vv , the initial horizontal velocity vh , the initial yaw angle θx , the initial pitch angle θy , the lunar slope angle αs , and the landing weight mL , as illustrated in Figure 10. Output responses include the minimum toppling distance D min, the maximum primary compressing stroke SPCmax, and the maximum secondary compression and extension stokes, SSCmax and SSEmax.

Input factors for landing stability analysis. (a) Front view and (b) top view.
Firstly, the main effect analysis is conducted to investigate the trend and the extent of each input factor on the landing stability responses. Table 4 shows the lower and upper limits of all input factors, which are determined by the guidance and control systems. A series of landing dynamics simulation experiments have been designed by employing the optimal LHS technique introduced in “Design of experiments” section. With the results of simulation experiments and by utilizing the regression analysis of equations (15) to (18), main effects of input factors on each landing stability response are finally obtained and demonstrated in Figures 11 to 14.
Ranges of input factors for main effects analysis.


Main effect of each factor on D min. (a) vv on D min, (b) vh on D min, (c) θx on D min, (d) θv on D min, (e) αs on D min, and (f) mL on D min.

Main effect of each parameter on SPCmax. (a) vv on SPCmax, (b) vh on SPCmax, (c) θx on SPCmax, (d) θv on SPCmax, (e) αs on SPCmax, and (f) mL on SPCmax.

Main effect of each parameter on SSCmax. (a) vv on SSCmax, (b) vh on SSCmax, (c) θx on SSCmax, (d) θv on SSCmax, (e) αs on SSCmax, and (f) mL on SSCmax.
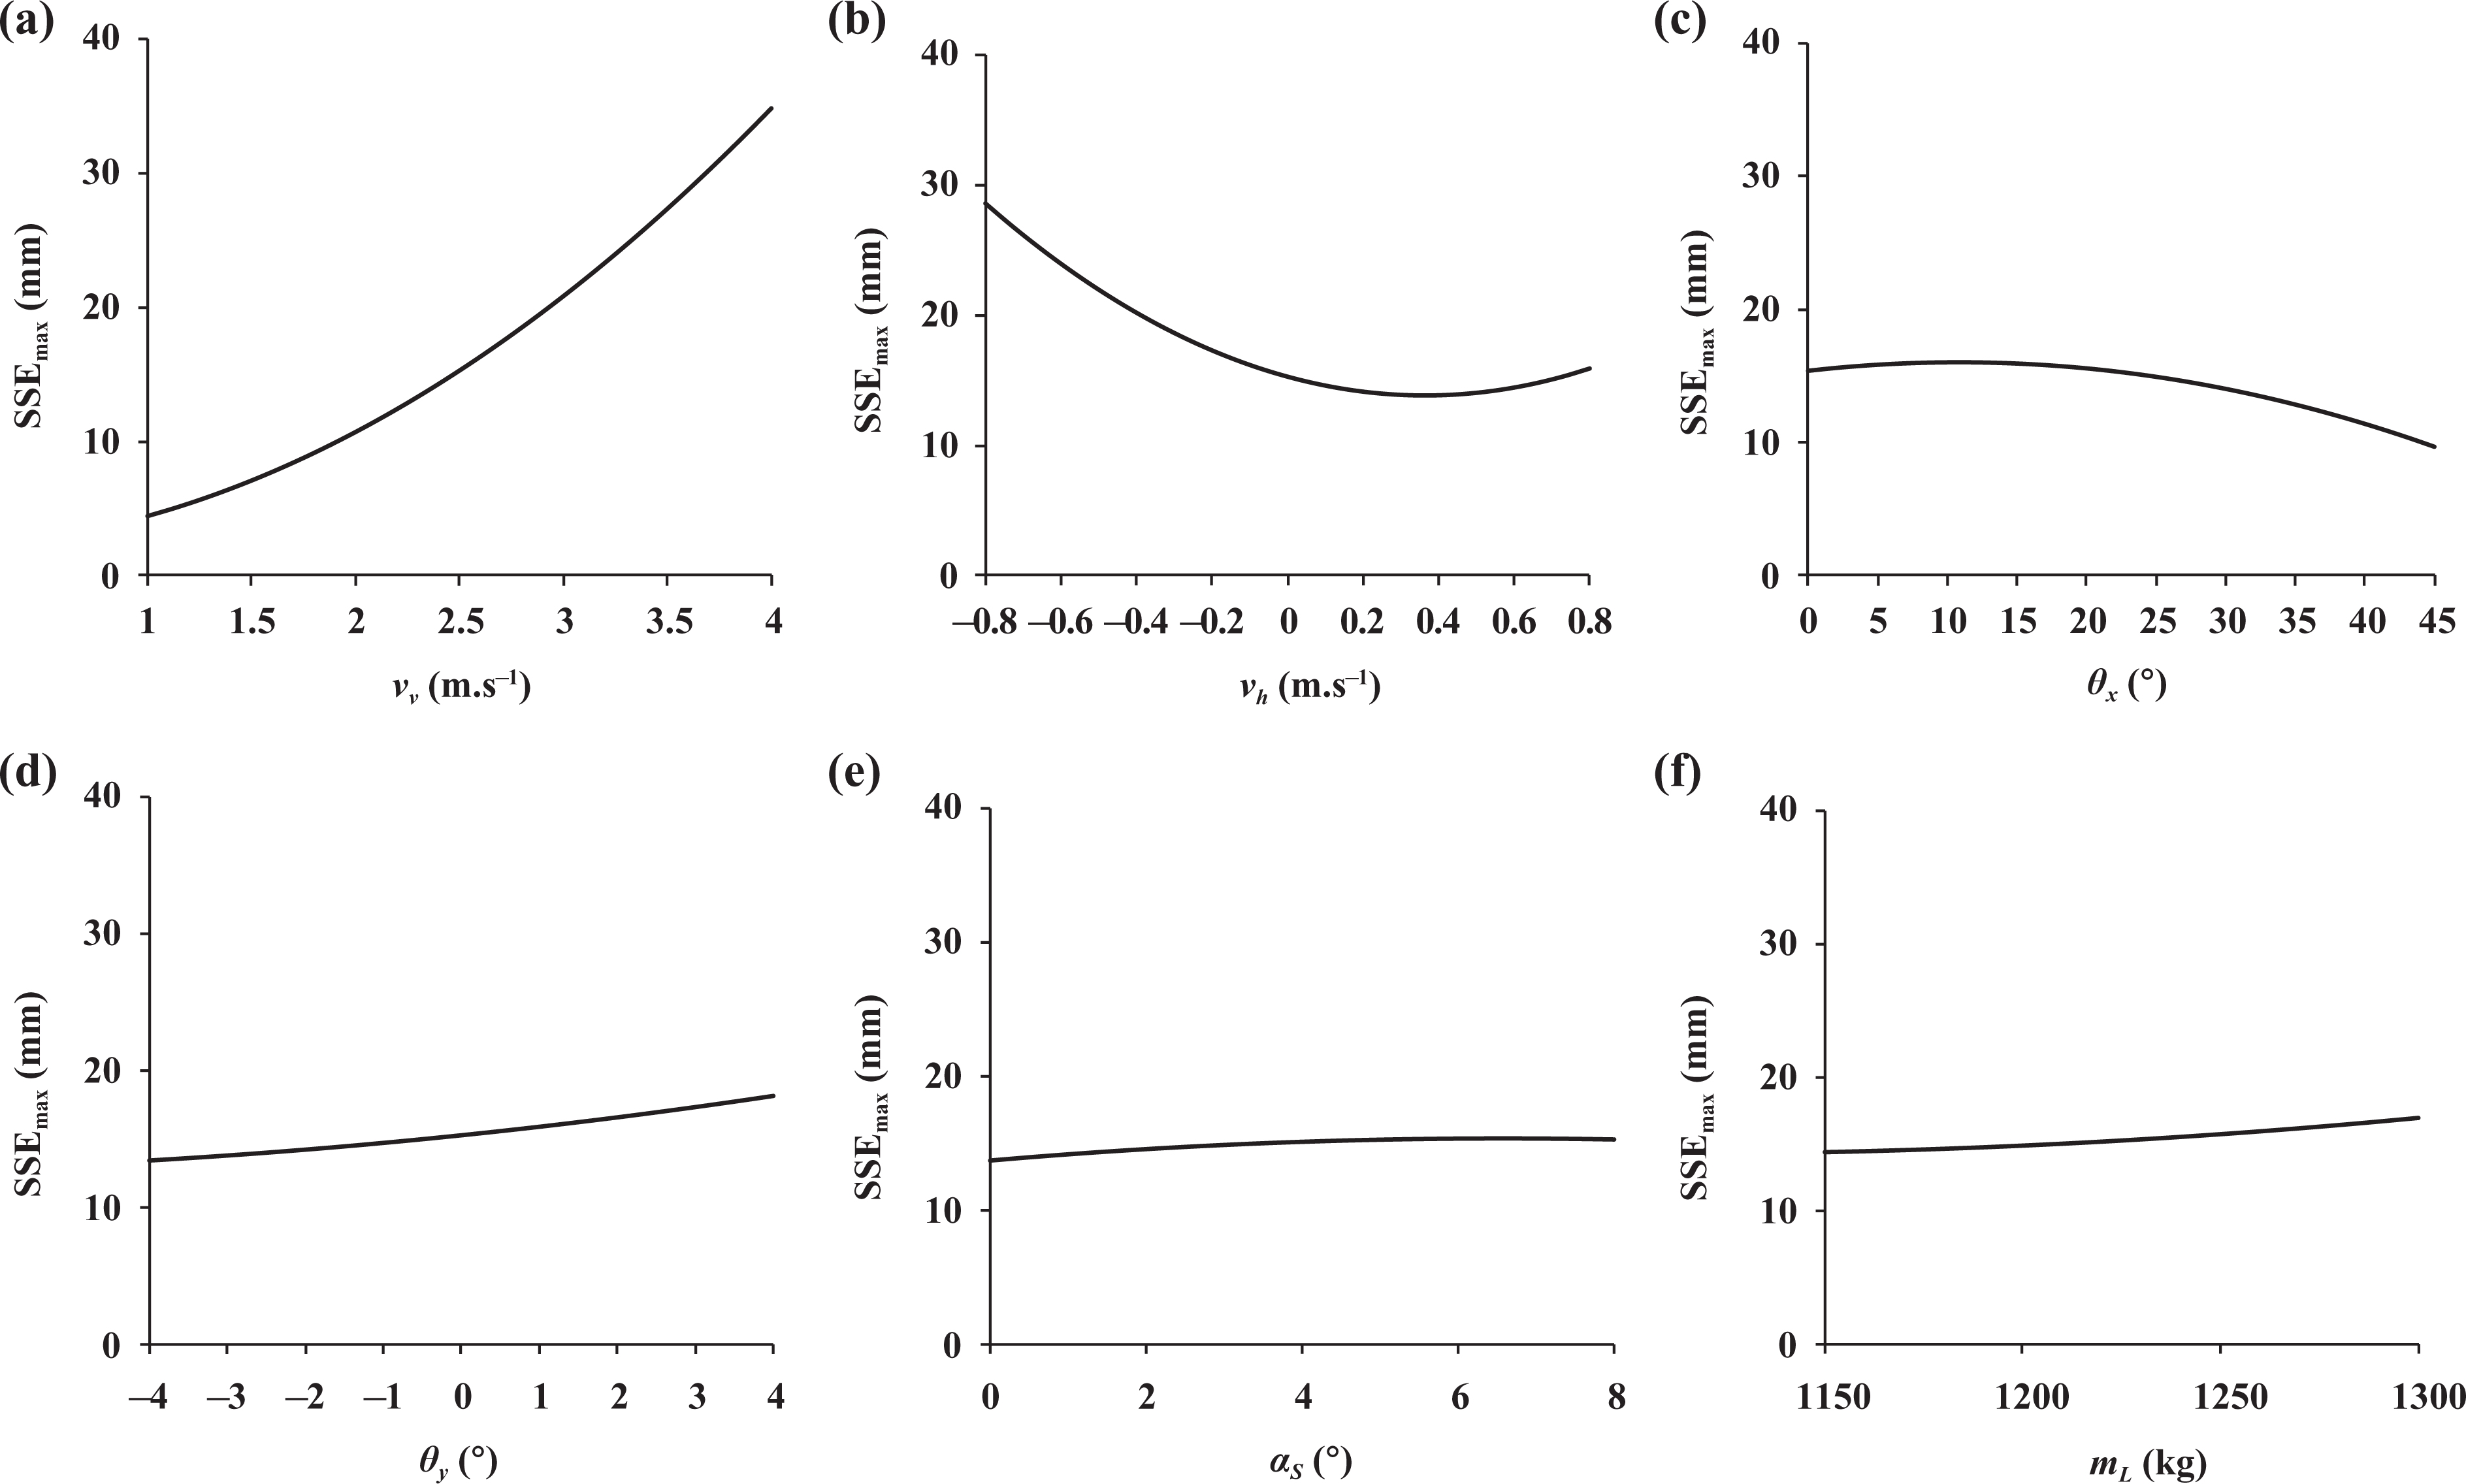
Main effect of each parameter on SSEmax. (a) vv on SSEmax, (b) vh on SSEmax, (c) θx on SSEmax, (d) θv on SSEmax, (e) αs on SSEmax, and (f) mL on SSEmax.
Figure 11 shows the main effect of each factor on the response D min. It appears that in an unsymmetrical downhill landing manner (0° < θx < 45° and vh > 0) and with the minimum landing weight, the lander is more likely to overturn as vv , vh , θv , and αs keep increasing.
Figure 12 shows the main effect of each factor on the response SPCmax. It can be seen that in a 1-2-1 uphill landing manner (θx = 0° and vh < 0) and with the maximum landing weight, the demand for energy absorption of the primary strut will become more critical as the absolute values of vv , vh , θv , and αs keep increasing.
Figures 13 and 14 show the main effects of each factor on the responses SSCmax and SSEmax, respectively. It seems that in an unsymmetrical uphill landing manner and with the maximum landing weight, situations for the secondary struts absorbing energy will become worse as the absolute values of vv , vh , θv , and αs keep increasing.
Worst landing conditions
Landing dynamics simulations are so complicated and time-consuming that it is extremely difficult to find the worst landing conditions from the infinite combinations of different values of input factors. Therefore, we employ the RSM to approximate the relationships between landing dynamics responses and input variables. Since the approximation model is always more accurate if ranges of the input variables are set small enough, we further narrow the range of each input factor based on the results of the main effect analysis, as listed in Table 5.
Ranges of input factors for response surface models.

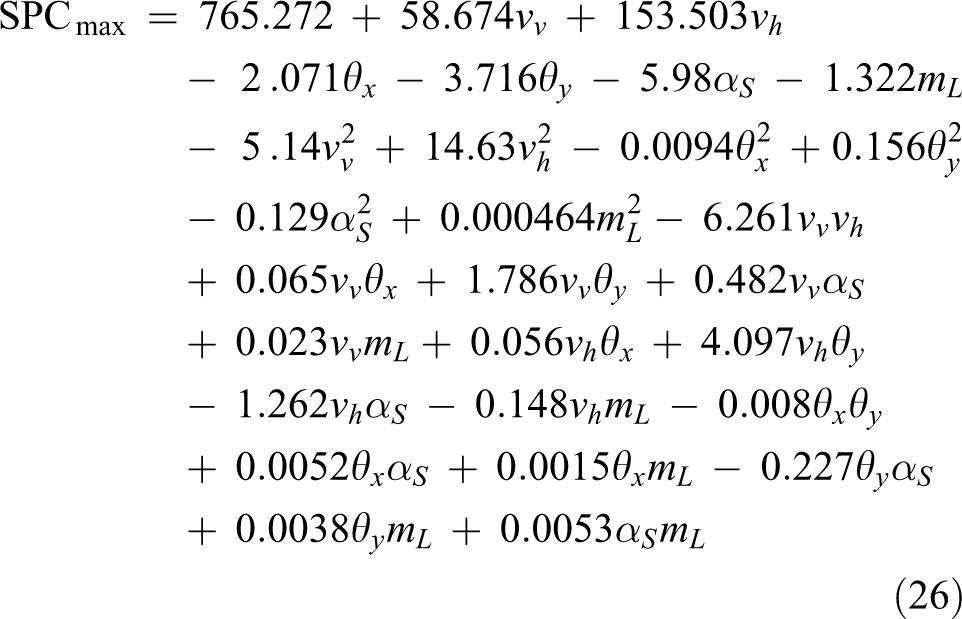
For each response, 128 simulation experiments are arranged by using the optimal LHS approach. Levels of each input factor are all located in the ranges listed in Table 5. Under every single sample point with a combination of specified values of input factors, the landing dynamics simulation is performed. Four sets of simulation results are eventually generated, which are then used to determine the unknown regression coefficients of the four response surface models by applying the least square method, respectively. Consequently, the second-order polynomial response surface model for each landing dynamics response is obtained, as shown in the following equations


Subsequently, ANOVA is implemented for each regression model, and the results are shown in Tables 6 to 9 (SS represents sum of squares and df represents degrees of freedom). Given the significance level α = 0.01, from the F-distribution table, we have the critical value F 0.01(27, 100) = 1.93, which is much smaller than the F-value of each regression model. This means we have 99% confidence that all regression models are significant. It can also be seen from the tables that all R 2 values are highly close to 1, which indicates each response surface model fits the relationship between its output and inputs well.
ANOVA table for RSM of D min.

RSM: response surface methodology; ANOVA: analysis of variance; SS: sum of squares; df: degrees of freedom.
ANOVA table for RSM of SPCmax.

RSM: response surface methodology; ANOVA: analysis of variance; SS: sum of squares; df: degrees of freedom.
ANOVA table for RSM of SSCmax.

RSM: response surface methodology; ANOVA: analysis of variance; SS: sum of squares; df: degrees of freedom.
ANOVA table for RSM of SSEmax.

RSM: response surface methodology; ANOVA: analysis of variance; SS: sum of squares; df: degrees of freedom.
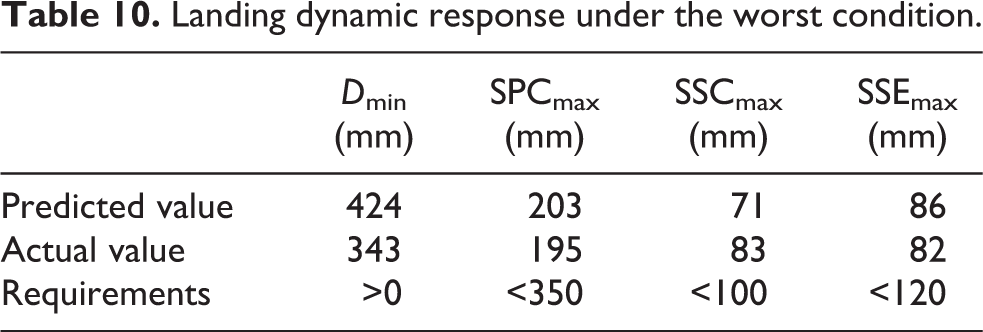
Taking advantage of the response surface models, the worst landing condition for each response can then be obtained by finding extremal solutions of equations (25) to (28) via a certain optimization algorithm, such as the sequential quadratic programming algorithm. Figure 15 demonstrates the results of the worst landing conditions for all landing dynamics responses, and Table 10 lists both predicted and real values of each response under the corresponding worst landing case. It seems that the deviation of each predicted value from its real value is acceptable, which proves the feasibility and effectiveness of the RSM.
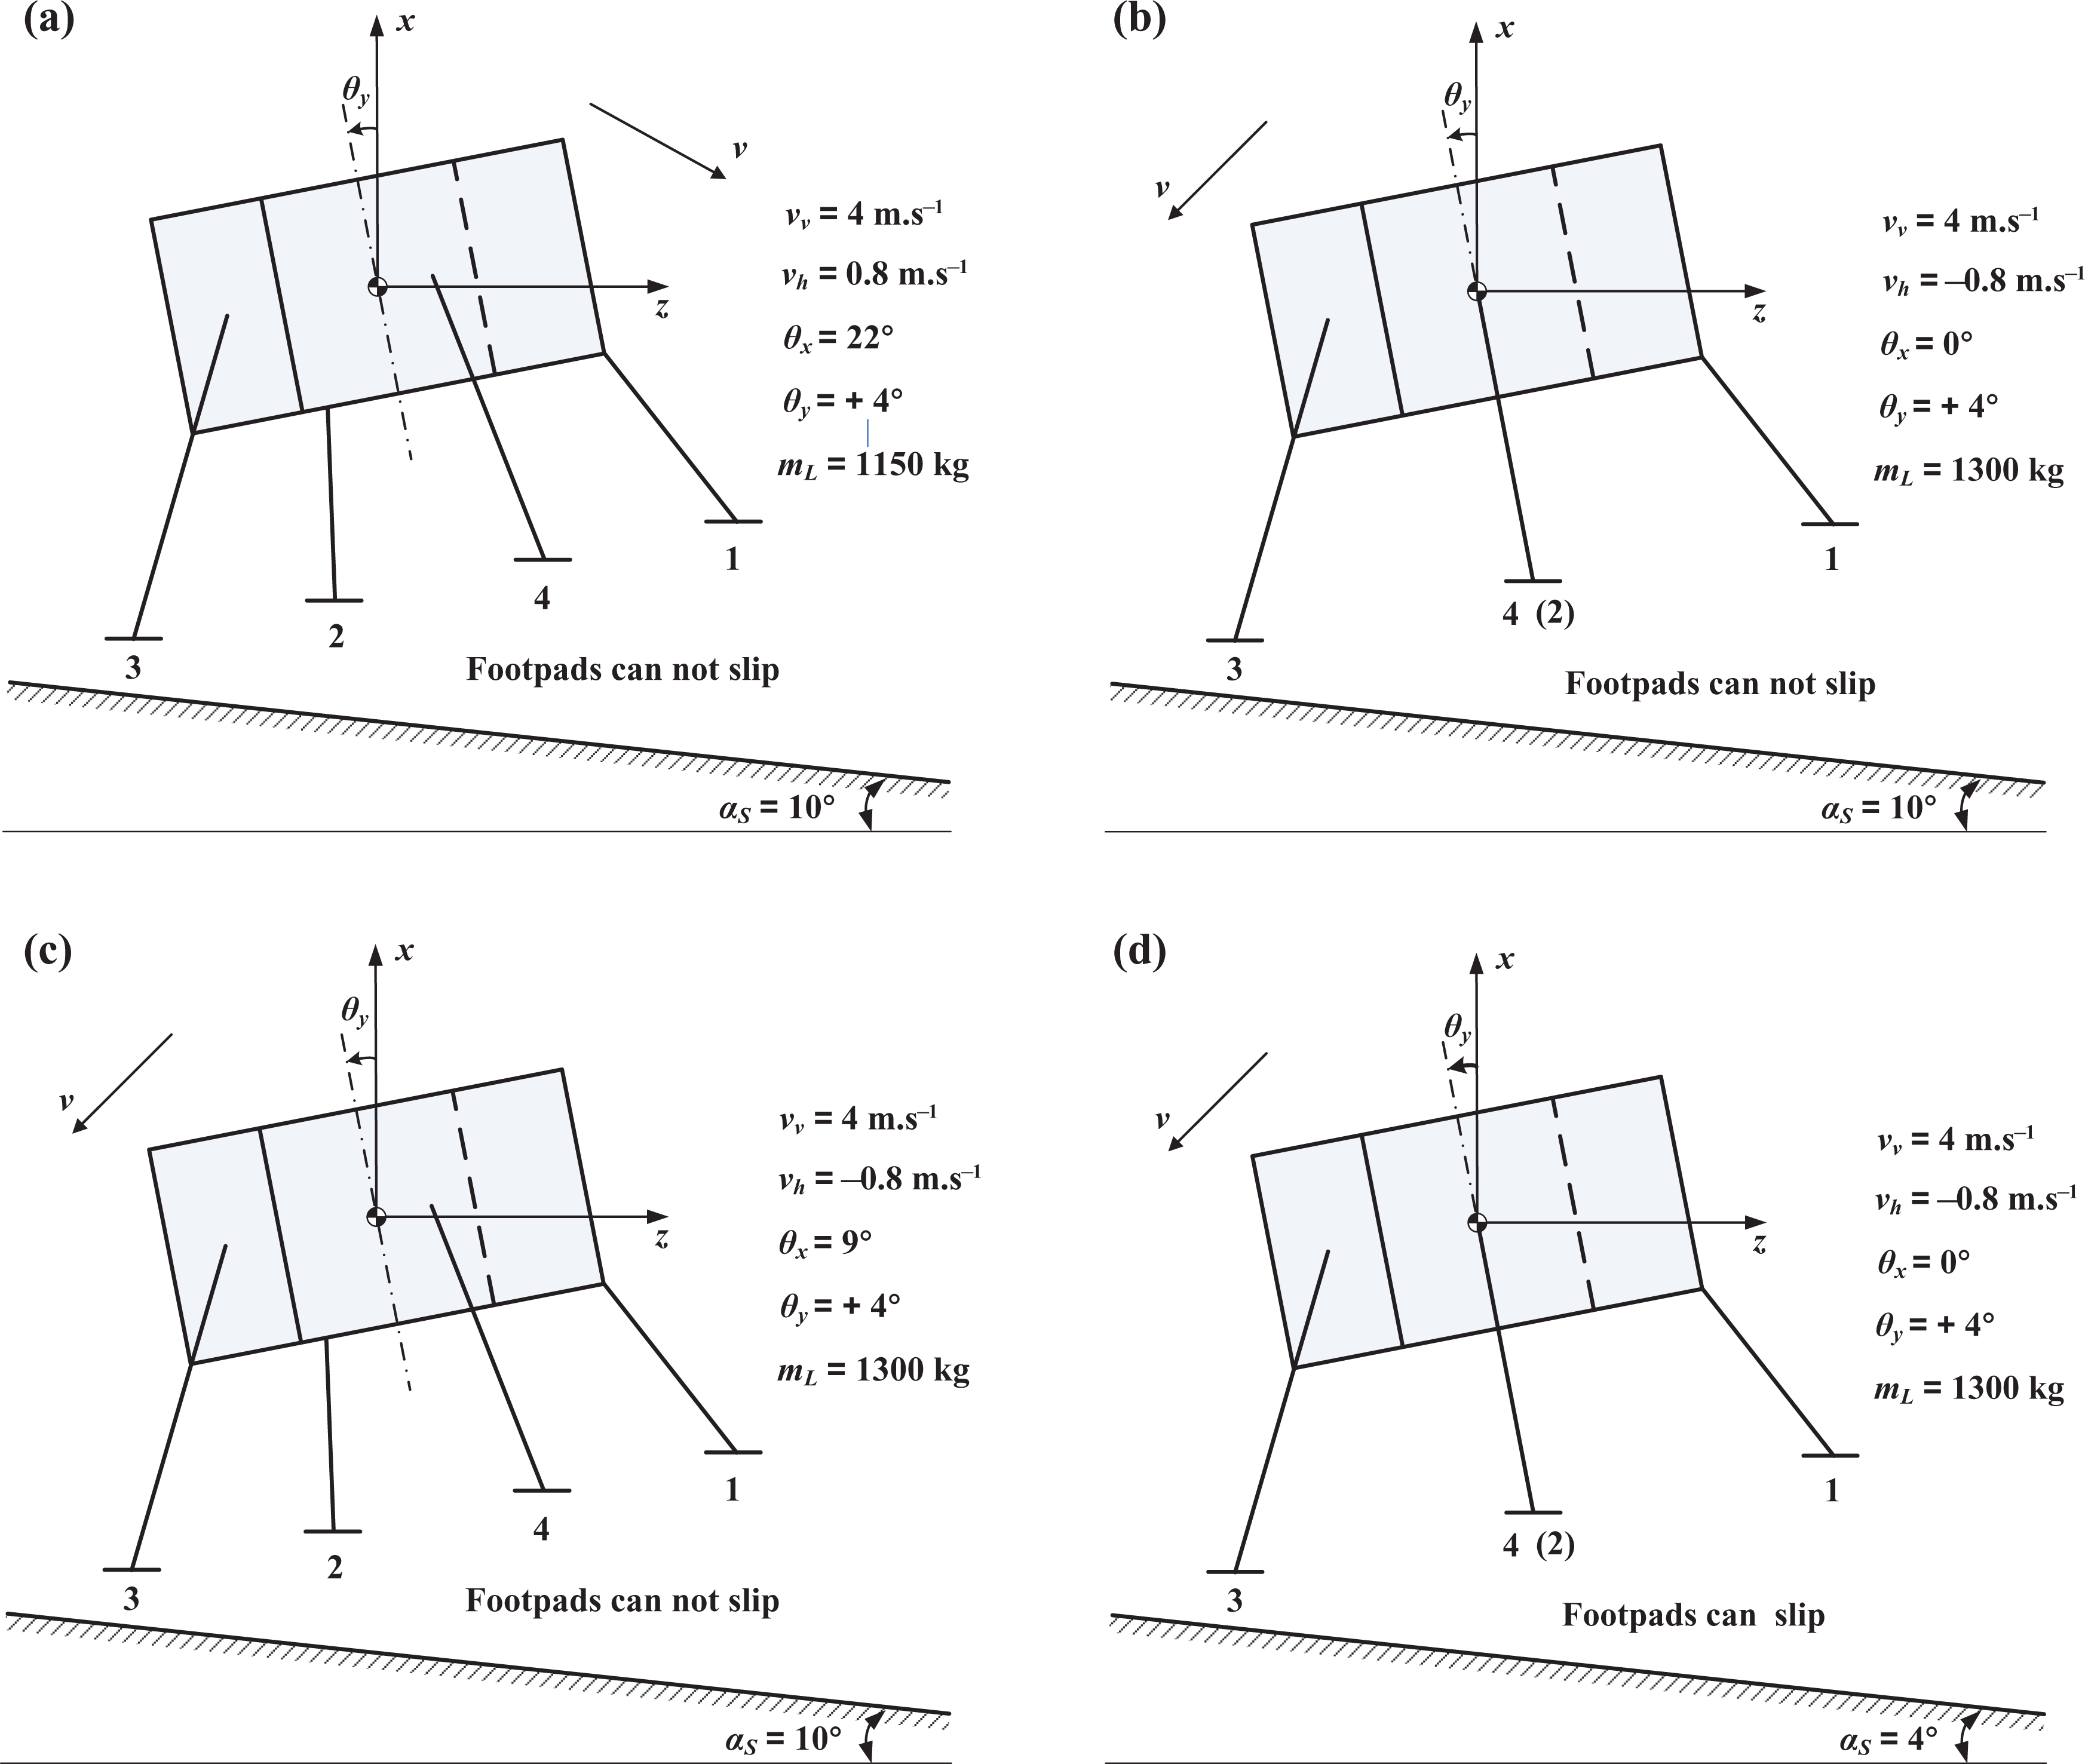
Worst sets of landing conditions. Worst landing condition for (a) vehicle toppling, (b) primary stroke, (c) secondary compression stroke, and (d) secondary extension stroke.
Landing dynamic response under the worst condition.
Landing stability boundaries
Initial velocities have great influences on the landing stability and are also the essential factors for determining when to shut down the engine and to fall onto the lunar ground. Hence, we attempt to find the envelope of initial velocities for assuring stable landings. Under each worst landing condition, we gradually increase the initial vertical velocity (vv ) and horizontal velocity (vh ) simultaneously while keeping other parameters constant. We keep performing the landing dynamics simulation until the lander overturns or any of the strokes exceeds the threshold value. Finally, the boundary curve for each landing response is acquired and plotted with a dotted line as shown in Figure 16. Subject to the constraints of the four boundary curves, the resulting overall boundary for stable landings is then constructed and plotted with solid lines as shown in Figure 16.

Landing stability boundaries.
The results show that, to ensure a stable landing in the premise that αS ≤ 10° and θy ≤ 4°, values of the initial vertical and horizontal velocities should be within the pentagon envelope in Figure 16. The maximum absolute values of the initial vertical and horizontal velocities should never exceed 5.6 and 1.1 m s−1, respectively.
Conclusion
In this article, an approach for studying the landing stability of lunar landers by employing the techniques of DOE and RSM has been proposed. Some useful conclusions are drawn as follows: A landing dynamics simulation model for the lunar lander has been built and verified by physical tests. The model enables us to evaluate the landing performances of the lander conveniently and is capable of performing plenty of landing experiments that are difficult or expensive to implement in reality. Based on the dynamics model, DOE is employed to arrange landing simulation experiments rationally. Trends and extents of input factors, such as vv
, vh
, θx
, θy
, αs
, and mL
, on output responses D
min, SPCmax, SSCmax, and SSEmax have been investigated with the least possible effort. The RSM has been proven feasible and effective to approximate the relationships between input factors and output landing dynamics responses. The worst landing condition for each landing stability response has been found with the help of response surface models. Under the worst landing conditions, landing stability boundaries measured by D
min, SPCmax, SSCmax, and SSEmax have been obtained, subject to which the envelope of initial vertical and horizontal velocities for stable landings is finally constructed. As for the lunar lander we study in this article, to assure stable landings, the initial vertical and horizontal velocities must not exceed 5.6 and 1.1 m s−1, respectively, in the premise that the slope αS
and the pitch angle θy
are less than 10° and 4°, respectively.
Footnotes
Declaration of conflicting interests
The author(s) declared no potential conflict of interest with respect to the research, authorship, and/or publication of this article.
Funding
The author(s) disclosed receipt of the following financial support for the research, authorship, and/or publication of this article: This work was supported by the National Natural Science Foundation of China (11202010 and 61340044).