
Abstract
A design optimization of deburring tools for intersecting holes is presented based on design of experiments and response surface methodology. A deburring tool with hemispherical cutter head mounted on a pivoted shaft was used to deburr intersecting holes easily and quickly. Due to the vibration of the tool during deburring, however, the surface of the deburred edge showed considerable irregularity. Tool dynamics was modeled with ADAMS software with the user-defined subroutines. Based on design of experiments and response surface methodology, the tool design was optimized with respect to tool vibration. Deburring tests with the optimized tool on Al6061-T6 specimens showed significant reduction in surface irregularity represented by an index value change from 1.3 to 0.7 mm.
Keywords
Introduction
Burrs are defined as residual protrusions on the edges of a machined component due to plastic deformation during machining. 1 They cause many problems such as assembly errors, dimensional errors, friction and undesirable particles, so they have to be removed. However, large burrs are difficult to remove, especially the drilling burrs on the edges of intersecting holes located deep in a material, as in the case of hydraulic manifolds.
Studies have been performed to understand and minimize drilling burrs in various ways. Uwe and Michale 2 found that the burr height increases with decreasing exit angle. Rajmohan and Palanikumar 3 and Segonds et al. 4 studied the drilling burr formation by experiments and reported that burr height and thickness increase with spindle speed and decrease with cooling. Pilny et al. 5 studied the effects of process parameters on the surface quality of drilled holes and burr size for aluminum sheets. Ramu and Mehta 6 studied the effects of drill bit and specimen geometry on burr formation in intersecting holes. Gaitonde et al. 7 defined the parameters influencing burr formation and proposed Taguchi optimization process to minimize burr size.
There are several methods of deburring. Chang et al. 8 reported that laser deburring is efficient with minimal invasion into the burr edge. In this regard, micro-electrical discharge machining9,10 has a merit similar to laser deburring. However, these processes are accompanied by thermal degradation of the workpiece, slow operation and time-consuming numerical control (NC) programming. Electrochemical deburring is useful for simultaneous deburring of multiple burr edges. Lee et al. 11 and Jeong et al., 12 however, reported unintended damages to functional surfaces due to electrochemical deburring. Barletta 13 and Yan et al. 14 reported that abrasive jet methods are efficient for small burrs in brittle materials. Ko et al. 15 and Kim and Kwak 16 reported that magnetic abrasive grinding gave a good surface finish of a deburred edge. Jang et al. 17 applied a new deburring process utilizing magneto-rheological fluid in the production of micro-molds. These abrasive methods are limited to micro-burrs, and the remnant abrasive particles may lead to other problems. Another method for the deburring of intersecting holes uses spring loaded cutters. Ton et al. 18 suggested other types of spring loaded cutters. Most spring loaded cutters are limited to burr edges with a mild curvature. Lee and Ko 19 reported performance evaluations of several types of spring loaded cutters.
Cutting seems to be more efficient than other methods, since it is simple and quick. To overcome the shortcomings of these existing tools, a new tool that can reach the burr edges located deep in a workpiece has to be designed. The cutting edge of the new tool should be small enough to cover the minimum radius of the curvature of the burr edge. It should also maintain the cutting angle and cutting edge exposure within their proper ranges during deburring. Based on these constraints, we proposed a deburring tool with hemispherical cutter head, 20 as shown in Figure 1(a). Used to the make the cutting edge, the hemispherical cutter head with a rectangular slot was mounted on a pivoted shaft and loaded by a set of leaf springs in the grip. The ranges of the rake angle and cutter face exposure were determined by the head and slot geometry. The tool was designed with a long shaft so that it could access the burr edges of deep-set holes. The spring preload and stiffness were selected by experimental trials. The cutter head was inserted into a small hole up to the burr edge and was rotated counterclockwise with return stroke.
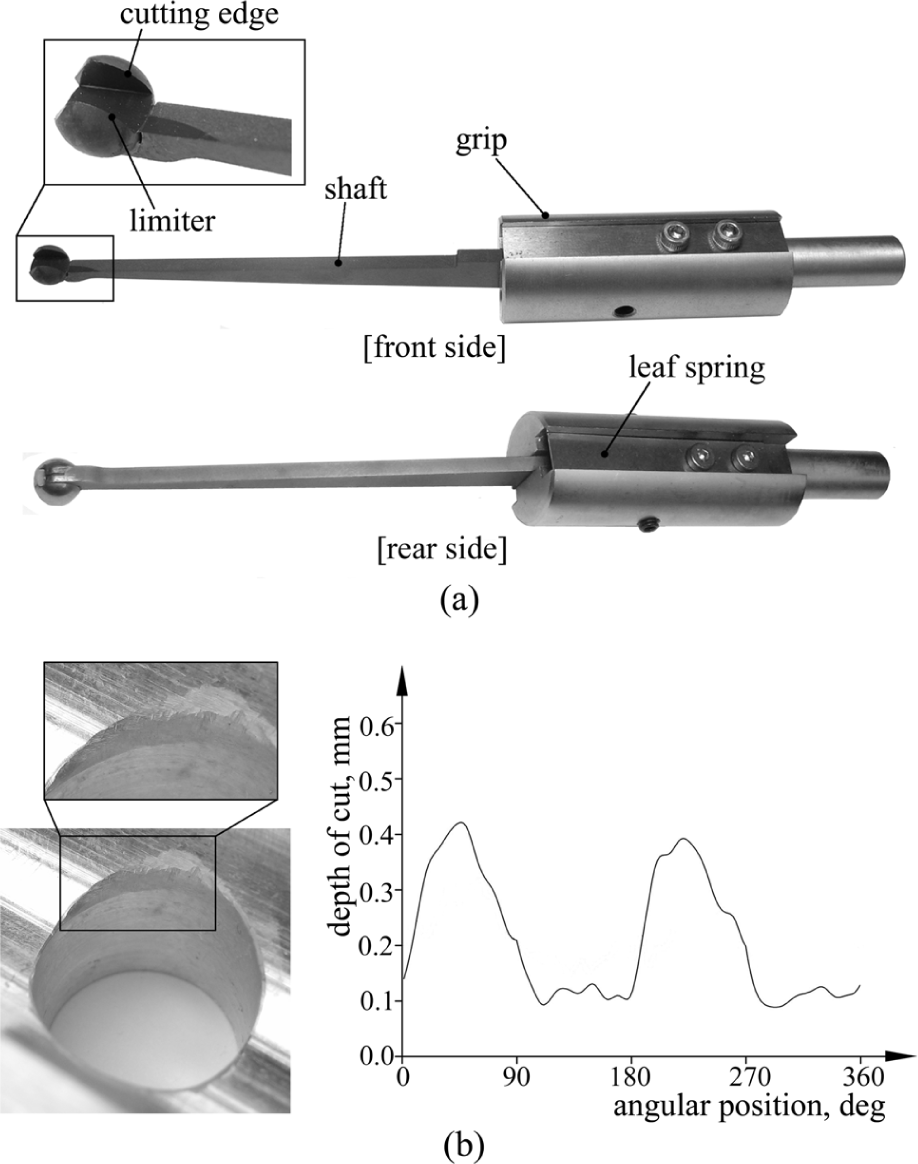
Previous design of deburring tool and deburring test result for an Al6061-T6 specimen: (a) deburring tool and cutter head and (b) deburred edge with surface irregularity and depth of cut versus angular position along the burr edge.
The previous tool could be applied to intersecting holes under certain intersecting conditions. However, the deburred edge had surface irregularity, as shown in Figure 1(b), which was due to the vibration of the cutter head. The long shaft with cutter head was pivoted in the grip and loaded by a leaf spring in the radial direction. The motion of cutter head during deburring was complex, inducing large angular displacements of the shaft with respect to the grip. At extremely low cutting speeds, a preset level of contact force in the radial direction was maintained between the cutter head and the workpiece. At higher speeds, however, the cutter head bounced off and returned to the workpiece repeatedly. Tool dynamics governed the surface irregularity of the deburred edge. Tests showed that the irregularity may be reduced by lowering the deburring speed. However, since deburring speed is important in practical applications, there is a need for improvement.
In this work, an attempt is made to characterize the tool vibration in terms of objective functions. A few candidate functions are suggested and reviewed for affordances and limitations. Based on a selected objective function, tool vibration is minimized via combined design of experiments (DOE) and response surface methodology (RSM). An index is suggested to represent the degree of surface irregularity. Significant reduction in the index value is obtained.
Design optimization with a tool dynamic model
Figure 2 shows the design optimization procedure of the deburring tool based on the tool dynamics. For systematic design and optimization, the rigid body dynamics of the deburring tool was modeled 21 using the rigid body dynamic code ADAMS/Solver. The interaction between the cutter head and the workpiece was modeled as a contact by the user-defined subroutines of ADAMS/Solver. To best represent the cutting force, a set of machining tests data on AL6061-T6 specimens and the penetration geometry of the cutting edge into the specimen were used. The cutting force was calculated using classical theories of machining 22 with the test data.
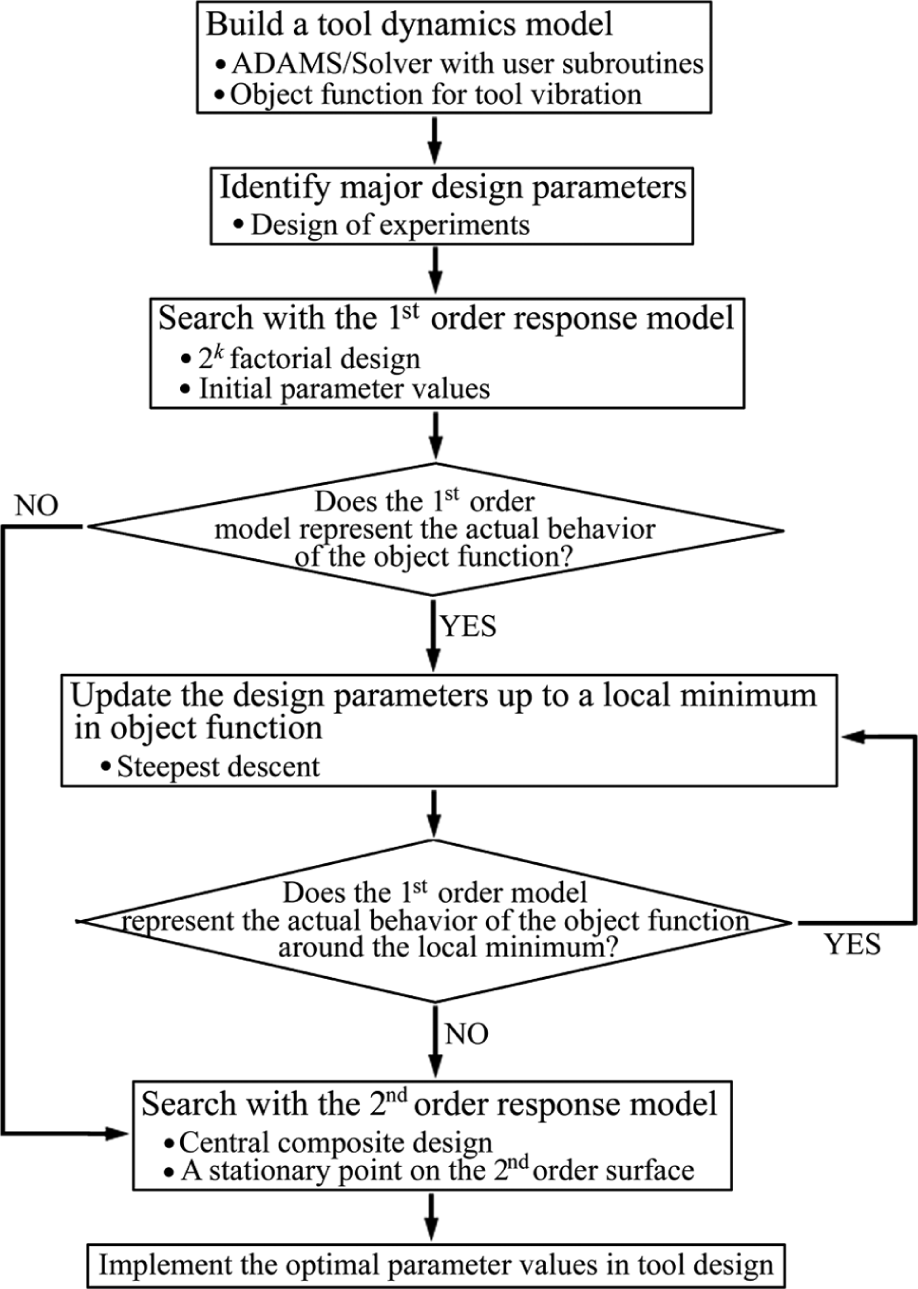
Design optimization procedure of the deburring tool with a tool dynamic model.
To assess the contributions of several design parameters of the deburring tool, DOE was employed. 23 Sensitivity analysis revealed that the natural frequency and lateral bending stiffness of the shaft were the dominant parameters governing the tool dynamics. The optimal values of the two parameters were obtained based on the RSM.24,25 Details are presented in the following.
Identification of major design parameters
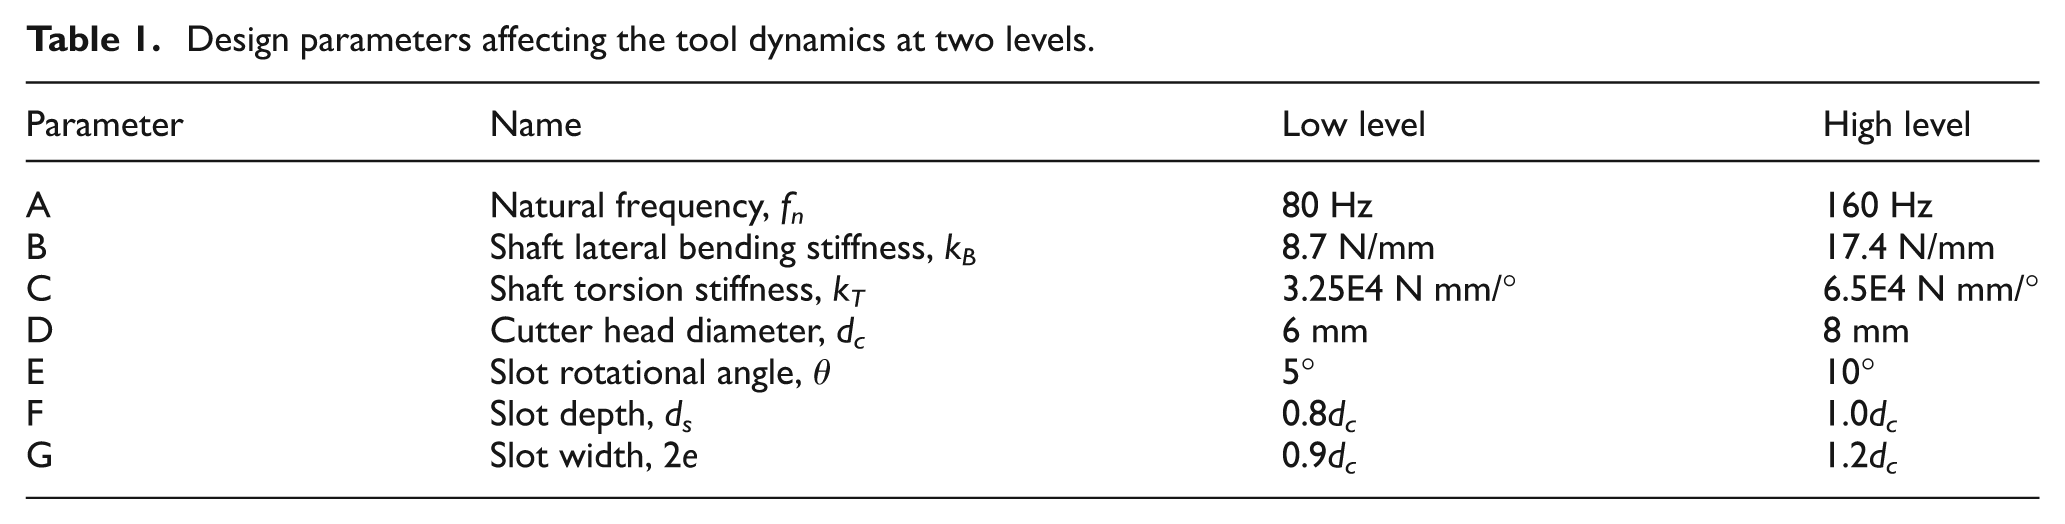
Before optimization, the major design parameters governing the tool dynamics have to be identified. DOE methodology has been used to identify the sensitivity of surface irregularity to each of the seven parameters listed in Table 1.
Design parameters affecting the tool dynamics at two levels.
To characterize the magnitude of tool vibration, an object function had been proposed as 21
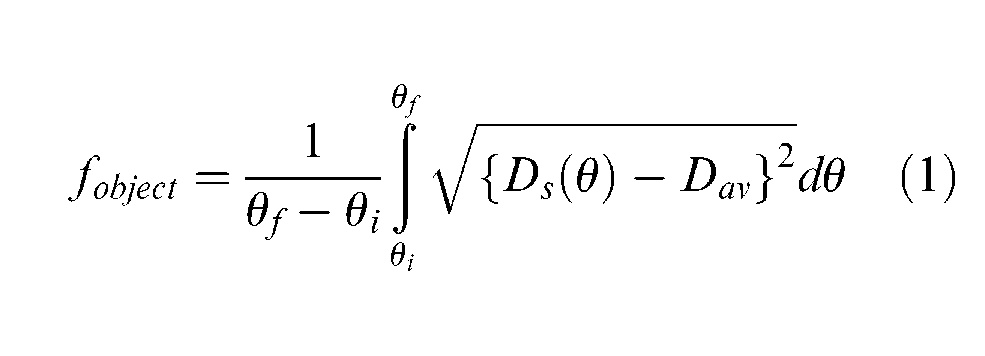
Here, θi and θf specify the angular range of observation. Ds(θ) represents the displacement of the leaf spring engaged with the shaft (see Figure 1) and Dav is the average value of leaf spring displacement. During deburring, the shaft with cutter head is pressed against the workpiece via a set of preloaded leaf springs, as shown in Figure 1(a). Larger depth of cut corresponds to smaller value of the leaf spring displacement. Higher value of the object function in equation (1) indicates higher degree of surface irregularity. The value of the object function for actual speed of revolution and feed rate can be obtained from the ADAMS simulation.
In Figure 3, an example of test curve for leaf spring displacement is presented from the tool dynamic simulation for a Al6061-T6 specimen with the primary hole diameter (d1) of 20 mm, the secondary hole diameter (d2) of 13 mm and intersecting angle (ϕ) of 90°. The tool has a cutter head diameter of 8 mm, axial feed rate (f) of 0.34 mm/s and speed of revolution (s) of 350 r/min. Figure 3(a) shows variation in the leaf spring displacement in comparison to its average value. Obviously, the average value of spring displacement does not represent the three-dimensional nature of cutter head path following the burr edge. Even though equation (1) is simple and easy to calculate, further improvements may be possible.
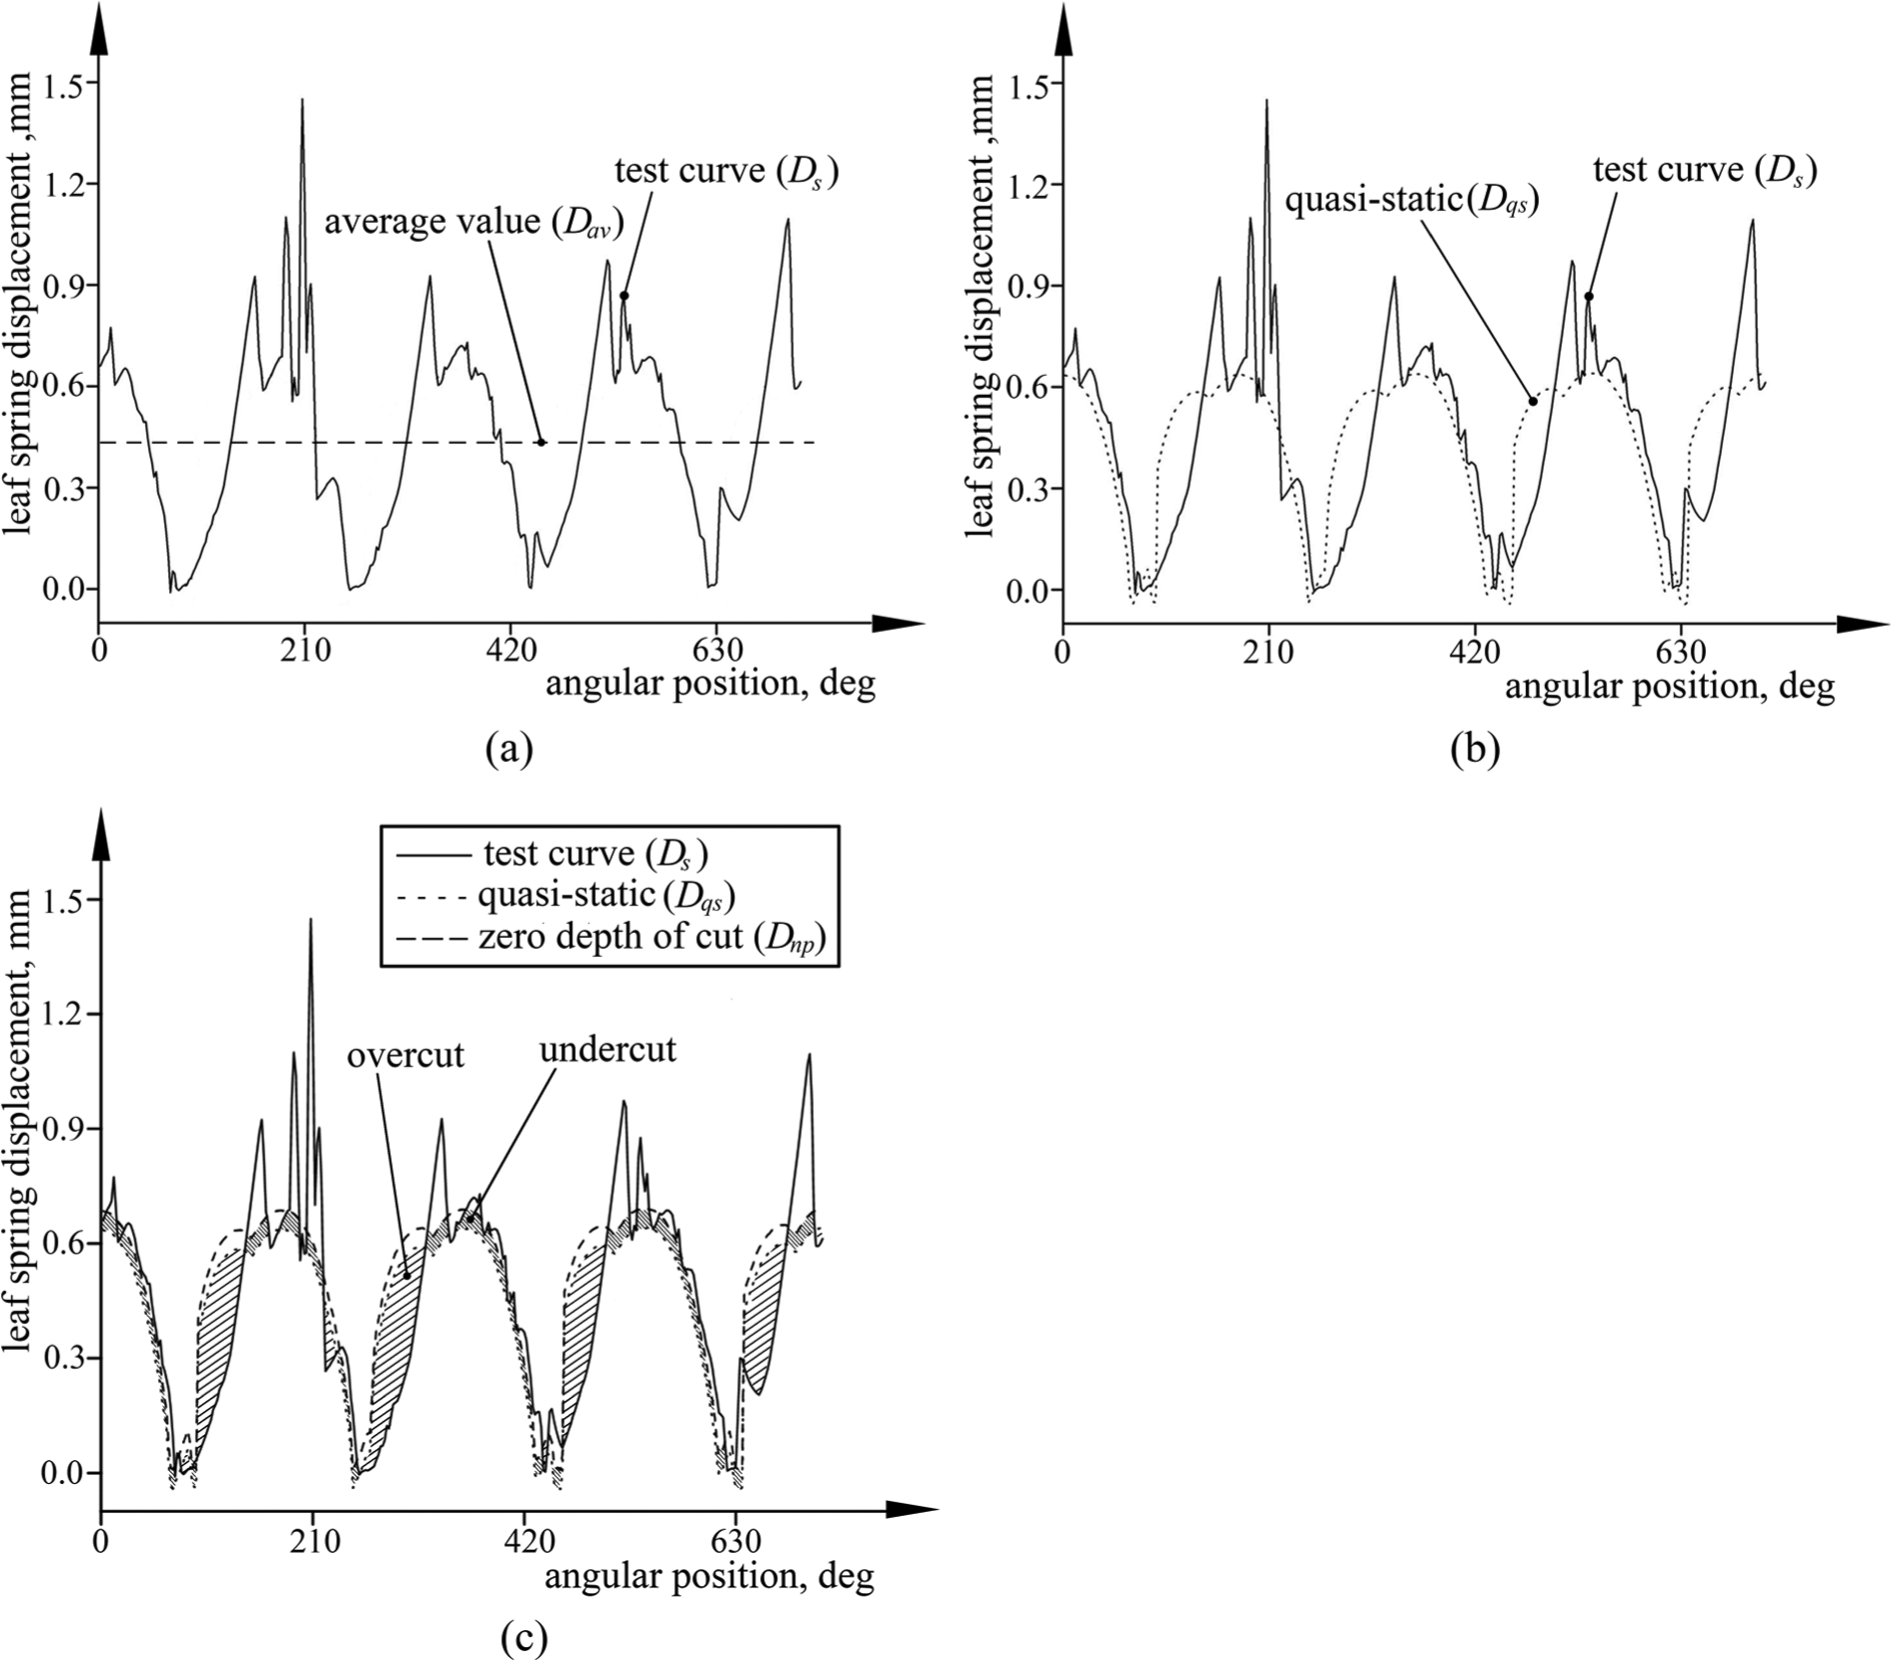
Variation in the leaf spring displacement versus angular position of the cutter head in comparison with (a) average value Dav, (b) quasi-static value Dqs and (c) Dqs and Dnp corresponding to zero depth of cut.
In Figure 3(b), leaf spring displacement (test curve) is compared with quasi-static leaf spring displacement Dqs, which corresponds to an extremely slow speed of revolution. In quasi-static operation, the cutter head is nearly free from vibration and the deburred surface is supposed to be smooth. Where the test curve lies beneath the quasi-static displacement Dqs curve, excessive cutting is expected. Reducing the excessive cutting may lead to the enhanced quality of deburred surface. Along this line, another object function may be suggested as
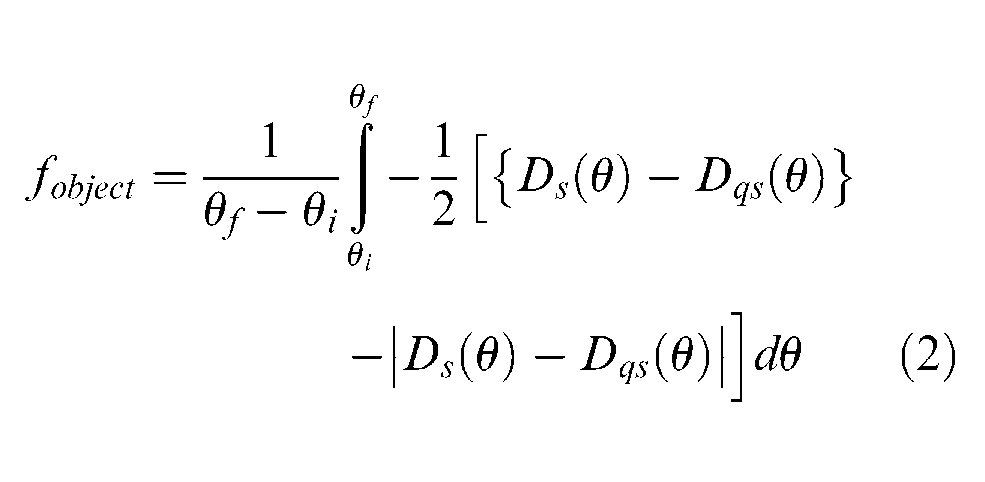
The object function in equation (2) has a limitation that it does not incorporate undercut with Ds smaller than Dqs. The local terrain of deburred surface may be anywhere between fresh uncut burr edge and the excessively cut surface beyond the quasi-static condition. The surface irregularity may be characterized between the uncut burr edge and the actual deburred surface. Since it is not possible to characterize the topology of actual burr exactly, an alternative is to ignore the burr topology and choose an idealized uncut burr edge defined from the geometry of intersecting holes. The leaf spring displacement Dnp corresponding to this idealized uncut burr edge can be obtained from the tool and specimen geometry. The leaf spring displacement Dnp corresponds to zero depth of cut with fictitious infinite shear strength of the specimen.
When the leaf spring displacement Ds is greater than Dnp, there is no contact between the cutter head and the burr edge. When Ds is between Dnp and Dqs, undercut is expected with respect to the quasi-static operation while overcut is expected with Ds smaller than Dqs. The degree of undercut and overcut with respect to the quasi-static operation may be expressed as
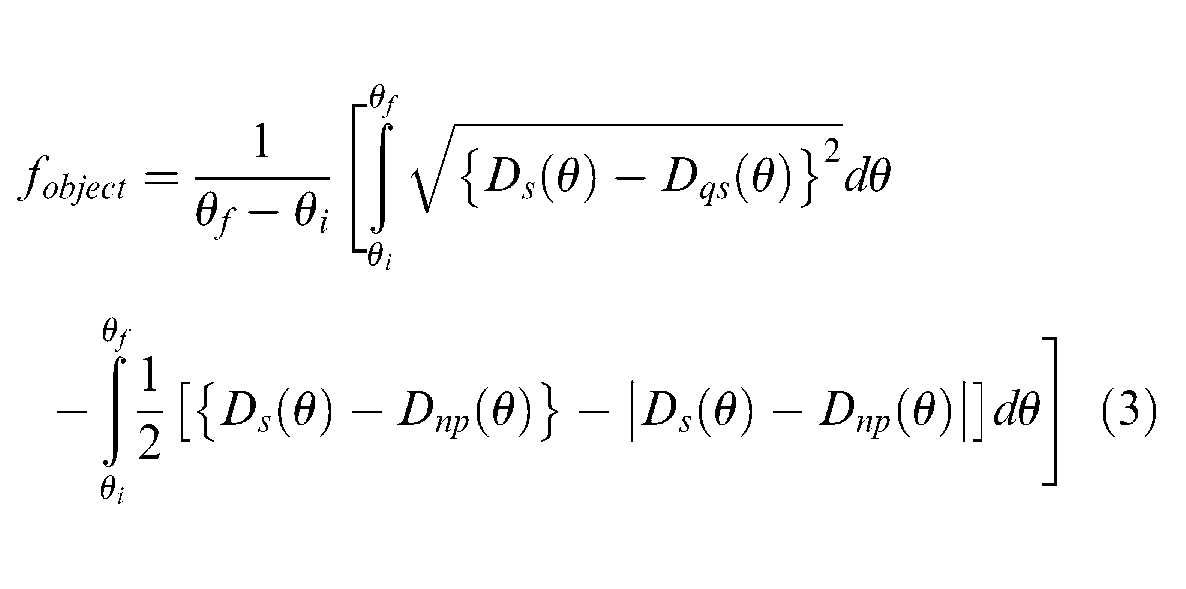
The object function in equation (3) is an improvement over the ones in equations (1) and (2) in that the entire range of overcut and undercut conditions is incorporated with reference to a quasi-static smooth operation. Since the overcut and undercut of the deburring operation are a result of tool vibration, another alternative is to consider the degree of tool vibration with respect to the quasi-static operation such as
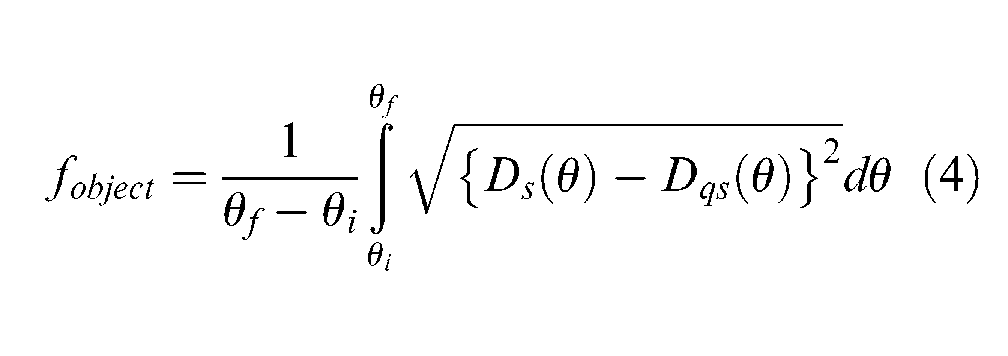
The object function in equation (4) does not distinguish between overcut and undercut, but it represents the degree of vibration magnitude in a relatively simple form, which lends itself to easier calculation without laborious efforts to calculate Dnp data.
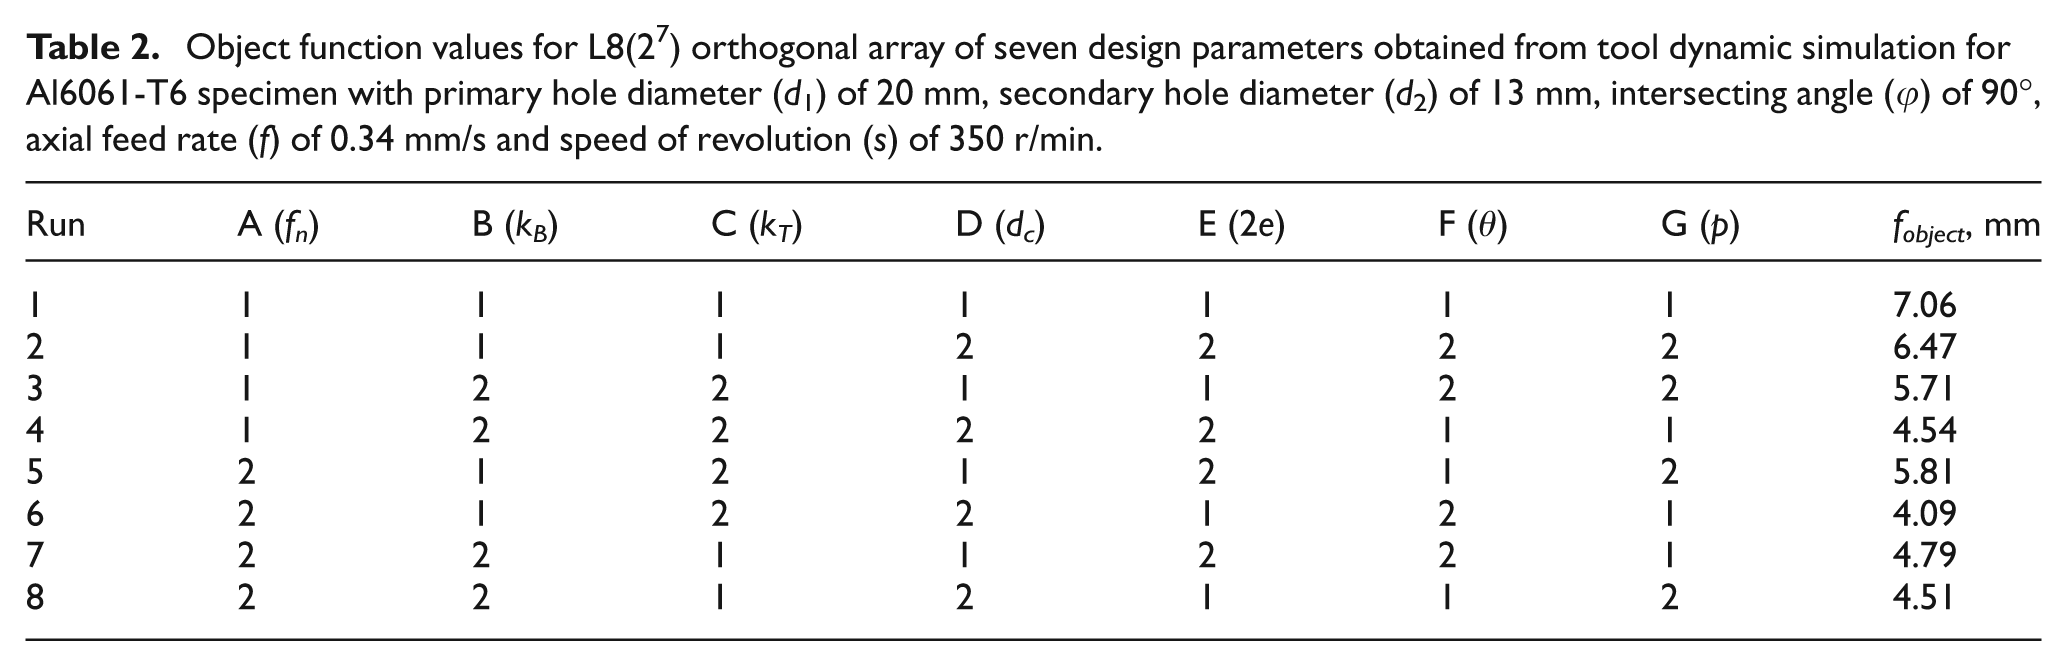
The tool dynamic simulation results are summarized in Table 2 in terms of object function values for L8(27) orthogonal array of the seven design parameters in Table 1. The sensitivity of the object function value to each of the design parameters is shown in Figure 4. The magnitude of tool vibration is most sensitive to natural frequency (fn), shaft lateral bending stiffness (kB) and cutter head diameter (dc). The analysis suggests that the maximum cutter head diameter should be chosen. Geometrically, the cutter head radius should be less than the minimum radius of curvature of the burr edge. Moreover, the cutter head needs to approach the burr edge without scratching the inner surface of the access hole, and thus, a certain level of clearance between the cutter head and the access hole is required. The cutter head is made of a standard, high-speed steel ball, so the choice of the cutter head diameter is limited. Considering these constraints, the maximum allowable cutter head diameter for specimens with primary hole diameter (d1) of 20 mm, secondary hole diameter (d2) of 13 mm and intersecting angle (ϕ) of 90° is 8 mm. Furthermore, the tool vibration seems to be less sensitive to the cutter head slot geometry, which is represented by slot rotation angle, slot depth and slot width. Figure 4 indicates that higher natural frequency and higher lateral bending stiffness as well as higher torsional stiffness of the shaft are preferable. The natural frequency refers to the angular motion of the shaft with respect to the pivot pin in the grip (see Figure 1). Higher natural frequency is related to the rotational inertia of the shaft about the pivot pin and is related to the leaf spring stiffness. The lateral bending stiffness and torsional stiffness of the shaft are governed by the length and cross section of the shaft. It is assumed here that there is sufficient design freedom to fix the level of torsional stiffness and to pursue optimization with respect to the two most dominant parameters of natural frequency and lateral bending stiffness. Along this line, the following design optimization is based on the preset values of the less dominant parameters: shaft torsional stiffness of 65,000 N mm/°, slot rotation angle of 5°, slot depth of 4 mm and slot width of 3.6 mm.
Object function values for L8(27) orthogonal array of seven design parameters obtained from tool dynamic simulation for Al6061-T6 specimen with primary hole diameter (d1) of 20 mm, secondary hole diameter (d2) of 13 mm, intersecting angle (ϕ) of 90°, axial feed rate (f) of 0.34 mm/s and speed of revolution (s) of 350 r/min.
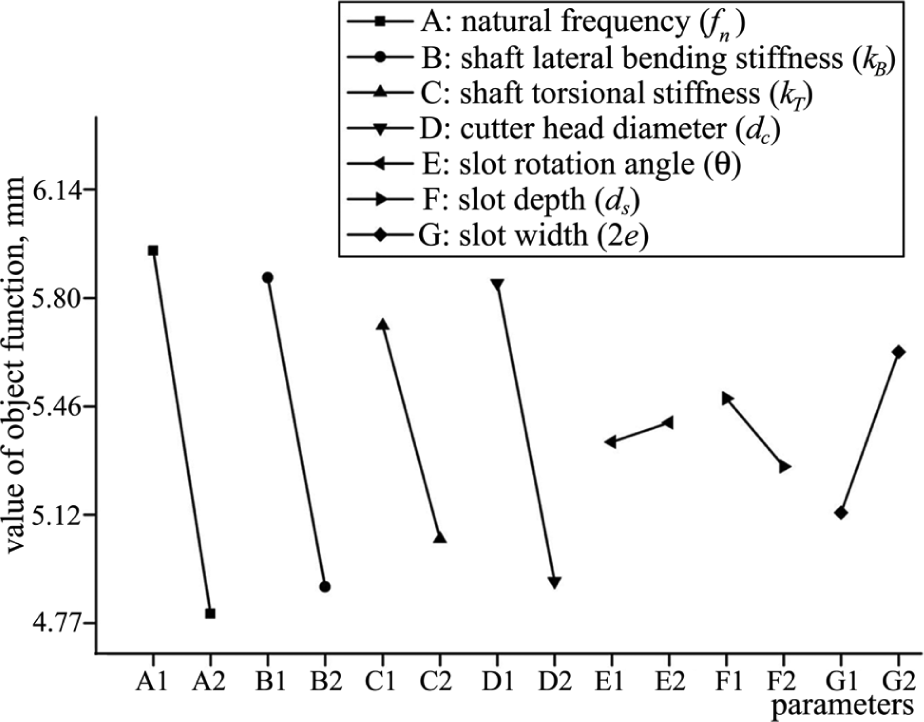
Mean value plot of the object function for each of the seven design parameters in Table 2
Optimization of major design parameters
Analysis of a fitted first-order surface
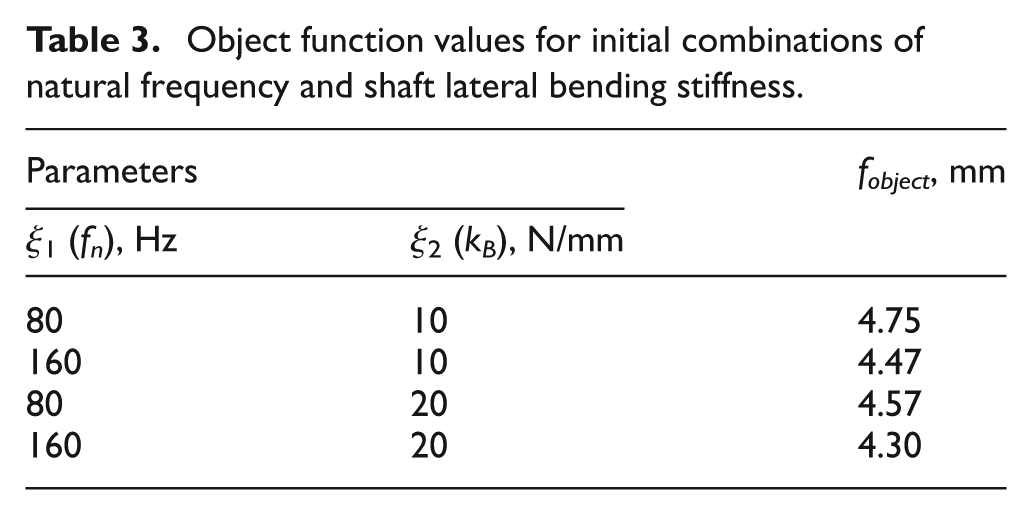
Based on the sensitivity analysis of DOE, natural frequency ξ1 and shaft lateral bending stiffness ξ2 were identified as the two major design parameters affecting tool vibration, which is represented by the object function fobject in equation (4). Optimal values of these two parameters were obtained using RSM in conjunction with tool dynamic simulations. To conform to the terminology of RSM, the simulations will be stated as experiments in the following. The initial set of experiments was chosen with reference to the DOE: 80 and 160 Hz for ξ1 and 10 and 20 N/mm for ξ2. The object function values for each of the four combinations of ξ1 and ξ2 values are listed in Table 3.
Object function values for initial combinations of natural frequency and shaft lateral bending stiffness.
From Table 3, the first-order model of the object function is
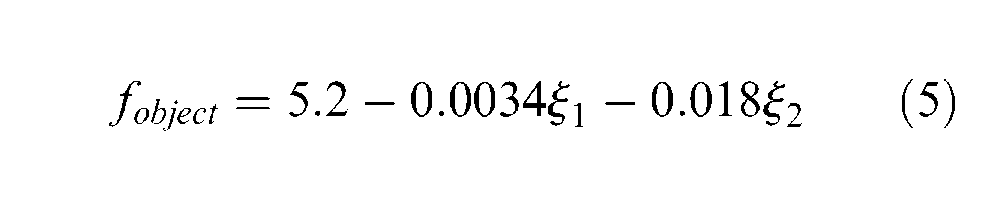
The value of F-statistics for equation (5) is 51.38. The table value of F-statistics when the degrees of freedom of regression and residual are 2 and 5, respectively, is F0.001,2,5 = 13.27. 25 The coefficient of determination R2 for equation (5) is 0.95. Since the F-statistics value is greater than the table value, equation (5) is accurate within 1% error.
The bilinear equation (5) represents the domain outside the optimum point. To approach the optimum point efficiently, sequential experiments along the path of steepest ascent are performed. In equation (5), the largest coefficient is 0.018 for ξ2 and the experimental step size vector (
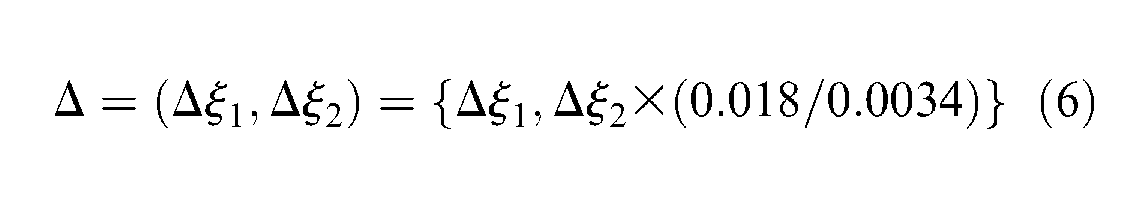
The step size of the natural frequency (
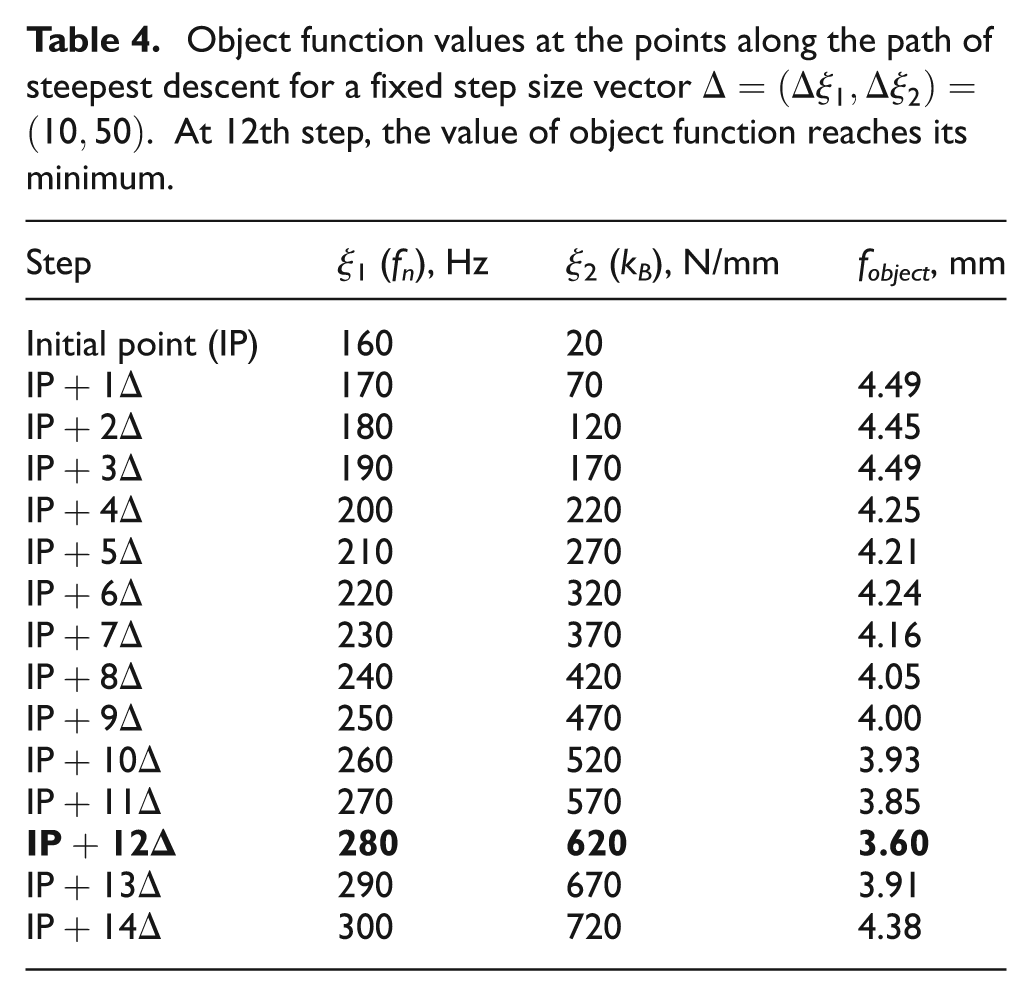
Object function values at the points along the path of steepest descent for a fixed step size vector
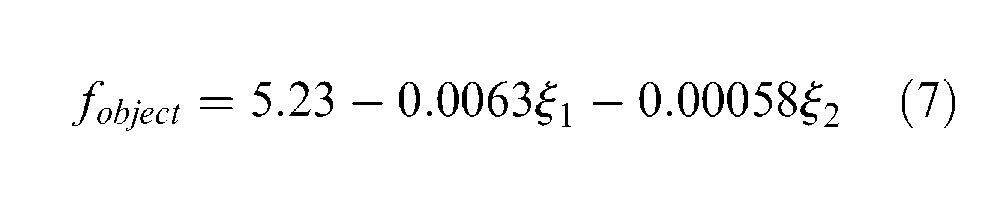
The object function values about the first approximate optimum point are calculated in Table 5, and the first-order model of the object function is
Object function values at four points about the first local minimum of (280 Hz, 620 N/mm) for the first-order response model.
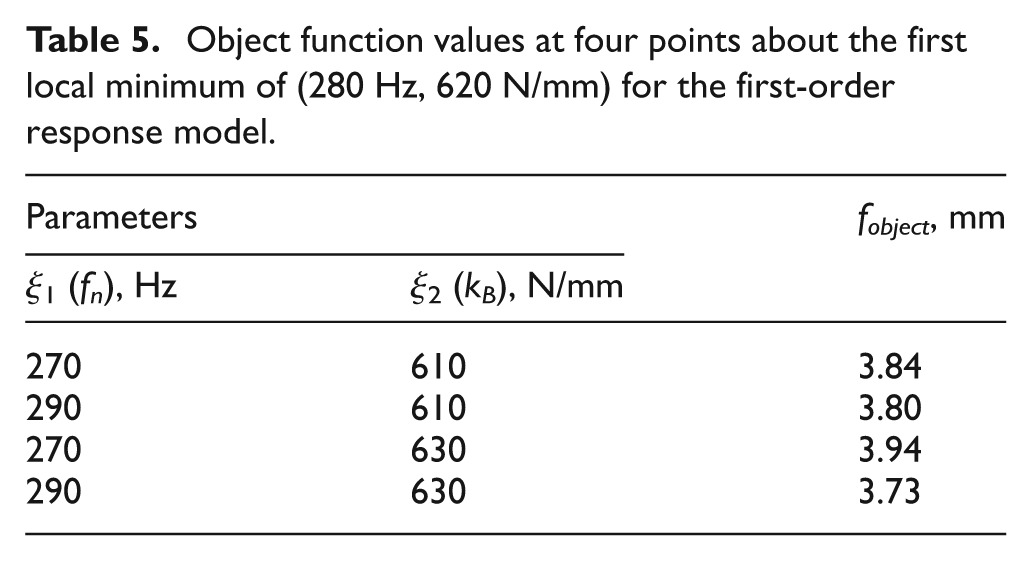
For equation (7), the value of R2 is 0.65 and the value of F-statistics is 4.7. The table value of F-statistics is given as F0.001,2,5 = 13.27. Since the F-statistics value for equation (7) is less than its table value and the value R2 is far from 1.0, the first-order model of equation (7) does not represent the actual behavior of the object function. This means that the optimum point is within the domain of the four points listed in Table 5.
Fitting a second-order response surface and determining the stationary point of optimum
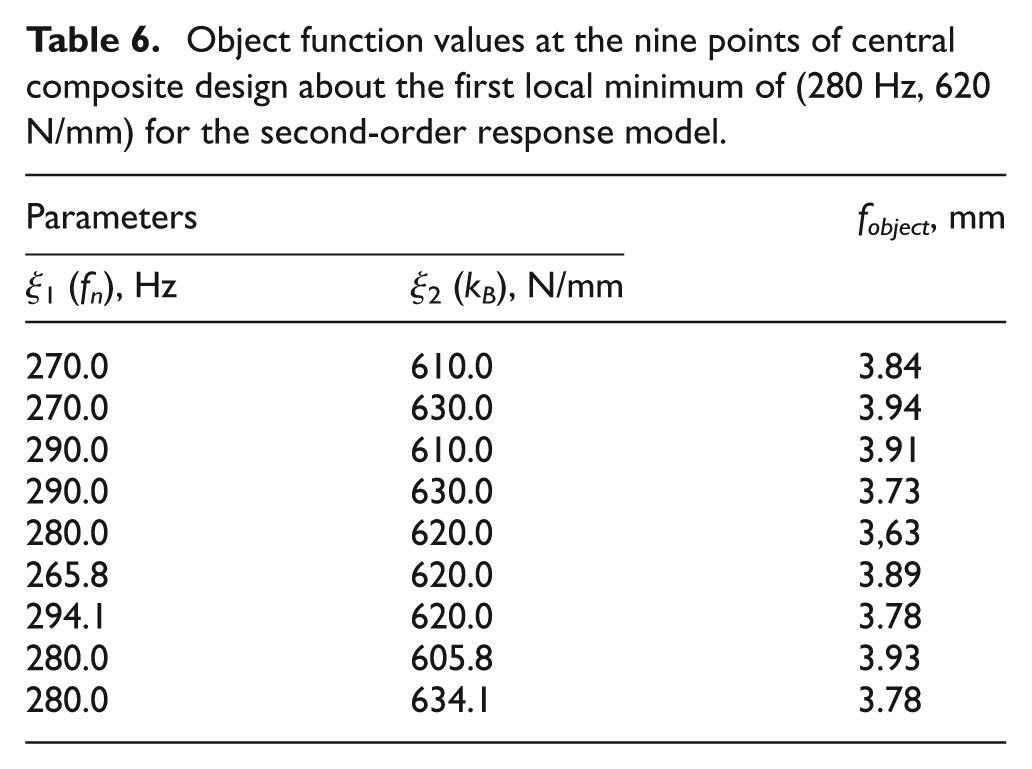
To fit a second-order response surface to the data of the object function, the central composite design of DOE was applied. Using the values of the object function in Table 6, the fitted second-order model is
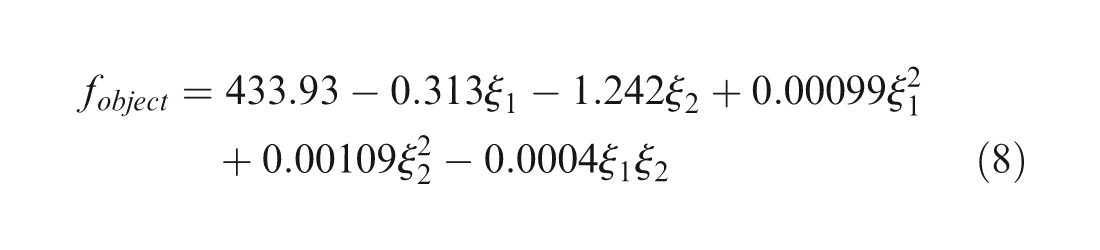
Object function values at the nine points of central composite design about the first local minimum of (280 Hz, 620 N/mm) for the second-order response model.
For equation (8), the value of F-statistics is 26.23. The table value of F-statistics when the degrees of freedom of regression and residual are 5 and 7, respectively, is F0.001,5,7 = 7.46. The value of R2 for equation (8) is 0.949, which is close to 1.0. Therefore, equation (8) is accurate within 1% error. From equation (8), the stationary point of the optimum is (282.3 Hz, 621.6 N/mm). Figure 5 shows the object function near the optimum point.
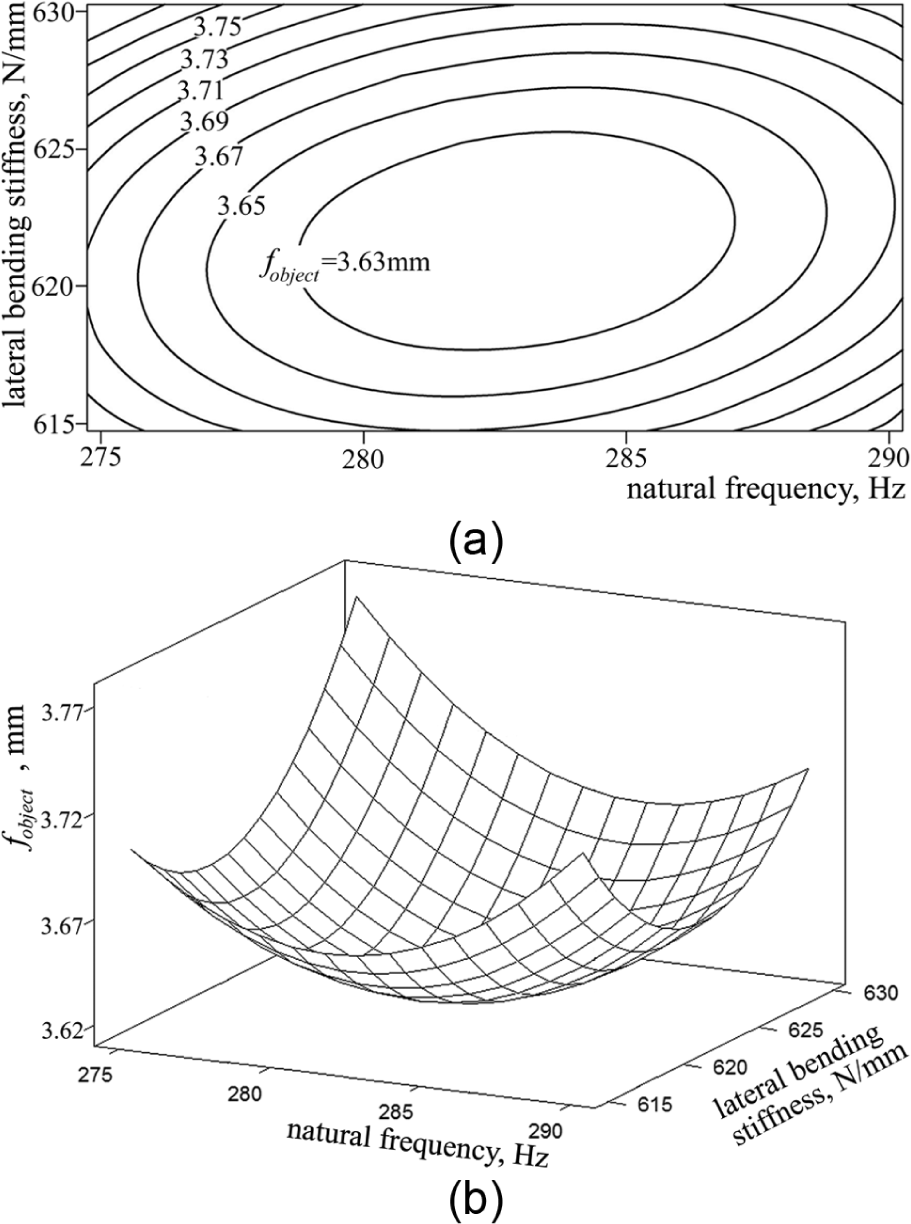
Plots of the object function about the optimum point of (282.3 Hz, 621.6 N/mm): (a) contour plot and (b) surface plot.
New design of the deburring tool
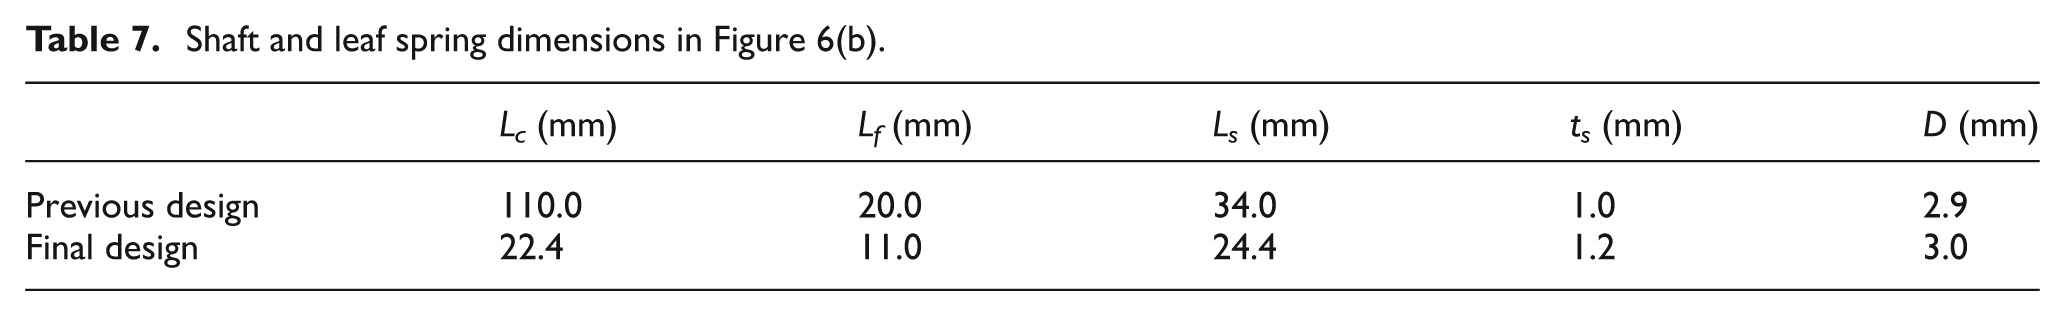
Figure 6 shows the new design corresponding to the optimized values of natural frequency and shaft lateral bending stiffness. The length of the shaft is significantly shortened to increase the natural frequency and lateral bending stiffness. In the previous design, the shaft was slender and long so it had easy access to the burr edge in deep holes, but the tool dynamics with respect to the surface irregularity of the deburred edge was overlooked. In the final design, the grip itself became slender to allow easy access to the burr edges in deep holes. The radial extremities of the rectangular slot with respect to the grip axis were ground smooth to prevent scratches on the inner face of the access holes. Figure 6(b) shows the shaft and leaf spring geometries of the new design in comparison to the previous design. Spring and shaft dimensions are listed in Table 7.
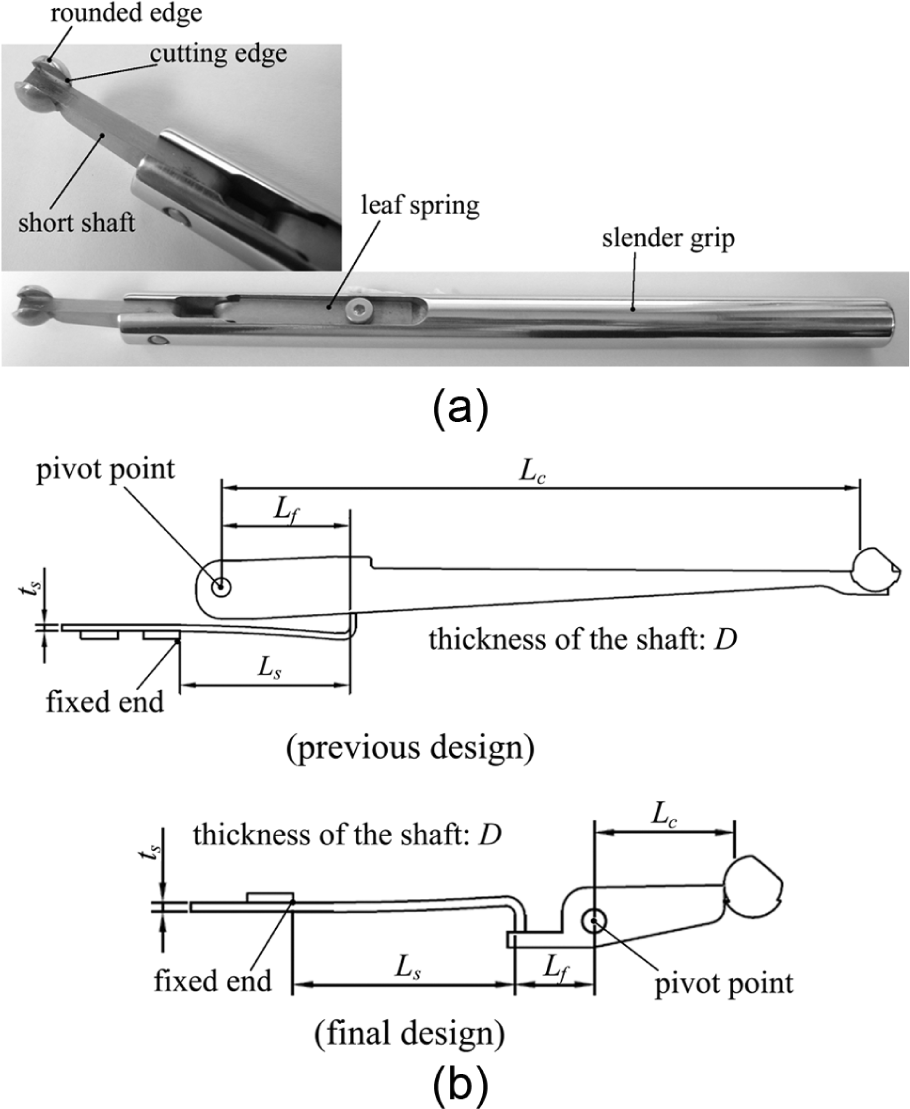
New design of deburring tool: (a) assembly and cutter head and (b) shaft and leaf spring configuration compared with the previous design with the dimensions listed in Table 7.
Shaft and leaf spring dimensions in Figure 6(b).
Deburring tests were performed on Al6061-T6 specimens with the test setup shown in Figure 7. The primary hole was cut along the slot of a wedge by a ball end mill and then the secondary hole was drilled from the bottom. The specimen was fastened on the bed of a three-axis machining cutter with the bottom up. Then the deburring tool was inserted into the secondary hole without rotation up to the center of the primary hole and was subsequently rotated counterclockwise with the retreat stroke until the cutter head passed through the burr zone. The rotational speed (s) and axial feed rate (f) were 350 r/min and 20 mm/min (f/s = 0.06 mm/rev), respectively. No coolant was used.
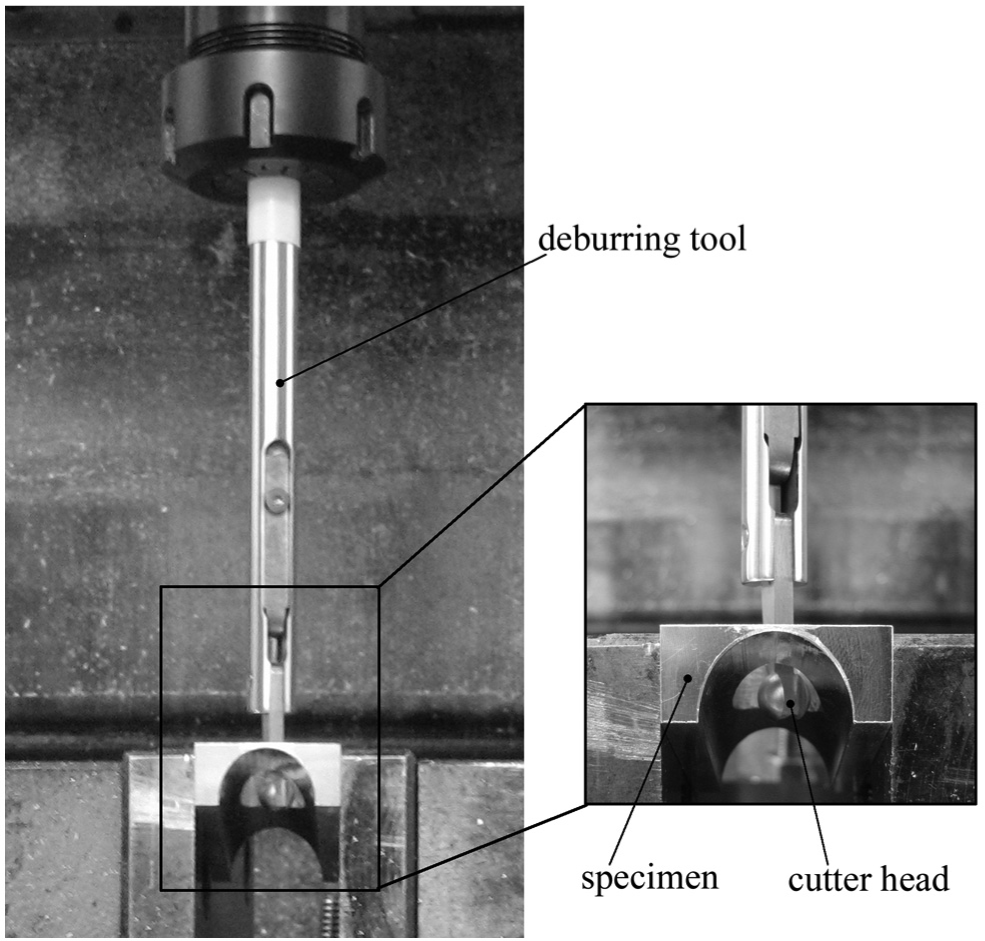
Test setup for the new deburring tool in Figure 6 with Al6061-T6 specimens.
Figure 8 shows the test results of new design for different combinations of primary hole diameter, secondary hole diameter and intersecting angle. Figure 8 also shows the test results of the previous design to compare with the result of the new design. In all the cases, the new tool gave more uniform depth of cut than the previous tool and reduced the surface irregularity.
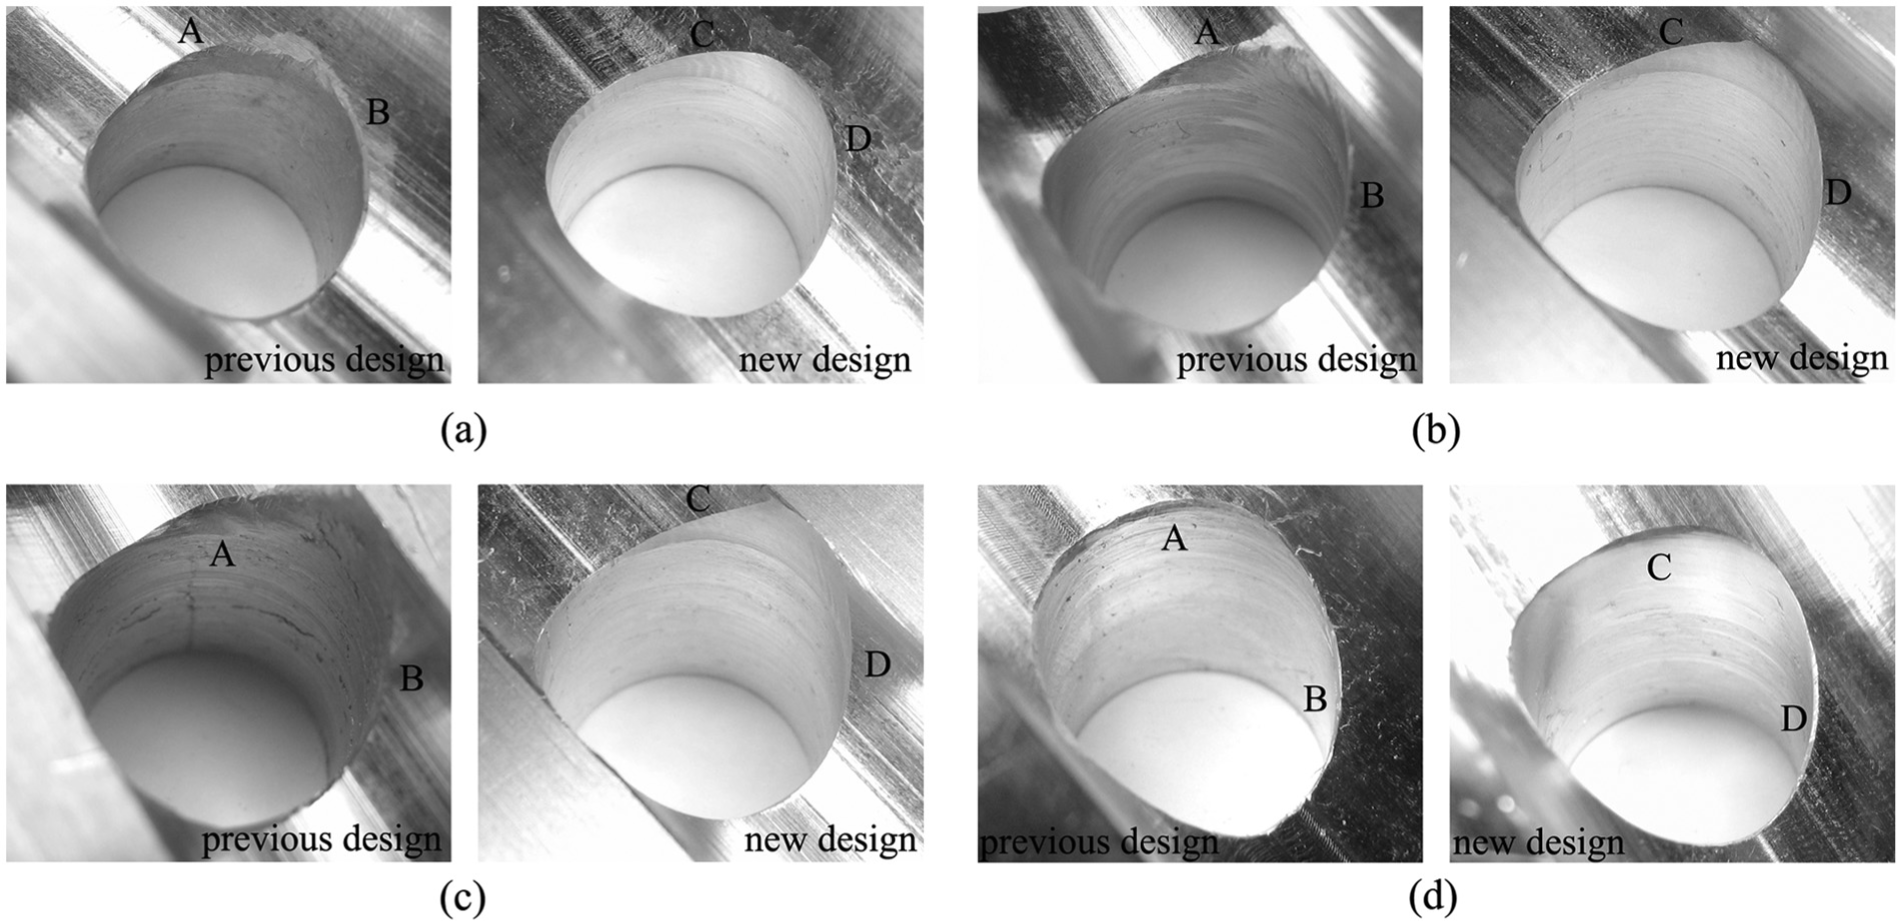
Comparison of deburred edges between tools of the previous design and the new design: (a) d1 = 20 mm, d2 = 13 mm and ϕ = 90°; (b) d1 = 16 mm, d2 = 13 mm and ϕ = 90°; (c) d1 = d2 = 13 mm and ϕ = 90° and (d) d1 = 20 mm, d2 = 13 mm and ϕ = 60°.
Three-dimensional surface scanning was performed on the deburred edges of the test specimens to measure their surface irregularity with the steroSCAN3D equipment of Breuckmann GmbH. Scanning data were obtained by the miniaturized projection technique (MPT) method using 5 megapixel, 0.007 mm resolution cameras.
Figure 9 shows the variations in the depth of cut 20 versus angular position on the deburred edge of the specimens with respect to the hole axis. Positions A–D in Figure 9 are also marked on the graphs in Figure 8. A positive depth of cut at all the positions on the deburred edge indicates complete removal of burrs. The depth of cut varies at 2 cycles per revolution since the geometry of the burr edge is symmetric about the plane containing the axes of the intersecting holes. As the deburring tool rotates counterclockwise, the depth of cut is at its maximum at points A and C, where the cutter head enters the material, and is minimum at points B and D, where the cutter head exits the material. For each of the four cases in Figure 8, the depth of cut versus angular position curve for the new design is more uniform than that for the previous design.
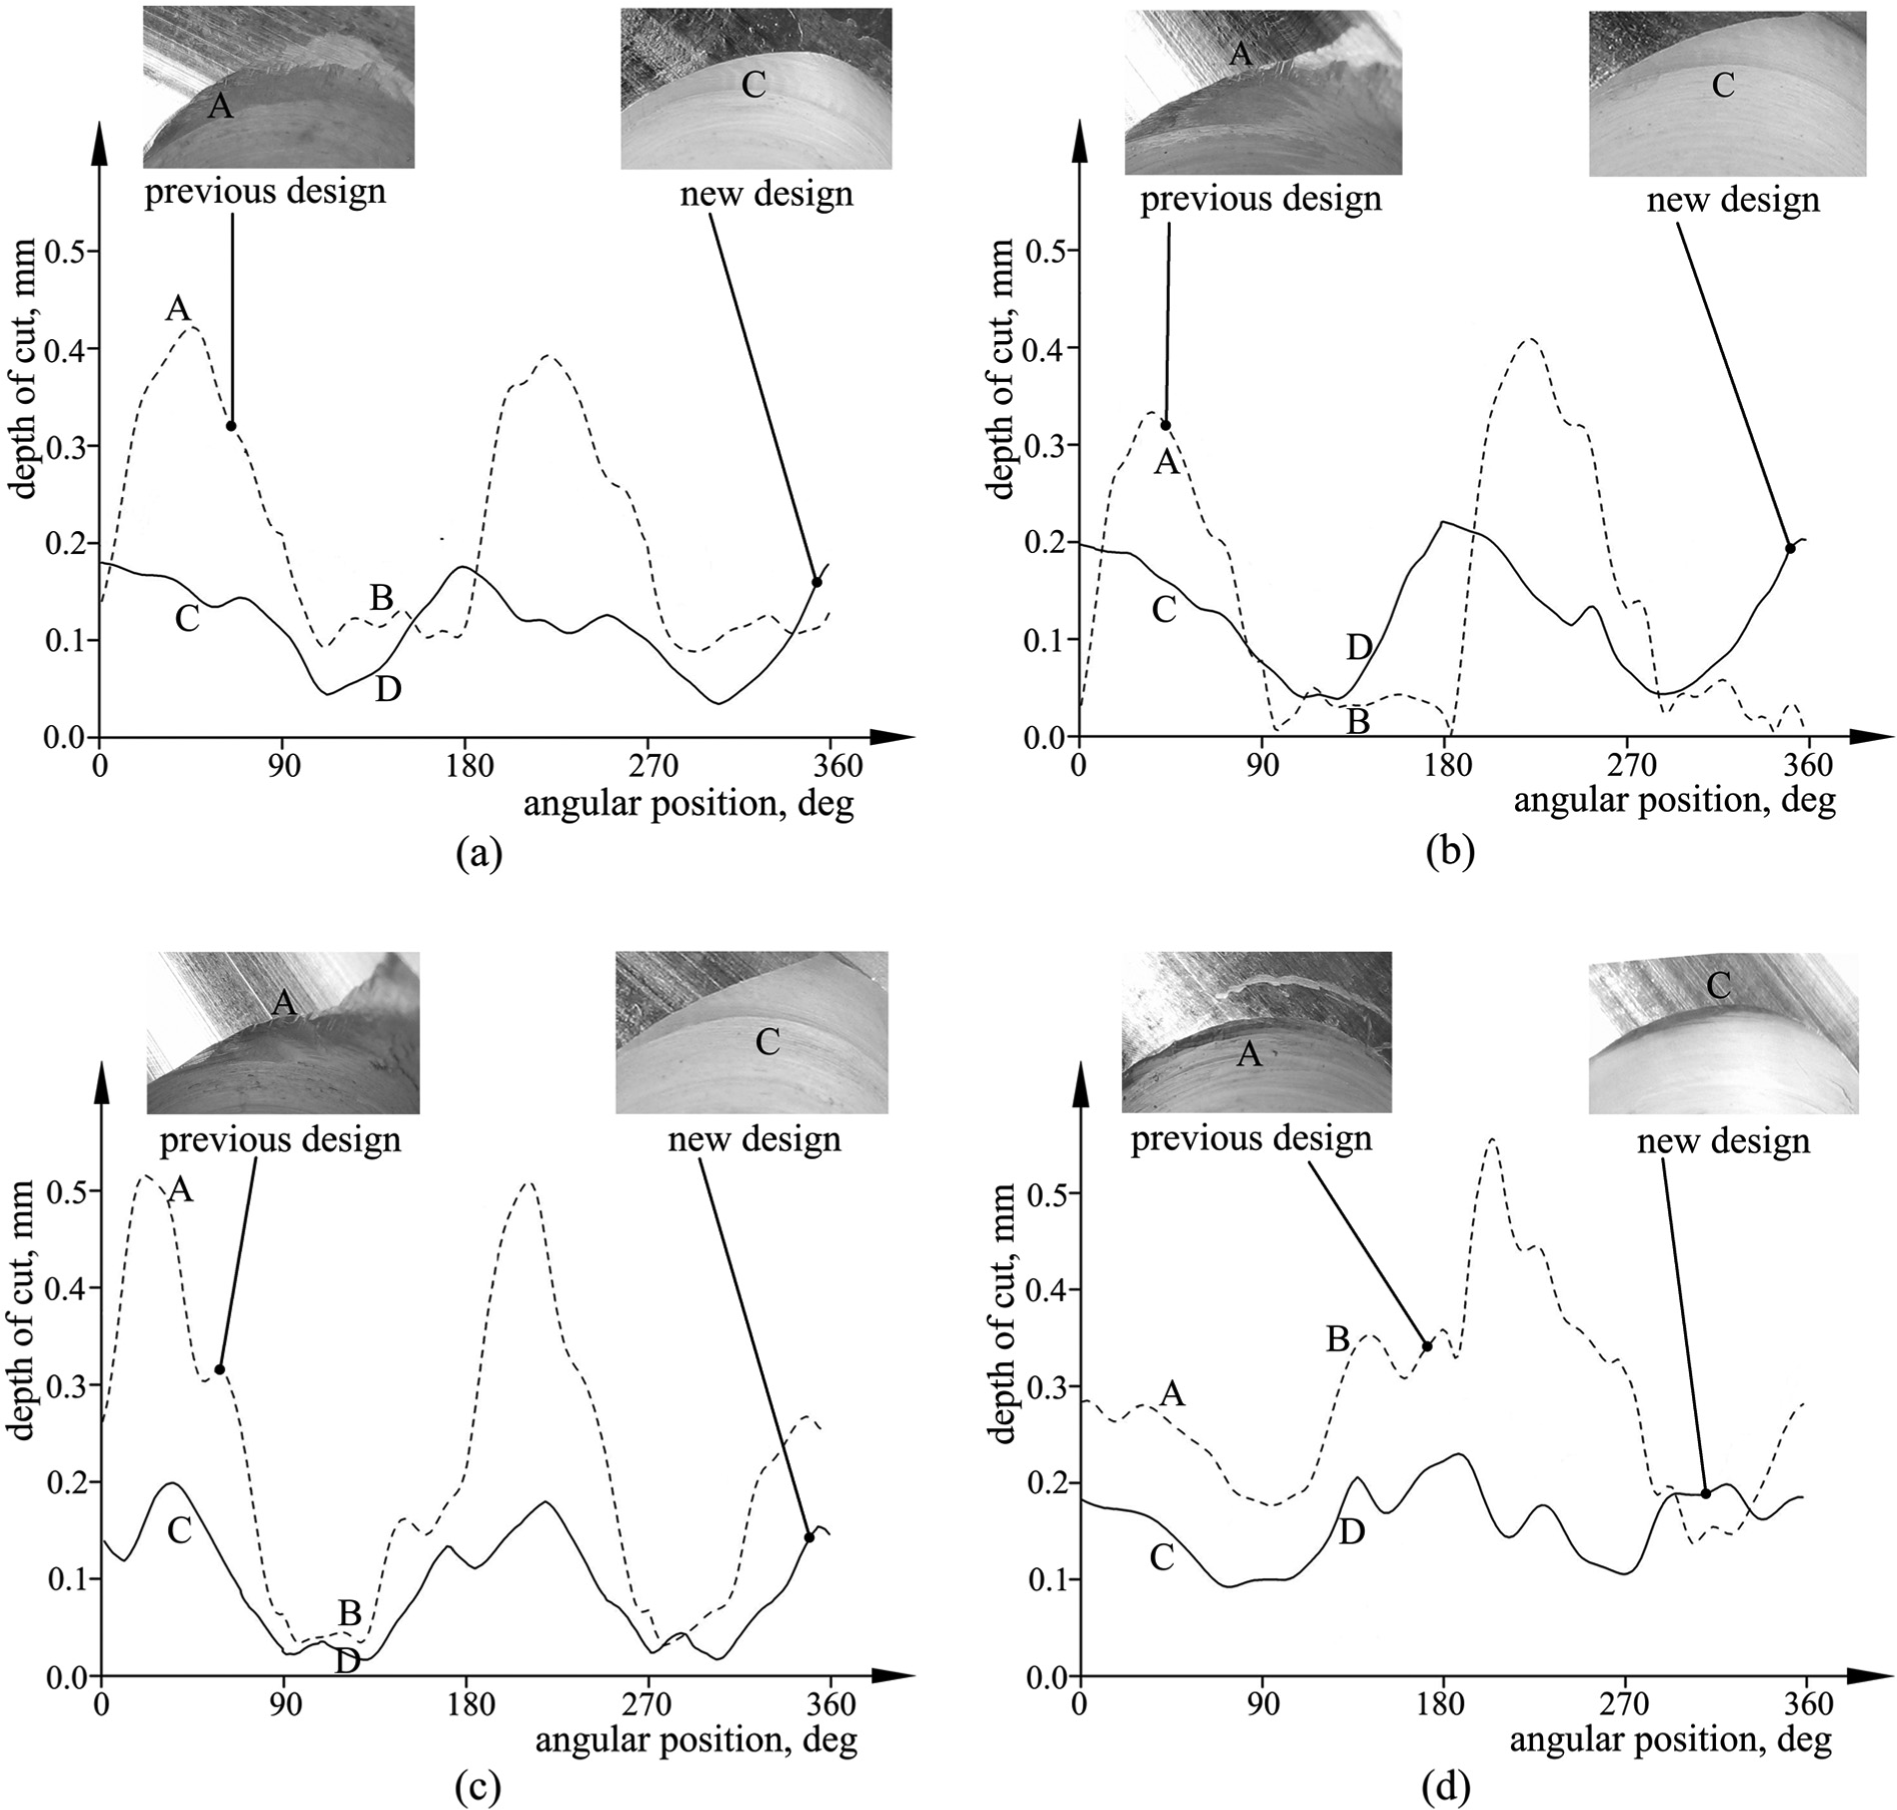
Variations in the depth of cut versus angular position with the new design and the previous design of deburring tool: (a) d1 = 20 mm, d2 = 13 mm and ϕ = 90°; (b) d1 = 16 mm, d2 = 13 mm and ϕ = 90°; (c) d1 = d2 = 13 mm and ϕ = 90° and (d) d1 = 20 mm, d2 = 13 mm and ϕ = 60°.
For quantitative comparison of surface irregularity of the deburred edges, irregularity index (G) is defined in terms of the difference between the measured depth of cut and the smoothed depth of cut with respect to the angular position on the deburred edge. The smoothed depth of cut is defined by the simple moving average (SMA) algorithm26,27 such as
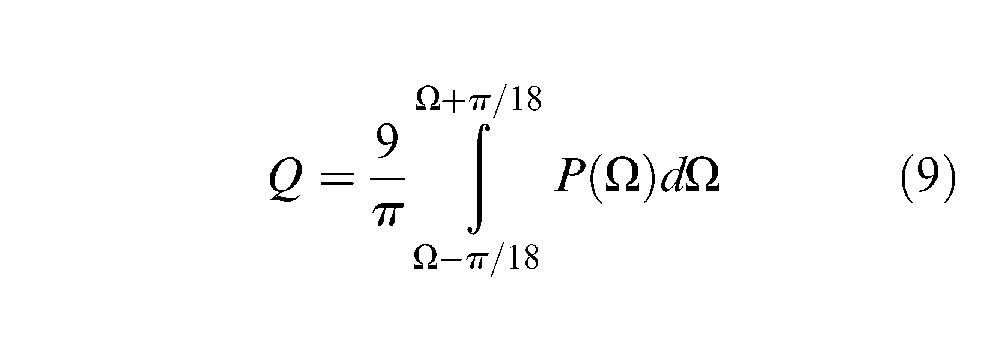
where Ω is the angular position, P is the measured depth of cut and Q is the smoothed depth of cut. The irregularity index is defined as
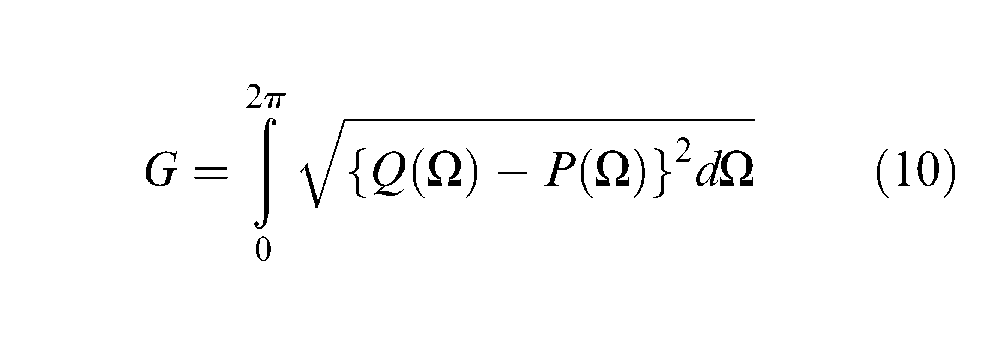
The irregularity index G represents the deviation of the measured depth of cut from the smoothed depth of cut. Figure 10 shows an example of measured and smoothed depths of cut versus angular position for the new and the previous designs of the deburring tool.
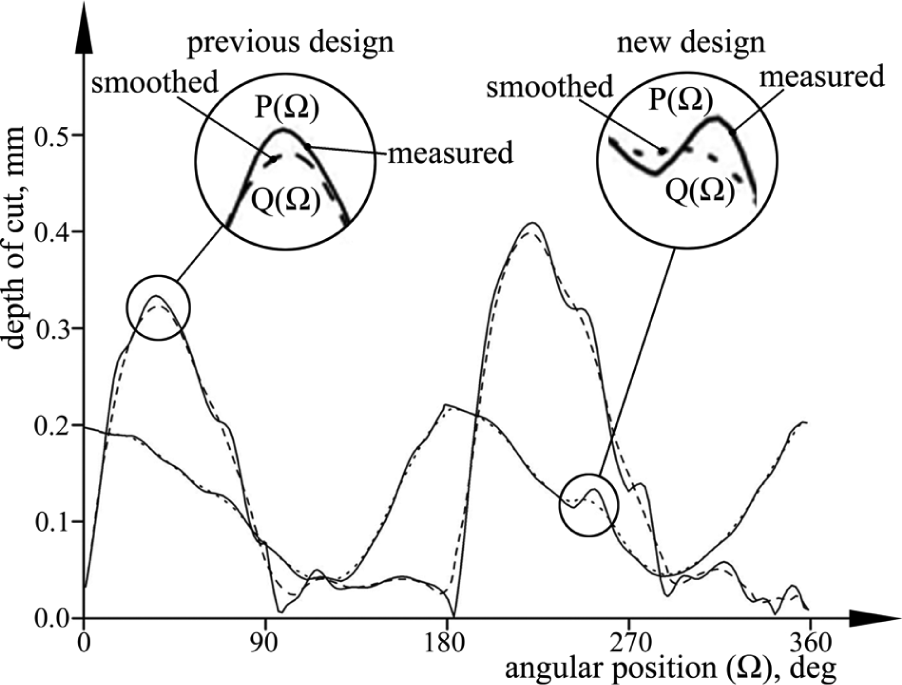
Measured and smoothed depths of cut versus angular position for the new and the previous designs of deburring tool.
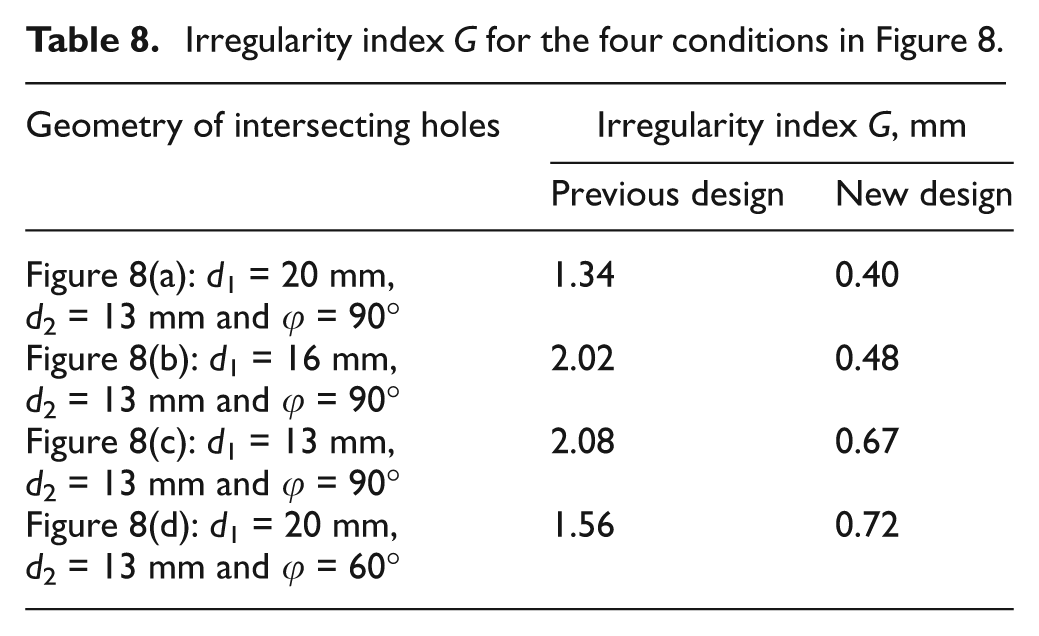
The values of the irregularity index G for the four conditions in Figures 8 and 9 are listed in Table 8. A higher value of the irregularity index indicates higher surface irregularity. The previous design has an irregularity index of over 1.3 mm for the four conditions, while the new design has an index of below 0.73 mm.
Irregularity index G for the four conditions in Figure 8.
Conclusion
Quick operation, easy access to burr edge and high surface quality of the deburred edge are the major requirements of a deburring tool. To improve the surface quality of the deburred edge, the tool was optimized with respect to tool vibration. For the optimization, a rigid body dynamic model of the deburring tool was used with user subroutines of ADAMS/Solver.
The tool vibration was characterized by object functions. Among a few candidate functions, one was selected considering affordance and limitation. From DOE, the major design parameters governing the tool dynamics were identified and selected. Through RSM, the optimal values of the major design parameters were obtained. For the description of surface irregularity, an irregularity index was proposed based on the difference between actual depth of cut and smoothed depth of cut obtained by SMA algorithm. The index is useful for relative comparison of surface quality. As a result of optimization, the index value decreased from 1.3 to 0.7 mm.
The current design offers better surface quality at lower speeds of deburring. An ideal design would offer good surface quality and higher speed of operation. Moreover, the application of current design is limited to cutter head diameter over 5 mm. With the diameter below 5 mm, deburring becomes difficult due to the reduced dimensions of the cutter head. These problems need to be addressed in future.
Footnotes
Declaration of conflicting interests
The authors declare that there is no conflict of interest.
Funding
This work was supported by the Korea University Grant and Basic Science Research Program through the National Research Foundation of Korea (NRF) funded by the Ministry of Education, Science and Technology (grant 2012-0000783).