
Abstract
The butt welding of 1.4462 (2205) duplex stainless steel plates with thickness of 4 mm under various welding parameters was achieved by Nd:YAG laser type without the use of the filler material. Welding parameters such as welding power (kW) and the focus distance from the joint surface (mm) were changed. The Ar 5.0 protective gas flow and welding speed were the same for all the tests and were 20 L/min and 0.5 m/min, respectively. The weld shape, weld macrostructure, microstructure, strength and hardness, and the content of the ferrite in the weld zone, heat-affected zone, and base metal were emphatically investigated. The test results showed that increase in laser power increases the weld zone area. For the weld samples, a better ferrite/austenite ratio was obtained by focusing the laser beam on the sheet surface. Furthermore, the largest elongation from strength test has been observed for the weld samples made with laser power of 2.0 kW.
Introduction
Duplex stainless steels (DSSs) are characterized by a higher conventional yield point when compared with austenitic stainless steels. They feature relatively good strength properties also in corrosive media. 1 When considering the behavior of the austenitic-ferritic stainless steel grades, one should stress their better resistance to stress corrosion cracking caused by chlorides as compared to austenitic stainless steels. 1
Thanks to these advantages as well as a wide range of available metallurgical materials, the 1.4462 steel is very widely used. It is used inter alia for welding bridge structures, various kinds of welded storage tanks (e.g. crude oil ones), pressure vessels and chemical tanks, road tankers, parts of industrial plants, and potable water systems as well as members of structures operating in high temperatures.2,3
Second generation of DSS grades are considered to be easily weldable. A publication of the Euro Inox organization 4 is devoted to inter alia welding of those stainless steel grades. The article describes welding methods starting from electric arc welding methods (such as gas tungsten arc welding (GTAW), plasma arc welding (PAW), gas metal arc welding (GMAW), flux-cored arc welding (FCAW), shielded metal arc welding (SMAW), and PAC), through resistance and inductive methods (such as resistance spot welding (RSW), resistance seam welding (RSEW), projection welding (PW), electroslag welding (ESW), flash welding (FW), and high-frequency induction welding (HFIW)) ending up with methods using radiation energy (such as laser-beam welding (LBW) and electron-beam welding (EBW)). However, each welding process requires selection of correct welding parameters to obtain a joint that will meet specified requirements.
The structure of 1.4462 DSS includes 30%–55% of ferrite (usually about 45% of ferrite). 5 When selecting welding parameters of DSSs, one should mainly take into account the microstructure to be achieved in the weld joint and, above all, the percentage share of phase components of ferrite and austenite in the heat-affected zone (HAZ) and the joint.6–8 This allows, among others, to achieve optimum corrosion resistance with good mechanical properties. Low content of ferrite (<25%) may lead to reduction in the strength and increase the risk of stress corrosion cracking, while the high content of ferrite (>75%) may lead to reduction in the corrosion resistance and impact resistance.5,9
An appropriate balance between the ferrite and austenite structure of the base material is achieved by appropriate combination of the chemical composition and appropriate heat treatment.10,11 However, the control of the weld joint structure balance is not so easy as for the base material,6,12,13 especially if filler metal is not used. 14
The available studies show that the HAZ structure, the weld zone (WZ) structure, 15 and the geometry of the joint 16 depend mainly on heat input. The heat input (line energy) 16 is directly related to the laser power and the welding speed. The welding speed in LBW is definitely higher than that in conventional welding, which consequently leads to an increase in cooling rate. 15 The rapid cooling rate can disturb the ferrite and austenite phase balance.17–19
The increase in cooling rate from 10°C/s to 100°C/s resulted in a gradual increase in ferrite content. 20 In addition, it leads to the formation of a structure, which is harmful to both mechanical properties and corrosion resistance. 21
A slow cooling rate of the weld promotes a favorable high austenite fraction, but, however, gives coarse grains and causes precipitation of brittle intermetallic phases, such as σ and χ (especially for the high-alloyed DSS).20,21 Therefore, welding parameters should be adjusted to ensure that the cooling rate is low enough to allow adequate austenite formation, and yet high enough to avoid precipitation of intermetallic phases. 20
Studies on 1.4462 steel welding methods using radiation energy, which are available in the literature, concern laser welding using Nd:YAG lasers in argon shield,5,22 fiber laser,23,24 carbon dioxide (CO2) type lasers,25–27 as well as the electron-beam welding. 28 However, the specification of the parameters of DSS welding with use above welding methods is still insufficient. For example, the research carried out up to now concern laser welding sheet thickness of 222 and 6.4 mm. 5 In the study by Mirakhorli et al., 22 a high ferrite content was achieved. Similar results were obtained23,24 using fiber laser welding. The satisfactory results of the austenite–ferrite balance were obtained at work, 5 but incomplete penetration was observed.
The presented publications show that the selection of welding parameters of DSS 1.4462 is still intensely studied. In addition, it is important to bear in mind that cooling rate depends not only on the heat input but also on the thickness of the sheet. 20
In this article, the laser power influence on the weld properties was investigated. The tests were carried out in welded samples made without filler metal and of 4 mm thickness. This sheet thickness welded by Nd:YAG laser without filler metal has not yet been investigated.
This article also presents the influence of laser power on the welding imperfection related to poor geometric shape. The geometric shape was expressed as, inter alia, weld reinforcement area and excessive penetration bead area. This approach is relatively new and should deserve special attention. The sharp transition caused by high weld reinforcement area leads to the accumulation of pollutants and may interfere with effective cleaning of cleaned tanks. Furthermore, sharp transition causes a local stress concentration that can contribute to loss of strength, which is particularly important in fatigue situations.29,30
Material and experimental procedures
The butt joints were made of DUPLEX 2205 type steel (X2CrNiMoN22-5-3 according to PN-EN 10088-2:2014-12). A 4-mm-thick plate was used. Chemical composition of the base material and the properties obtained from the monotonic tensile test are presented in Table 1.
Chemical composition and mechanical properties of the applied base metal.

The weld joints were made using automatic welding machine TRUMPF TruLaser Robot 5020 fitted with disk laser of Nd:YAG type. No filler metal was used in the welding process, and it was the continuous wave mode process. Argon 5.0 was used as a shield gas. The metal plate clamping method and the welding process are shown in Figure 1. Six joints were prepared using variable welding parameters. Selected welding parameters for which laser power effect on basic properties of a joint was observed are summarized in Table 2. The heat input (welding linear energy) E values were calculated according to the following formula 16
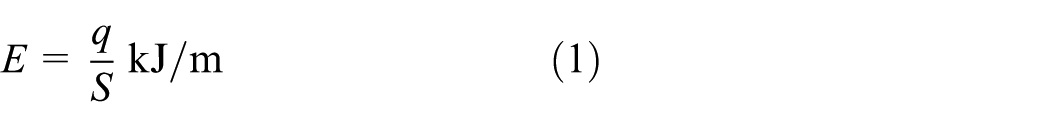
where q is heat source energy (kW) and S is welding speed (m/s).

Laser welding process on TRUMPF TruLaser Robot 5020 including sheet pressing system. 31
Laser-beam welding parameters.

D = 0 mm—upper surface of the specimen.
D = 2 mm—half of the specimen depth.
Macro- and microstructure
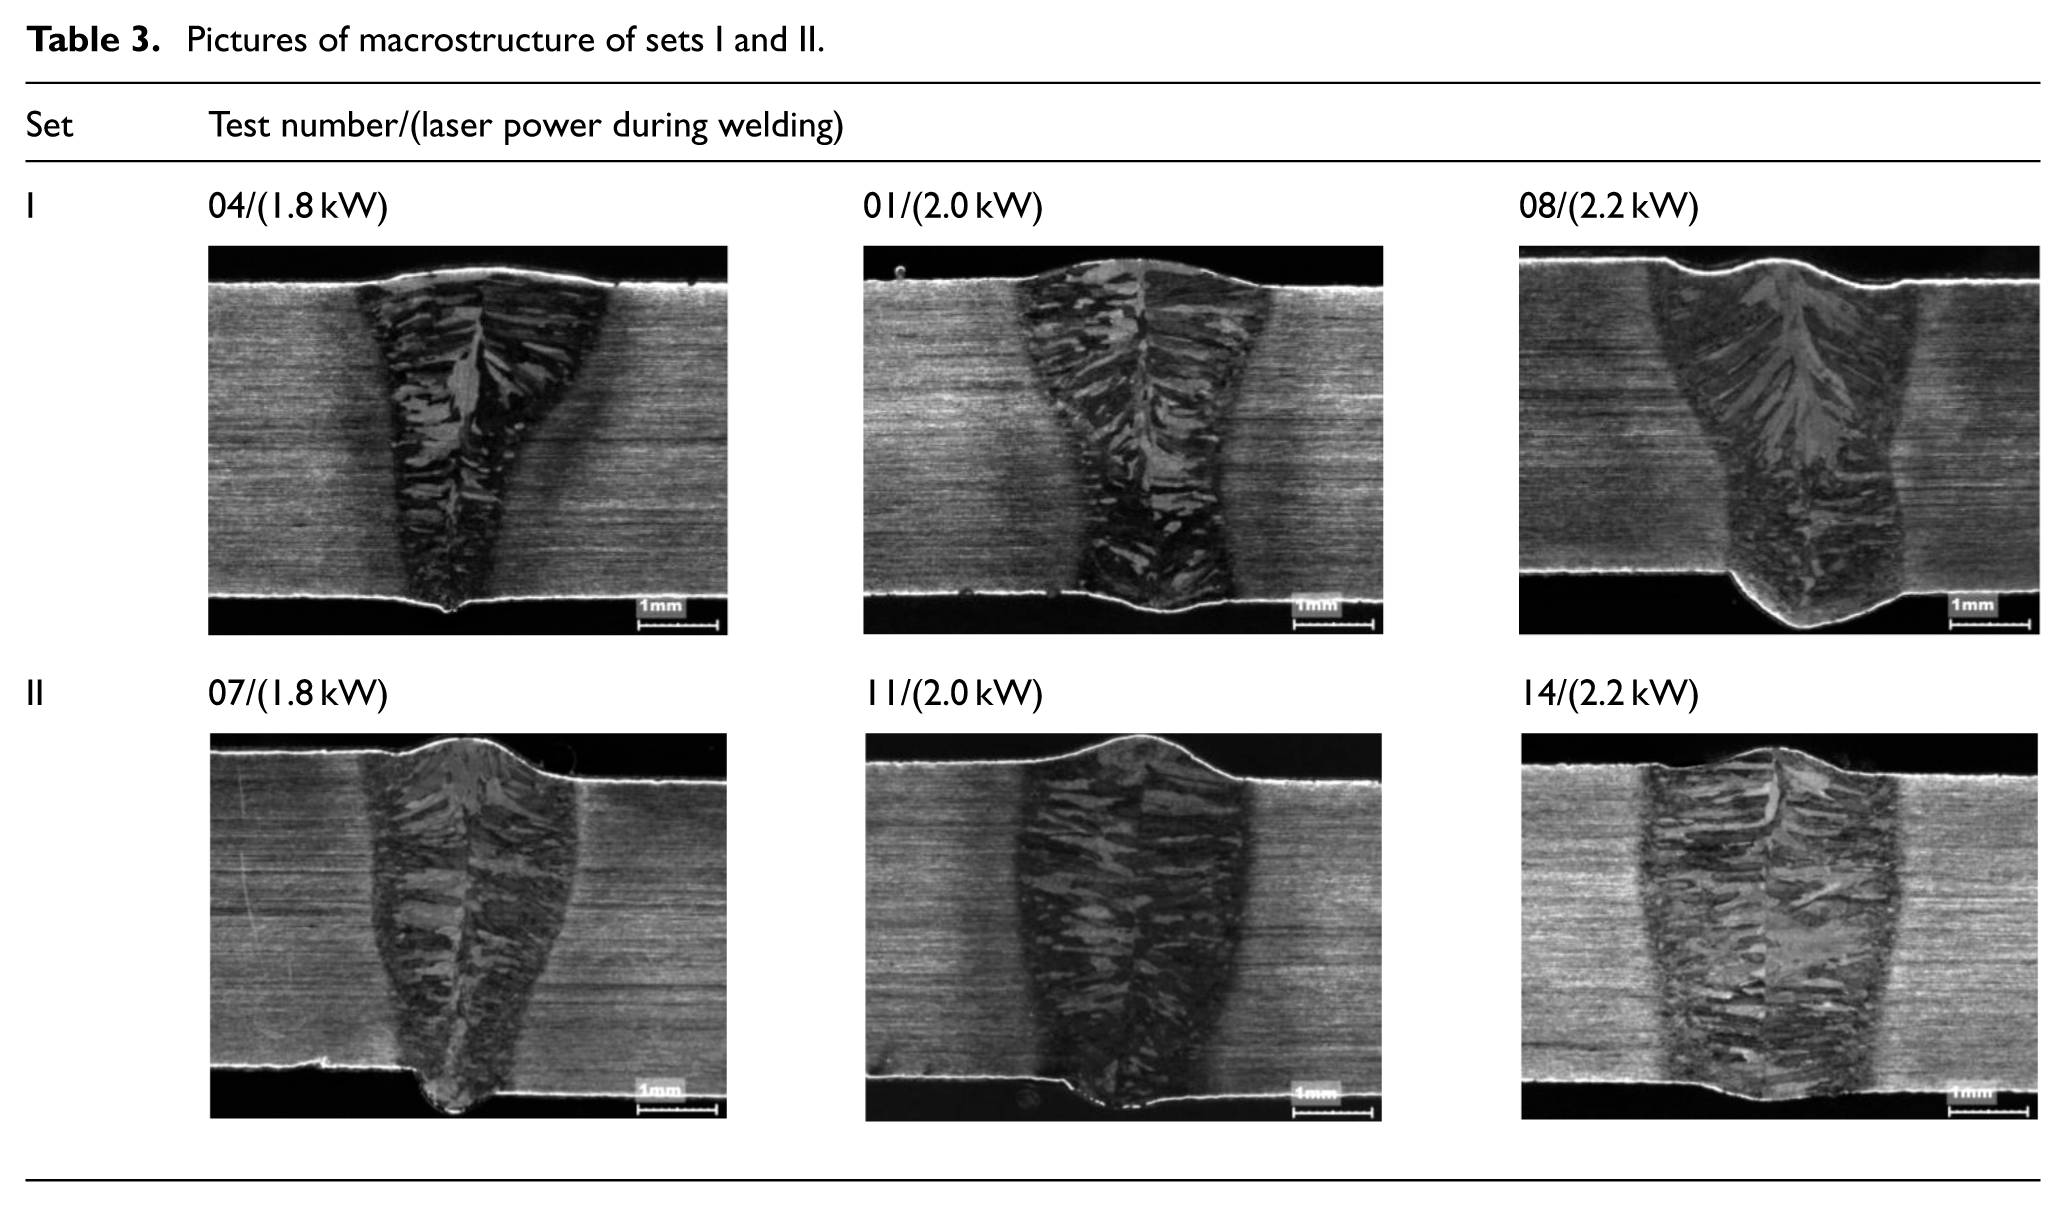
The effect of the laser power was determined for two sets of joints: I and II (see Table 2). The sets additionally differed in the value of the laser beam focus distance from the plate surface (D). The polished section crosswise to the welding direction was prepared for the macro- and microstructure tests. Metallographic polished sections underwent deep etching in the Murakami’s reagent of the following composition: potassium hydroxide KOH (10 g), potassium ferrocyanide K3Fe (CN)6 (10 g), and distilled water H2O (100 mL). Microscopic pictures were taken using Nikon MA10 inverted metallographic microscope equipped with Zeiss Axiocam ERc 5S camera. Pictures of the microstructure were taken using Nikon SMZ800 stereoscopic microscope equipped with Deltapix 3S digital camera. Pictures of the macro- and microstructure for the analyzed sets are presented in Tables 3 and 4, respectively.
Pictures of macrostructure of sets I and II.
Pictures of microstructure of sets I and II.

HAZ: heat-affected zone; WZ: weld zone; BM: base metal.
Ferrite and austenite tests
Ferrite (α) content measurement was performed in individual zones (base metal (BM), HAZ, and WZ). These tests were carried out by X-ray diffraction method on DRON 1.5 diffractometer using X-ray tube radiation with cobalt anode and iron filtering. And 2theta (2Θ) angles from 48.0° to 126.0° were recorded with the increment of 0.1°. A complete run for the aforementioned angular range was performed for 4-mm-thick BM (Figure 2). The runs for WZ and HAZ areas were performed in the angular range from 49.5° to 53.5° with the increment of 0.1°. The tube voltage amounted to 35 kV while the current was 6 mA. A scintillation counter was used as a detector. Qualitative phase analysis was performed by comparison of the obtained distances between planes dhkl and the relative intensities to the ASTM catalog data (Table 5).
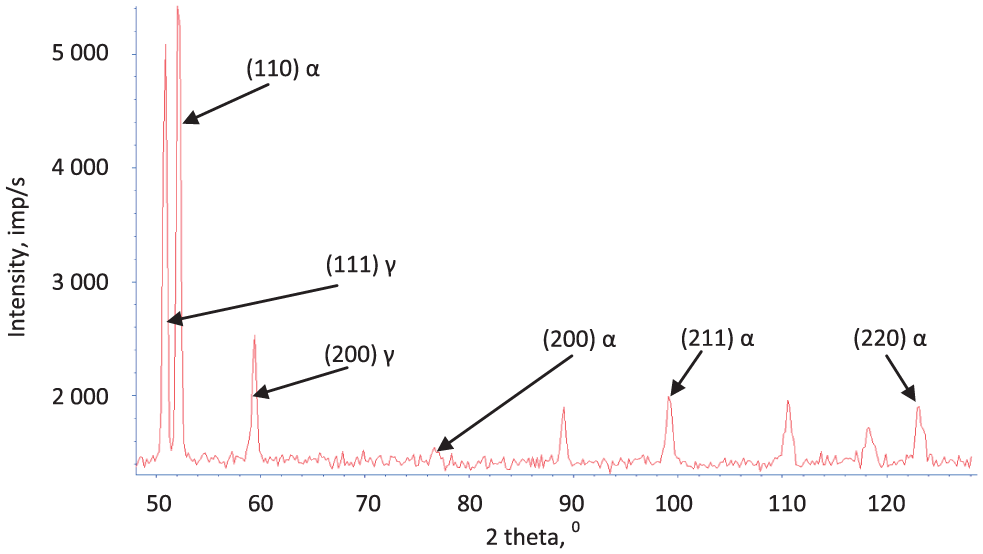
Diffraction pattern of the base material: 4-mm-thick metal plate.
Phase identification results for the base material: 4-mm-thick metal plate.
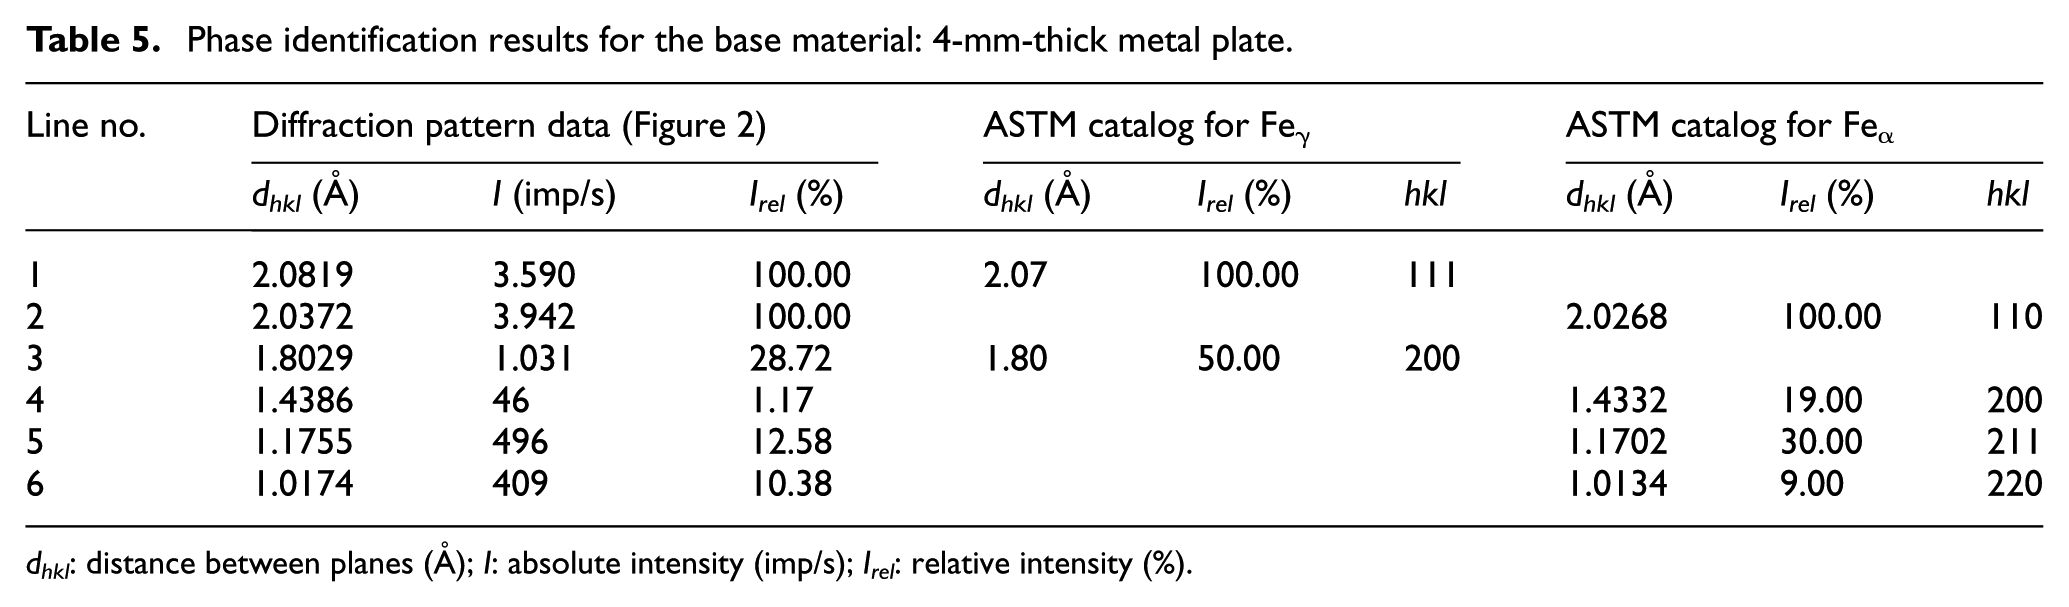
dhkl: distance between planes (Å); I: absolute intensity (imp/s); Irel: relative intensity (%).
Two strongest lines were used for the assessment of the Feα phase (ferrite) and Feγ phase (austenite) content. That is why diffraction tests were performed in the angular range from 49.5° to 53.5° with the increment of 0.1°. Two lines were analyzed: (111) γ and (110) α. The austenite (Vγ) share in the DSS matrix (depending on the measurement place) was determined in accordance with formula (2), while the ferrite (Vα) share according to formula (3)32,33


where Vγ = austenite percentage by volume (%); Vα = ferrite percentage by volume (%); Iα = the total relative intensity of the diffraction line (110) of the phase α, measured with an X-ray photograph (imp); Iγ = the total relative intensity of the diffraction line (111) of the phase γ, measured with an X-ray photograph (imp); R = a constant value adopted from the paper 32 for those measurements (0.85).
Microhardness tests
Microhardness tests were performed using SHIMADZU HMV-G microhardness tester. HV0.2 hardness distributions were determined in individual zones of a joint. Microhardness measurements were performed in accordance with the pattern shown in Figure 3.
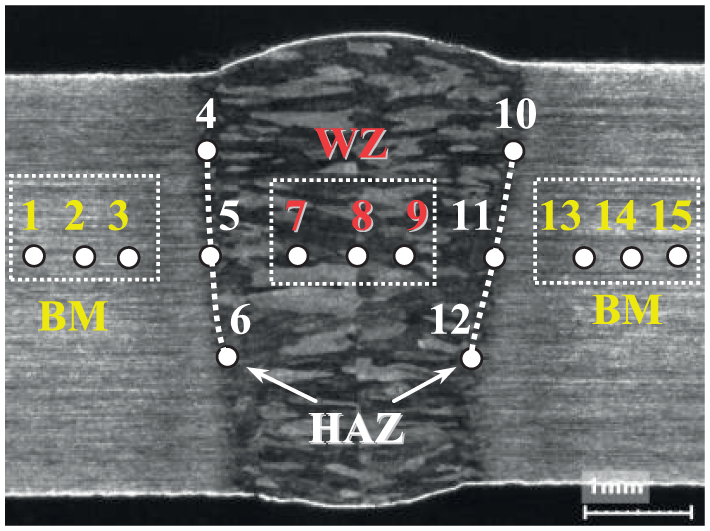
HV0.2 microhardness measurement pattern.
The tensile strength tests
The strength tests were performed using the hydraulic testing machine INSTRON 8501. The specimens were prepared with a weld joint laid perpendicular to the load direction. The research was performed for the amount of tests including three specimens prepared using specific welding parameters. The following parameters were determined as average values based on the performed tests: tensile strength Su (MPa), yield strength Sy (MPa), and elongation A (%), among others. The determined stress values were referred to the specimen cross-sectional area without taking into account the increased cross section at the weld seam.
The above tests were performed in the accredited laboratory of the Material Engineering Unit (AB1471) and in the accredited Institute Laboratory for Research on Materials and Structures (AB372).
Results and discussion
Laser power effect on the macro- and microstructure
Macrostructure pictures were analyzed for the laser power effect on the weld zone area (WZA), the face area (FA) and root area (RA), and face length (FL) and the root length (RL). Measurement scheme of the above values is presented in Figure 4.
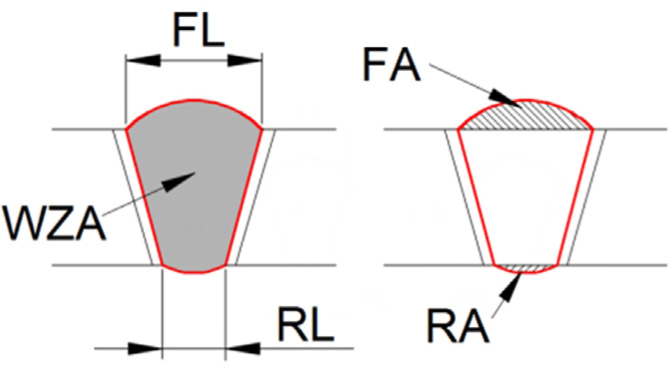
Measurement scheme of the following values: FL, face length (mm); RL, root length (mm); WZA, weld zone area (mm2); FA, face area (mm2); and RA, root area (mm2).
WZA increases with the increase in the welding power (P; Figure 5). This relationship is observed for the two analyzed sets. WZA increase is associated mainly with the amount of delivered linear power. The higher the linear power delivered to the weld joint, the larger the WZA surface area. WZA variation analysis is presented in Figure 5.

Laser power effect on the weld zone area (WZA).
The relationship between FL and RL is described using δ = FL/RL coefficient (Figure 6). For the tested sets, the change in the δ coefficient value is inversely proportional to the applied welding power. For set I at 1.8 kW, the FL value is over three times greater than RL, while for set II, it is approximately 2.7 times greater than RL. Such difference is not observed at higher welding power values. At welding power of 2.0 and 2.2 kW, FL is about 1.4–1.6 times greater than RL. Thus, increasing the welding power (leaving other parameters unchanged—like in Table 2) will reduce the difference between the FL and the length of the root. It should be noted that the value of the δ coefficient is greater for weld joints executed with the laser beam focused on the plate surface (D = 0 mm). This is associated with the fact that focusing the laser beam on the plate surface decreases the absorption surface and thus increases the laser beam power density.

The value of δ = FL/RL coefficient depending on the welding power.
The largest FA was obtained for welding power of 2.0 kW (Figure 7). These values are comparable both for welding with laser beam focused on the surface and in the middle section of the plate. Slightly lower values of the FA were obtained for the power of 1.8 kW. The power of 2.2 kW with beam focused on the plate surface (set I) caused face undercut (negative value of the field). This is mainly associated with the fact that too high linear energy was supplied to the connection. When the beam is focused in the middle section of the plate (set II), although the same linear energy is supplied as in the preceding case, the undercut has not occurred. Larger absorption area, resulting from displacement of the focal spot to the middle section of the plate, caused the reduction in the laser beam power density and thus the weld FA.

The face area (FA) versus the welding power.
The RA for the case of laser beam focused on the plate surface (set I) increases along with the laser beam power increase (Figure 8). Increased linear energy causes increase in the volume of molten metal, which moves toward the root under the influence of gravity. The specimen RA behaved differently when the laser beam is focused in the middle section of the plate (set II). For the power of 1.8 and 2.0 kW, the RA values were comparable and an additional increase in the welding power resulted in RA increase by 35% in relation to the area obtained at lower power.

The root area (RA) versus the welding power.
It should also be noted that the smallest values of the sum of the weld FA (excluding face with undercuts) and the weld RA were observed for weld joints executed using parameters 04 (set I) and 14 (set II). Maintaining the minimum value of the face and RA is particularly important if a geometric notch in the form of a weld face and weld root is left in structural elements subject to load variable over time. Larger face and RA reduces the fatigue life of the weld joint.
The laser power effect on the ferrite/austenite structure content
The results of phase Feα (ferrite) and Feγ (austenite) share for the analyzed joints determined by sets: I (specimens—04, 01, and 08) and II (specimens—07, 11, and 14) are shown in Table 6.
The determination of the austenite and ferrite share in welded joints using X-ray diffraction (XRD).

HAZ: heat-affected zone; WZ: weld zone.
Percentage content of ferrite for BM was determined as the average value of 32 measured points. Average content of ferrite for BM amounted to 36.3%. That value was used as a baseline (reference) for ferrite content in individual zones of the weld joint for focusing the laser beam on the surface of the specimen (D = 0 mm) and for focusing the laser beam on the middle section of the specimen thickness (D = 2 mm). Obtained curves are presented in Figure 9.

Percentage ferrite content for set I and set II.
Regardless of the beam power applied, there was a decrease in the ferrite content in HAZ and higher decrease in the WZ. For set I, the biggest ferrite content decrease, either in the WZ or in the HAZ, was observed for parameter 08 (2.2 kW). Whereas for set II, the biggest decline in ferrite content in HAZ occurred for parameter 07 while in the WZ for parameter 14. For set II, the ferrite content in HAZ for all parameters is comparable, while the difference is less than 4%; the ferrite content in WZ for parameter 14 decreased by more than 55% compared to ferrite content in BM.
Clear percentage difference in ferrite content was observed in the structure of welded joints between set II and set I. Focusing of a laser beam in the middle section of the joined plate causes ferrite content reduction in the structure of welded joints. The ferrite content reduction concerns both HAZ and WZ zones.
In the initial phase of weld solidification, only ferrite was created. Due to high speed of diffusion of elements in ferrite, its chemical composition is homogenized even at the speed with which the weld is getting cold (dendrite segregation is eliminated). Austenite (γ) was created at dendrite borders when weld cooling is already in solid state. After a very high temperature in a short time, held for a few seconds, the alloy is subsequently cooled to the room temperature. Most of the γ islands in the DUPLEX structure dissolve into the δ-ferrite matrix, and δ-ferrite grains grow coarse. During the cooling stage in the temperature range between 1350°C and 800°C, austenite re-precipitates around ferrite grain boundaries. The alloy cooling rate between 1350°C and 800°C is very important for the austenite/ferrite phase balance. 20
The focus distance is different in welding parameters of samples from set I and set II. In set II where the laser beam was focused in the middle of the thickness of the joined plates, the predominant structure in the weld joint was austenite. This could have been caused by a lower cooling speed due to a greater heat concentration in the half thickness of welded sheets.
The laser power effect on the microhardness
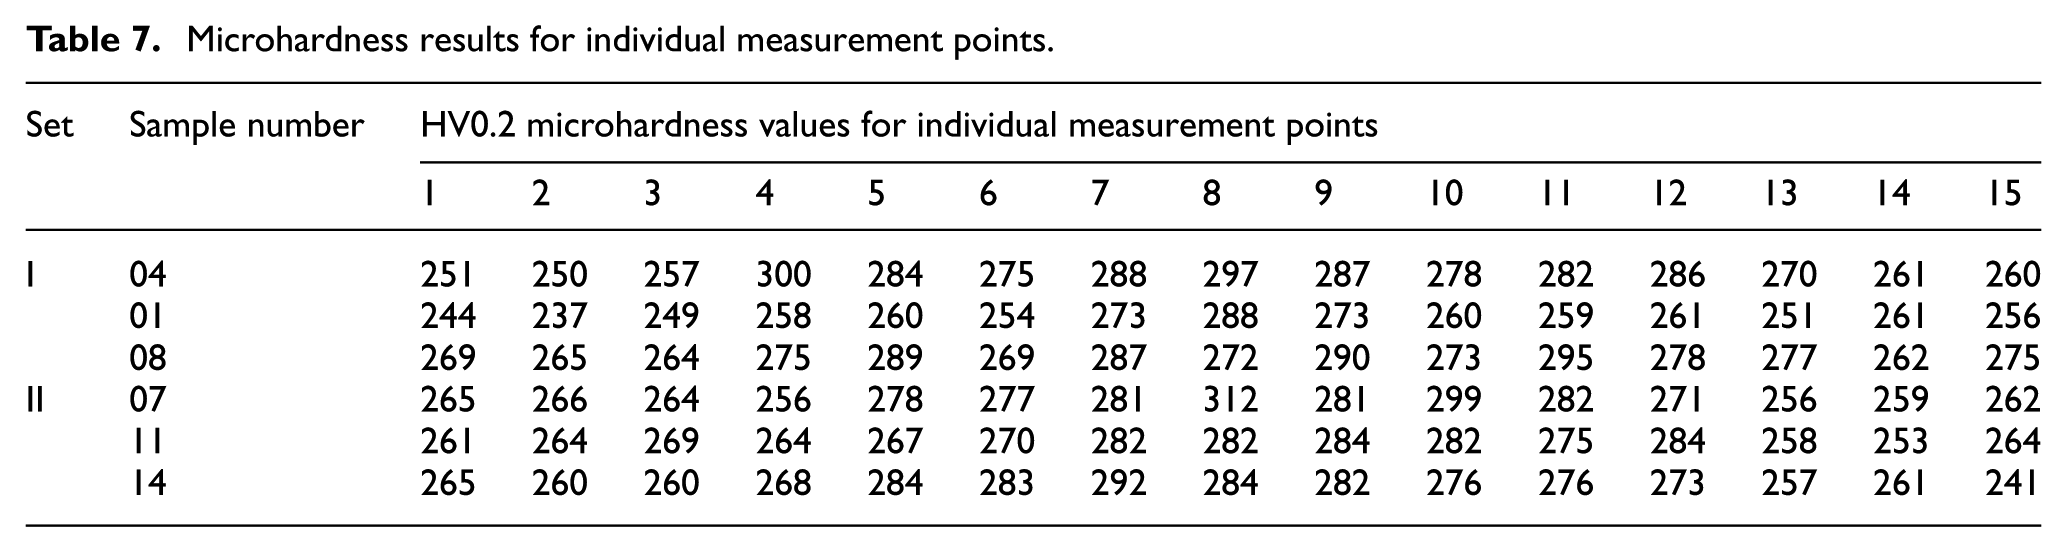
The results of the microhardness HV0.2 have been obtained for each measuring point. The results are summarized in Table 7.
Microhardness results for individual measurement points.
Average value (AVG) and deviations (MAX, MIN) of microhardness for BM were calculated based on values obtained from 84 measurement points. The average value for BM amounted to 261.3 HV0.2. The average values and deviations for HAZ under individual welding parameters were jointly determined for the left (points 4, 5, and 6) and right (points 10, 11, and 12) side of the connection. Obtained values are presented in Figure 10.
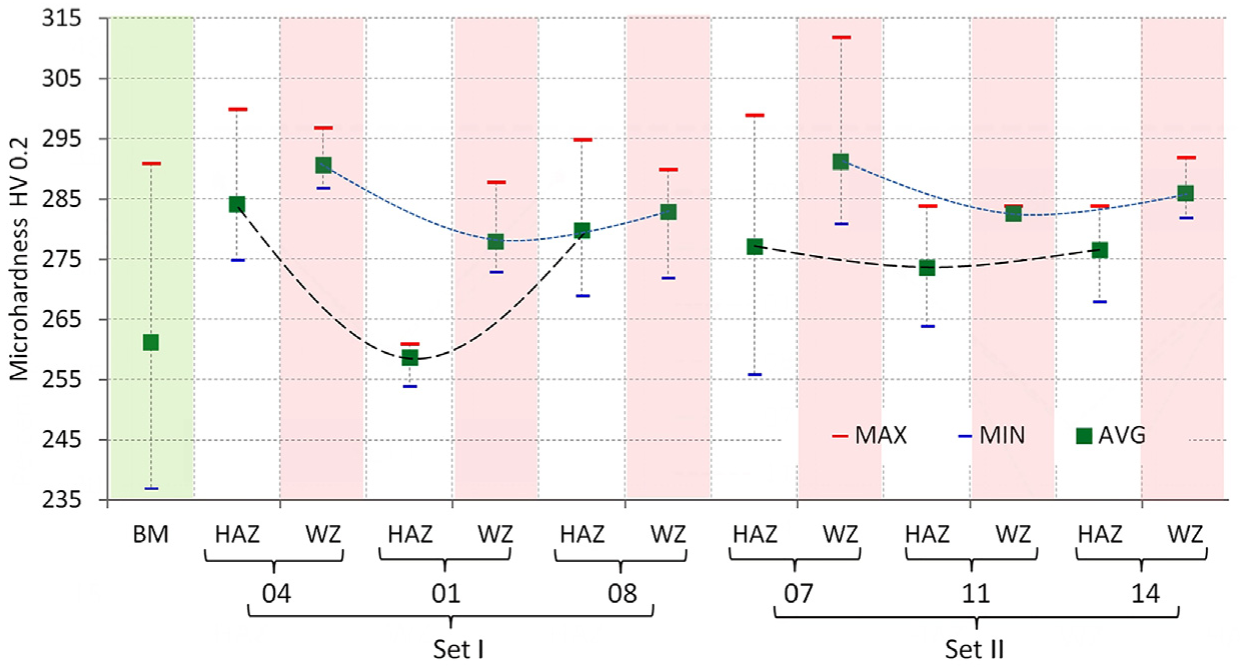
The average values and deviations of microhardness for individual weld joint zones: sets I and II.
Phase changes in WZ and HAZ, virtually under all the welding parameters, have increased the microhardness in comparison to microhardness in BM. The only exception is the microhardness value for HAZ obtained for welding parameter 01. That value is comparable with the microhardness measured at BM. For the weld joint prepared using parameter 01, the microhardness in WZ was nearest to the one in BM.
The highest microhardness values in HAZ were found for parameter 04 while in the WZ for parameter 07. For parameter 07, the largest scattering of weld joint hardness results were also obtained, which may indicate heterogeneous structure characterized, among others, by different strength properties over the cross section.
While observing the nature of the microhardness changes in individual zones of weld joints versus welding power, it was found that the welding power is decisive for microhardness of individual zones of weld joints. The microhardness characteristics of the tested weld joints depending on the laser power assume the form of a parabolic curve (Figure 10). The microhardness in individual zones is high for smaller power values (1.8 kW), and it decreases together with the increase in the welding power (up to 2 kW). Further increase in the welding power (up to 2.2 kW) causes increase in the microhardness in individual zones.
The laser power effect on the tensile strength properties
The tensile strength of the BM and the welded joints with variations of the laser power and focus distance are presented in Figure 11. The mechanical properties are presented in Table 8.

Selected tensile stress–strain curves for BM and welded samples: (a) set I and (b) set II.
Tensile strength properties results.

BM: base metal.
The power applied for laser welding does not significantly affect the strength properties (Su, Sy) of the weld joint in comparison with strength properties of a specimen taken from BM (without weld). The specimen elongation is noteworthy (Figure 12). The largest elongation has been observed for the laser power of 2.0 kW (parameters 01 and 11). The elongation upon the fracture of a specimen significantly decreases in the case of smaller and higher power applied to welding. The elongation difference in relation to BM for set I for the laser power of 2.0 kW (parameter 01) was smaller than 21%, while for the laser power of 2.2 kW (parameter 08) higher than 54%. Similar results were obtained for set II, where the elongation difference was for the power of 2.0 kW (parameter 11) about 34%, while for the power of 2.2 kW (parameter 14) over 53%, respectively.

The graph of the basic strength properties for weld joints of sets I and II.
The selected pictures of samples after fracture are presented in Figure 13. For samples welded with laser power of 2 kW, the fracture occurred in WZ. For other samples, the fracture occurred in roots and toes of weld.
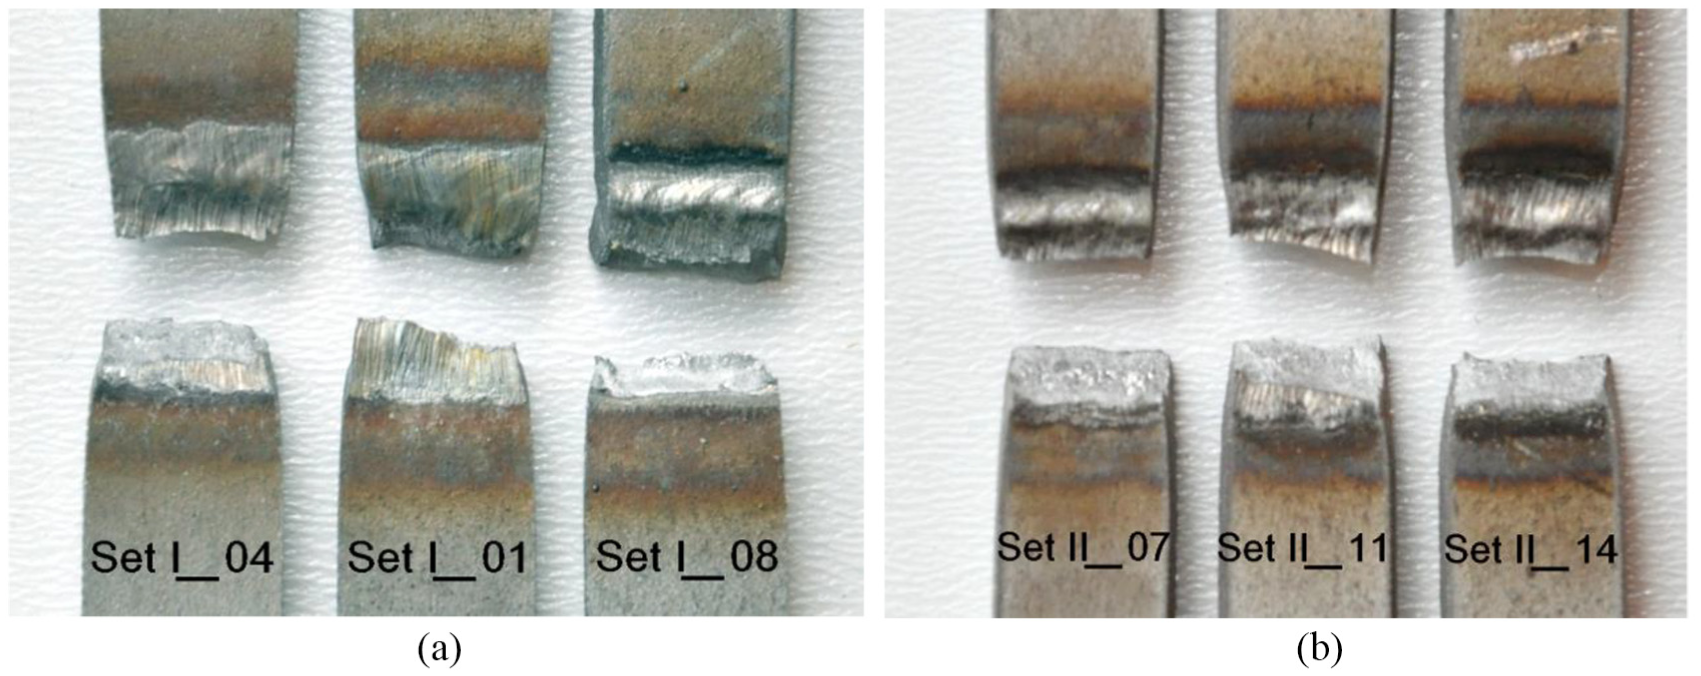
Selected pictures of samples after fracture: (a) set I and (b) set II.
The geometric and structural notch of the correct weld increases the tensile strength compared to the strength of the smooth (BM) sample. However, this notch effect reduces the elongation. The uniform tensile stress state in the unnotched sample (BM) makes plastic deformation of dislocation homogeneously distributed over the whole gauge length of the sample. Therefore, a large tensile plasticity is gained. However, the stress concentrations in notched samples (welded samples) constrain the plastic deformation mainly in a small zone (plastic zone) located in the roots and toes of the weld. The insufficient plastic deformation of the welded sample surely leads to a decreasing elongation. 34 Another reason for decreasing elongation is the negative pressure induced by the tri-axial tensile stress around notch roots and toes, which may facilitate the formation of voids and the initiation of cracks. 34
Conclusion
This article provides the analysis of several welded joints of 1.4462 DSS executed using Nd:YAG type disk laser with a combination of different variables such as laser beam power (kW) and the focus distance from the joint surface (mm). The analysis concerned tests of macro- and microstructure of welded joints, ferrite content, and microhardness measurements in the HAZ and the base material as well as strength properties of welded joints. Here are the main concluding points of the conducted tests:
The power of the laser welding directly affects the geometric dimensions of the weld cross section regardless of the laser beam focus distance from the plate surface. Increased laser power increases the WZA.
The best weld shape with the lowest FA and RA was obtained for parameters 04 and 14. However, the ferrite/austenite ratio was not satisfactory, particularly for WZ. Also, relatively low elongation was obtained for these welding parameters.
Selection of the optimal power value to be applied for laser welding is an important factor influencing the yield point of a welded joint. Relative elongation of the welding joint depends directly on the welding power change. The greatest elongation and comparable microhardness of all welded zones were observed for the samples welded by laser power of 2 kW (parameters 01 and 11); elongation changes are directly related to the microhardness in particular zones and the locations of the fracture. The cracks’ location in WZ (smaller geometric notch compared to root and toe) and lower hardness in HAZ and WZ when compared to BM increase the elongation.
Higher linear energy (heat input) of welding and lower cooling rate after welding cause higher share of austenite phase in the WZ.
Footnotes
Handling Editor: Shan-Tung Tu
Declaration of conflicting interests
The author(s) declared no potential conflicts of interest with respect to the research, authorship, and/or publication of this article.
Funding
The author(s) disclosed receipt of the following financial support for the research, authorship, and/or publication of this article: This work was partially supported by the project (No. POIG.01.04.00-04-206/12) funded as a part of Operational Program Innowacyjna Gospodarka, 2007–2013, Priorytet 1. Badania i rozwój nowoczesnych technologii, Działanie 1.4. Wsparcie projektów celowych.