
Abstract
Welded joints of poor welding surface quality are sensitive to stress concentrations, affecting both the tensile strength of workpieces and the fluidity of liquids and gases in pressure and liquid containers. Orthogonal experiments involving the laser welding of 1-mm-thick duplex stainless steel sheets were conducted using different electric current, pulse width and frequency values in order to analyse the effect of welding properties on the surface characteristics of the welded joints. Rapid judgement regarding the welded joint properties was made based on the observed welding surface quality. The results show that an even phase proportion and grain refinement are not necessarily guaranteed to provide good welding surface quality. A satisfactory welding surface quality characterised by a smaller spot pitch or spot pitch difference, smaller weld width, reduced surface roughness and valley depth of surface waviness implies better welded joint mechanical characteristics and a more even microstructure. The specimen with the most suitable welding parameters and the greatest heat input can reach the lowest volume fraction of ferrite phase of 42.5% and the highest tensile strength of 848 MPa, and its surface quality is the best.
Keywords
Introduction
2205 duplex stainless steels (DSS), which contain a generally equal volume fraction of ferrite and austenite, are widely used in undersea pipelines carrying petroleum, chemicals or other highly corrosive substances due to their higher strength than austenitic stainless steels, better resistance to chloride stress corrosion and lower embrittlement tendency after welding.1–4
Laser welding is a highly efficient material connection technology that has only a small impact on workpiece deformation and the heat-affected zone (HAZ). Furthermore, as the resulting welding quality is good even without the use of fill wires and as the technique is pollution free, laser welding is considered a good replacement for 2205 DSS welding compared to traditional welding methods. A number of studies have been carried out regarding the changes in DSS microstructure and alloying elements that take place during laser welding, with the microstructure of laser-welded DSS very much dependent on heat input, cooling rate, composition and other welding parameters. 5 In addition, weld spot overlap type and the cooling rate are considered to determine the solidification zones of the welded joint; by increasing the overlapping distance, the solidification pattern governed by heat extraction to the previous weld spot can form continuously without disruption, leading to a central array of axial grains. 6 Some researchers have concentrated on processing improvement, with the identification of appropriate welding parameters, 7 the use of shielding gas as welding protection8,9 and other welding processing conditions10,11 employed to obtain better welds and to maximise DSS material performance. Such studies compare welding performance based on the parameters including welding microstructure, ferrite–austenite ratio and corrosion resistance. However, the surface quality of laser-welded DSS has been almost ignored for many years. Nevertheless, some researchers have conducted welding simulations and/or the theoretical modelling of other materials regarding the welding deformation caused by the weld pool. For example, S Tashiro et al. 12 developed a simulation model aimed at clarifying the formation mechanism of welds in laser cladding in order to prevent incomplete fusion, employing numerical simulation that considered the deformation of the weld pool surface and convective heat transfer in the weld pool. Pang SY et al. 13 used the response surface methodology to investigate and predict the effects of various process parameters, including laser power, welding speed, laser beam size and clamp pressure, on the weld seam width in the laser transmission welding of thermoplastic. These latter studies thus provide a good reference with which to study DSS welding surface quality.
In addition, a small number of studies have been carried out that examine the welding surface quality of stainless steel or similar metals/alloys. G Chen et al. 14 found that the autogenous laser welding of a 12-mm-thick SUS304 stainless steel plate frequently caused surface welding defects such as spatter, surface undercut and root hump; the adoption of reasonable measures was considered necessary in order to efficiently improve the welding quality, making the welding surface smooth and well distributed. K Kalaiselvan et al. 15 studied crack formation and surface morphology in the butt joint welding zone of dissimilar metal (Ti Gr5 (Ti) and AA2024 (Al) alloy) sheets. Experimental investigation revealed that whereas cracks and other surface imperfections were formed at lower weld speeds, such imperfections were eliminated at higher speeds. B Chang et al. 16 developed a numerical model of fluid flow in the weld pool in LB-PAW of 1420 Al-Li alloy for three welding methods. Whereas welds with arc leading were poor, with deep pits and big veins, those with laser leading were good, with a smooth surface. In the LB-PAW of the 1420 Al-Li alloy, the surface formation quality of the weld was found to be closely related to the fluid flow in the weld pool, with the plasma arc force being one of the key factors.
Welding surface quality plays an important role in the tube welding of pressure and liquid containers, mainly affecting the fluidity of and corrosion resistance to the contained liquids and gases. In addition, surfaces with welding sink are sensitive to stress concentrations, which affect the fatigue strength of the workpiece. Despite the considerable recent improvement made in DSS laser welding, there remains a need to study welded joint surface characteristics in order to form a more accurate judgement of welded joint properties and welding surface quality. In this study, orthogonal experiments involving the laser welding of 1-mm-thick DSS sheets were conducted using different values of electric current, pulse width, frequency, defocus distance and shielding gas in order to analyse the effects of these welding properties on the surface characteristics of the welded joint. Welding surface quality was studied based on surface morphology, surface roughness and a three-dimensional (3D) model of the welded joint, with microstructures, welded width and weld spot pitch used to make a qualitative judgement of welding quality.
Materials and experimental method
Test materials
The material used in this study was UNS S32205/S31803 commercial DSS made by OUTO KUMPU Stainless Steel Co., Ltd, Sweden. Specimens were
Chemical composition of 2205 DSS.
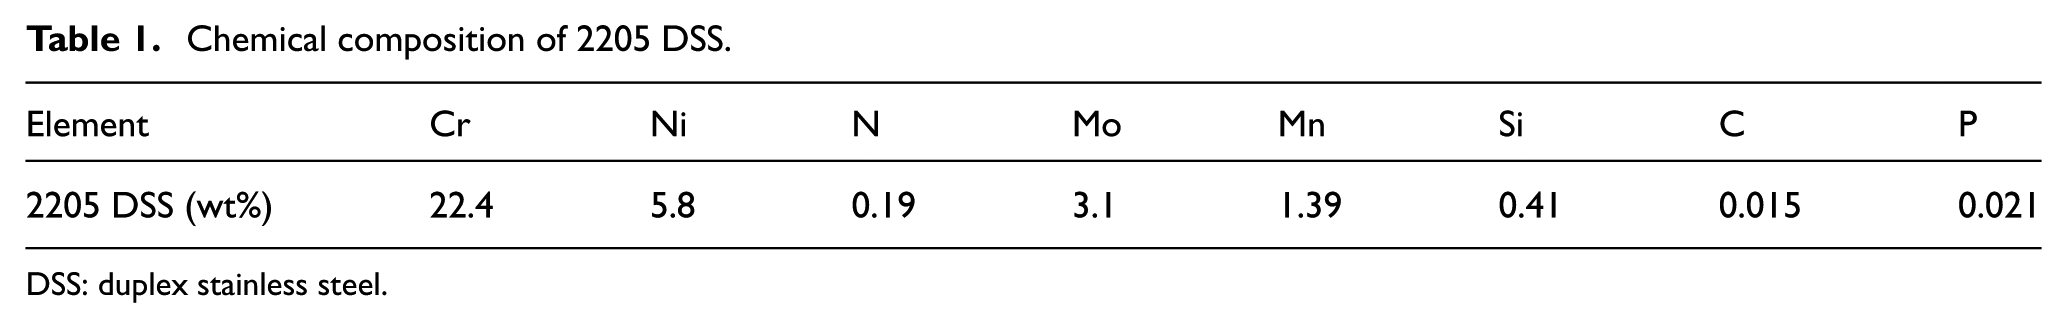
DSS: duplex stainless steel.
Experimental setup
The experimental setup is shown schematically in Figure 1. Experiments were performed using an HYM-750 pulsed Nd:YAG laser processing machine, with pure argon (99.99% argon mixed with 0.01% oxygen) as the shielding gas. Randomly repeated four-factor three-level orthogonal tests L9(34) were applied (Table 2), with specimens named as in Table 2. The defocus distance (Z) was −1 mm.

Schematic of experimental setup.

The naming rules of x(t): x is the specimen number from 1–9 and t is the heat input value.
Mechanical tests
Tensile tests were carried out on the standard specimen after welding using a microcomputer-controlled electronic universal testing machine (WDW3100) at a travel speed of 3 mm/min. Tensile specimens were cut by a wire electrical discharge machine (WEDM) to the size shown in Figure 2.

Sample size for tensile tests (unit: mm).
Metallographic studies
The cross-section of the welded joint was ground, burnished and etched prior to observation, using an etchant comprising 50 mL alcohol, 50 mL 4% HCl and 5 g FeCl3. A metallographic microscope (4XC-NS) was employed for microscopic observation and Phenom ProX for energy-dispersive X-ray spectroscopy (EDS) analysis.
Surface observation
Welded joint morphology was observed under a super depth of field 3D microscopic system (VHX–600E), laser confocal (3D measurement) microscope (OLS4100) and scanning electron microscope (S-3400N). The selection of test points is shown in Figure 3.

Test point distribution for surface roughness and spectrum analysis.
Experimental results and discussion
Welded joint properties
Tensile test
Figure 4 shows that the tensile strength of specimen 5(13) (σb = 848 MPa), produced at a current of 160 A, pulse width of 5 ms, pulse frequency of 20 Hz and welding speed of 600 mm/min, was the highest and was slightly higher than that of the base metal (σb = 834 MPa). Proper welding parameter values ensure sufficient heat absorption and the full melting of the material, which is accompanied by an increased depth of fusion and higher tensile strength. The lowest tensile strength (σb = 469 MPa) was found in specimen 1(5) due to insufficient melting at too rapid a welding speed (700 mm/min) and too low a frequency (15 Hz).

Tensile strength of specimens produced using different welding parameter values.
Figure 5 shows a stress–strain curve of specimens 1(5), 5(13) and 9(11) and base metal. The stress–strain curve of specimens 1(5) and 9(11) are short and the tensile strength values are poor. Among all those specimens, the stress–strain curve of specimen 5(13) is closest to that of the base metal. It is obvious that the weld defects caused by improper welding parameters, such as lack of penetration and surface burn, are the main reasons for the decrease of tensile strength of the weldments. Compared with the results of Köse and Kaçar, 17 the defect weldments were broken before they were fully extended.

Stress–strain curves of welding specimens and base metal.
Macro- and metallographic analysis of welded joints
Typical macroscopic welded joints are shown in Figure 6. Welded spots of specimen 1(5) are irregular and slag and undercut are obviously on the surface of the welded joint. Welded joint of specimen 5(13) is uniform and neat overall without the phenomena of slag and undercut. Although the surface of specimen 9(11) is neat and tidy, surface burns and slag splashing still exist.
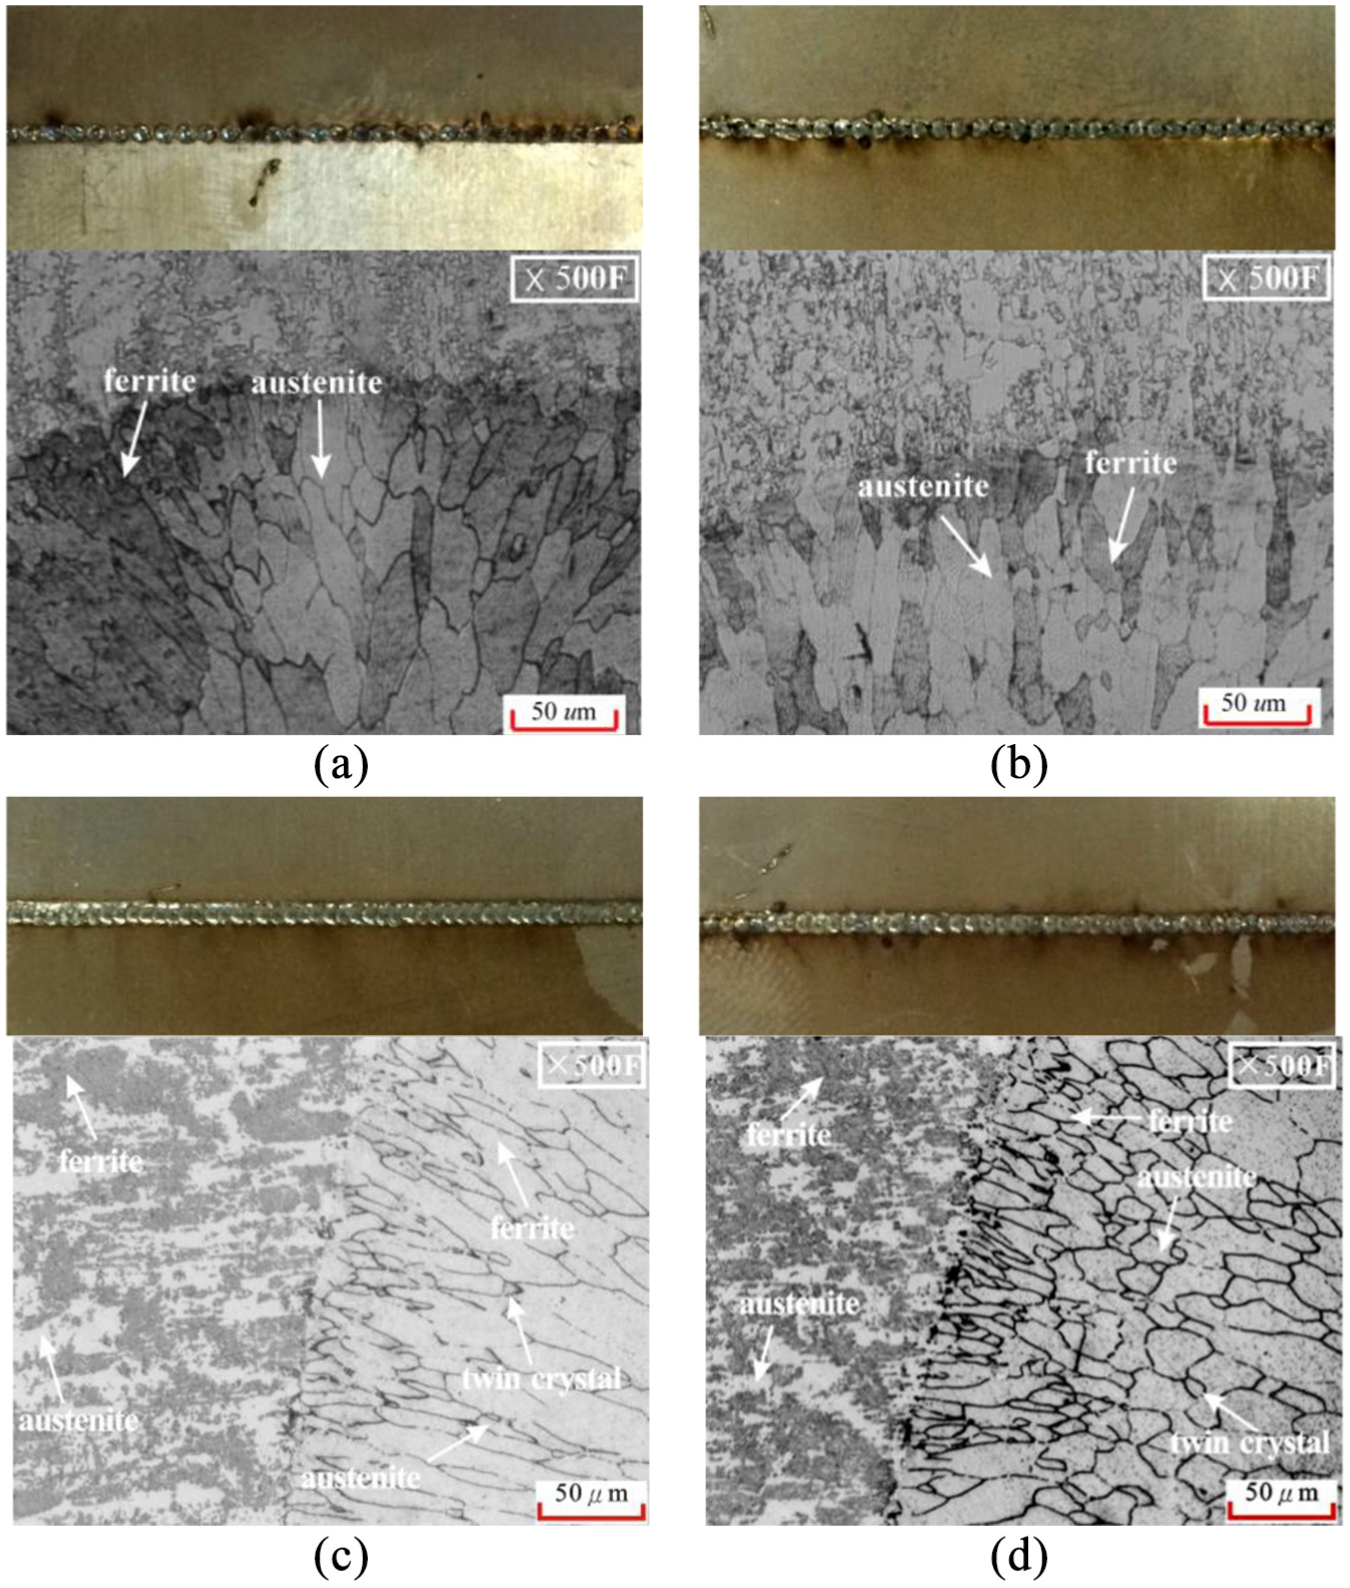
Metallographic images of welds and HAZ: 18 (a) specimen 1(5), (b) specimen 4(8), (c) specimen 5(13) and (d) specimen 9(11).
Influenced by the welding thermal cycle, the centre weld of specimen 1(5) shown in Figure 6(a) is almost ferrite with a large crystal size, having been transformed from an austenite phase during solidification; a small amount of austenite still remains on the boundary of the weld seam. The volume fraction of ferrite phase is 73.7% in specimen 1(5), which is the greatest in all specimens. Overall, the weld seam of this specimen trends towards the characteristics of ferrite, exhibiting poor intensity and plasticity, low tensile strength and higher surface roughness (as confirmed in Figure 4 and Table 3). For specimen 4(8) in Figure 6(b), the austenite phase obviously increases with the volume fraction of the ferrite phase declining to 62.2%.
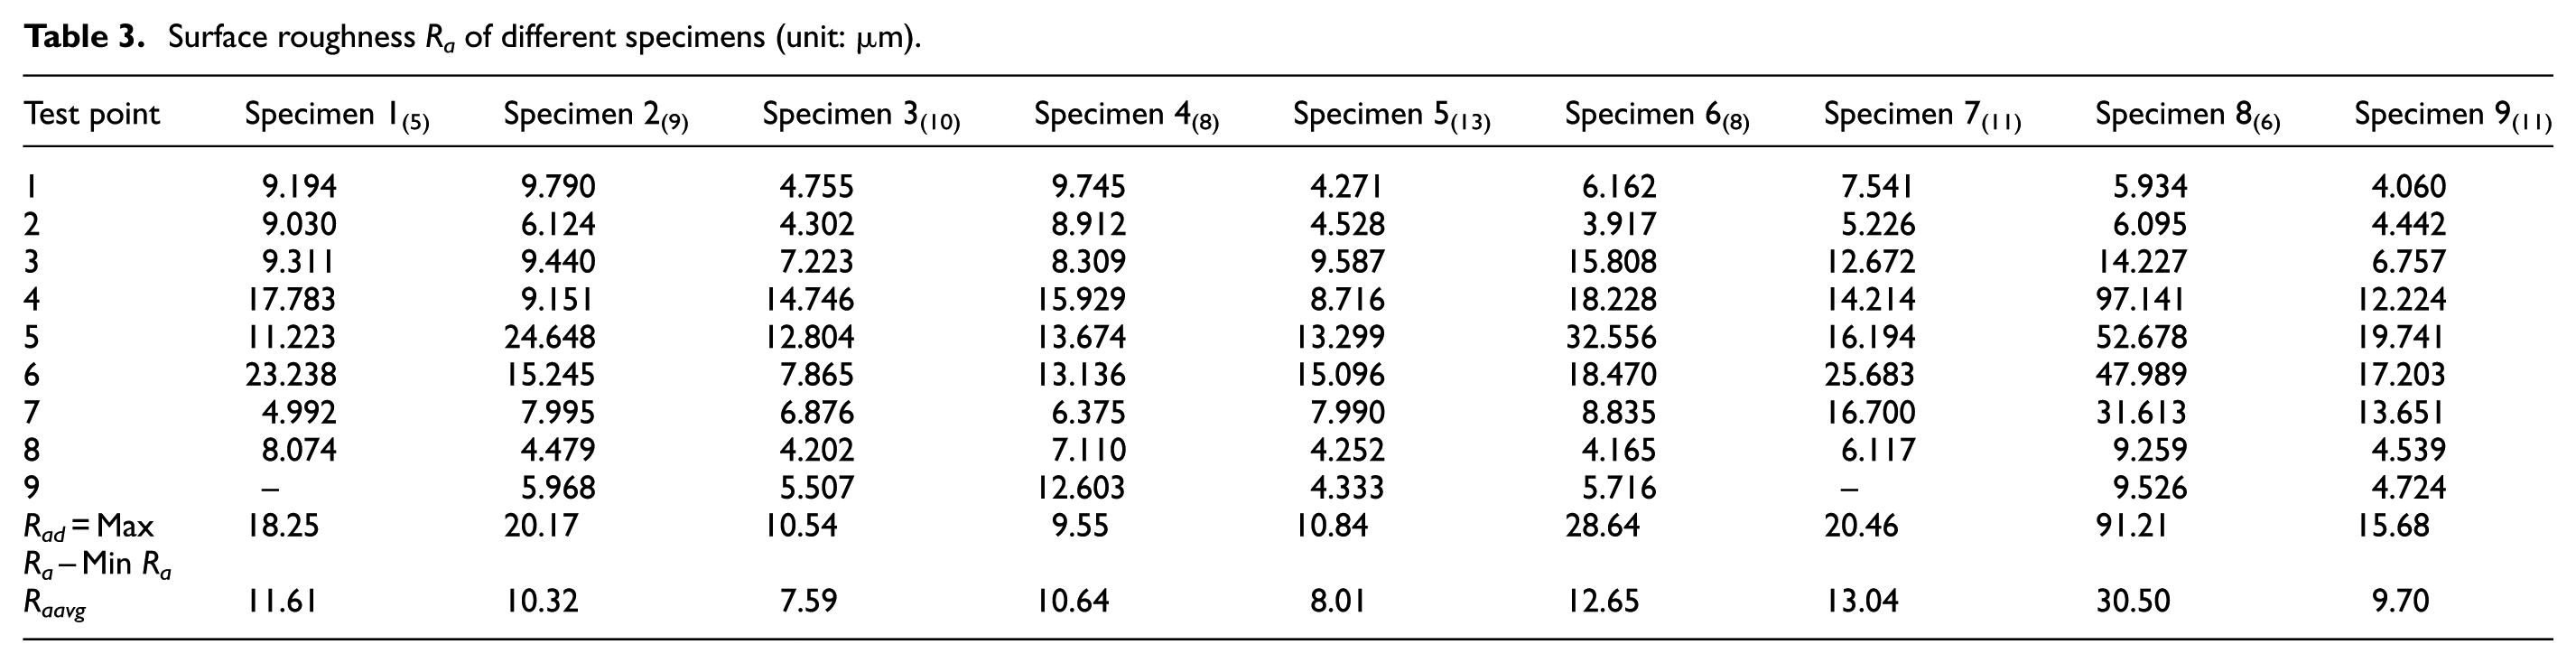
Surface roughness Ra of different specimens (unit: µm).
As can be seen in Figure 6(c), the crystal size of specimen 5(13) is also larger in the central area of the weld seam and smaller around the welds. However, in this case the crystal size is uniform, with no obvious large region of tiny crystals. The respective amounts of austenite (light areas) and ferrite (dark areas) both in the weld seam and outside are roughly equal, 18 where its volume fraction of the ferrite phase is 42.5% and very close to the volume fraction of the base metal (43.3%). This suggests that the ferrite and austenite phases in this welded joint were controlled to be close to a 1:1 proportion and in a state of relative balance, so that this welded joint exhibited the highest tensile strength of all those tested.
According to Figure 6(d), the austenite content in the centre of welds of specimen 9(11) is increased, with the crystal size nearly average. In the HAZ, the content of ferrite (dark area) is higher than that of austenite (light area), which likely slightly reduced the welding strength and welding performance of the specimen, as supported by the tensile test results. Although refined austenite is obviously formed both at the grain boundaries and within the grains of specimen 9(11) due to the decreased cooling rate, burn-out is also apparent on the welded joint surface, taking into account the maximum welding unit energy employed under these experimental conditions.
All those three samples’ microstructures also have narrow HAZ even with normal heat input and thin plate welding, while the phase of HAZ is mainly ferrite regardless of the welding conditions.17,19
Relationship between metallographic zones and surface splash
The microstructure of the welded seam can be divided into four zones: A, B, C and D (Figure 7(a)). Whereas solidification in zone B is dominated by heat extraction to the side walls, solidification in zones A and D is dominated by heat extraction to the previous weld spot, 6 and zone C is the HAZ between zones A and B or zones B and D. A large temperature difference is likely to occur between these different microstructures, such as between zones B and C, and between zone B and the base metal, with these areas also being characterised by the presence of surface defects. The majority of metal splashing or undercutting occurs on the connection area of different zones and rarely inside zones A and D (as shown in Figures 7(b) and 9), which clearly indicates that the large temperature difference and welding spots produced at different time are the causes of slag splashing.

Metallographic zone and metal flow in the welded joint (specimen 5(13)): (a) metallographic zone and (b) metal flow and splash.
The welded seam surface exhibits a ripple shape from the centre to the circumference (Figure 7(b)), with the ripples becoming clearer with increasing distance from the centre of the weld point. This pattern may be due to the fact that the temperature gradient on the edge of the welded seam is large and the cooling rate is increased, with these differences thus contributing to the generation of ‘ripples’. In contrast, as the temperature gradient in the central area is relatively small, the difference between the solidification rates of metal cooling is minor and thus the ‘ripple’ phenomenon is less obvious.
EDS analysis of welded joints and base metal
The phase balance in a welded joint plays a significant role in the latter’s welding performance. It is well known that a ferrite–austenite phase distribution 50/50 in welded joints of DSS can ensure the best mechanical and corrosion properties. 1 Figure 8 shows the proportional (mass percentage) distribution of the elements Cr and Ni in the obtained welded joints (specimens 1(5), 5(13) and 9(11)) and the base metal, with Cr representing the change in ferrite and Ni representing the separation of austenite. Analysis of these figures reveals that whereas Cr and Ni are distributed unevenly in specimen 1(5), with Cr content generally higher (at the left and central testing points) than in the base metal, both elements are distributed more evenly in specimen 5(13) and at levels close to those of the base metal. The distribution of Cr and Ni in specimen 9(11) lies somewhere between that of specimens 1(5) and 5(13). When combined with the mechanical test results, it can be assumed that an even distribution of Cr and Ni in welded joints and components as close to that of the base metal as possible will result in the best mechanical properties.

Proportional distribution of Cr and Ni in welded joints and base metal: (a) distribution of Cr and (b) distribution of Ni.
Surface characteristics of welded joints
Surface morphology of welded joints
The front and rear weld morphologies of the specimens analysed in the orthogonal experiment are shown in Figure 9. Distinct splashed molten metal can be observed on specimens 1(5), 7(11), 8(6) and 9(11), with an irregular shape of welded spot, bumps and undercutting, all of which greatly damage the welding surface quality. All of these specimens were burned to a brown colour, especially on the back sides of the welded seam. Furthermore, slag metal hanging to the back of the weld was also observed in some unsatisfactory cases, with the welded joint overlap rate either too low (Figure 9(a) and (b)) or too high (Figure 9(i)). In such cases welding faults and intervals on the back of the weld seam were generated and the tensile strength of welds decreased; this is the main reason why the tensile strength of specimen 1(5) was the lowest of all those tested. In contrast, despite the poor welding surface quality of specimen 9(11), its welding performance was significantly enhanced due to sufficient weld penetration. In the most satisfactory case, the welded joint metal of the specimen absorbed sufficient heat and then fully melted (Figure 9(e)), with the overlap rate on the obverse of the weld seam about 75%. In addition, defects such as molten metal splashes and hanging slag were barely visible, greatly improving the quality of welding appearance. 18 Overall, the surface morphology of specimen 5(13) was the best of all those tested.
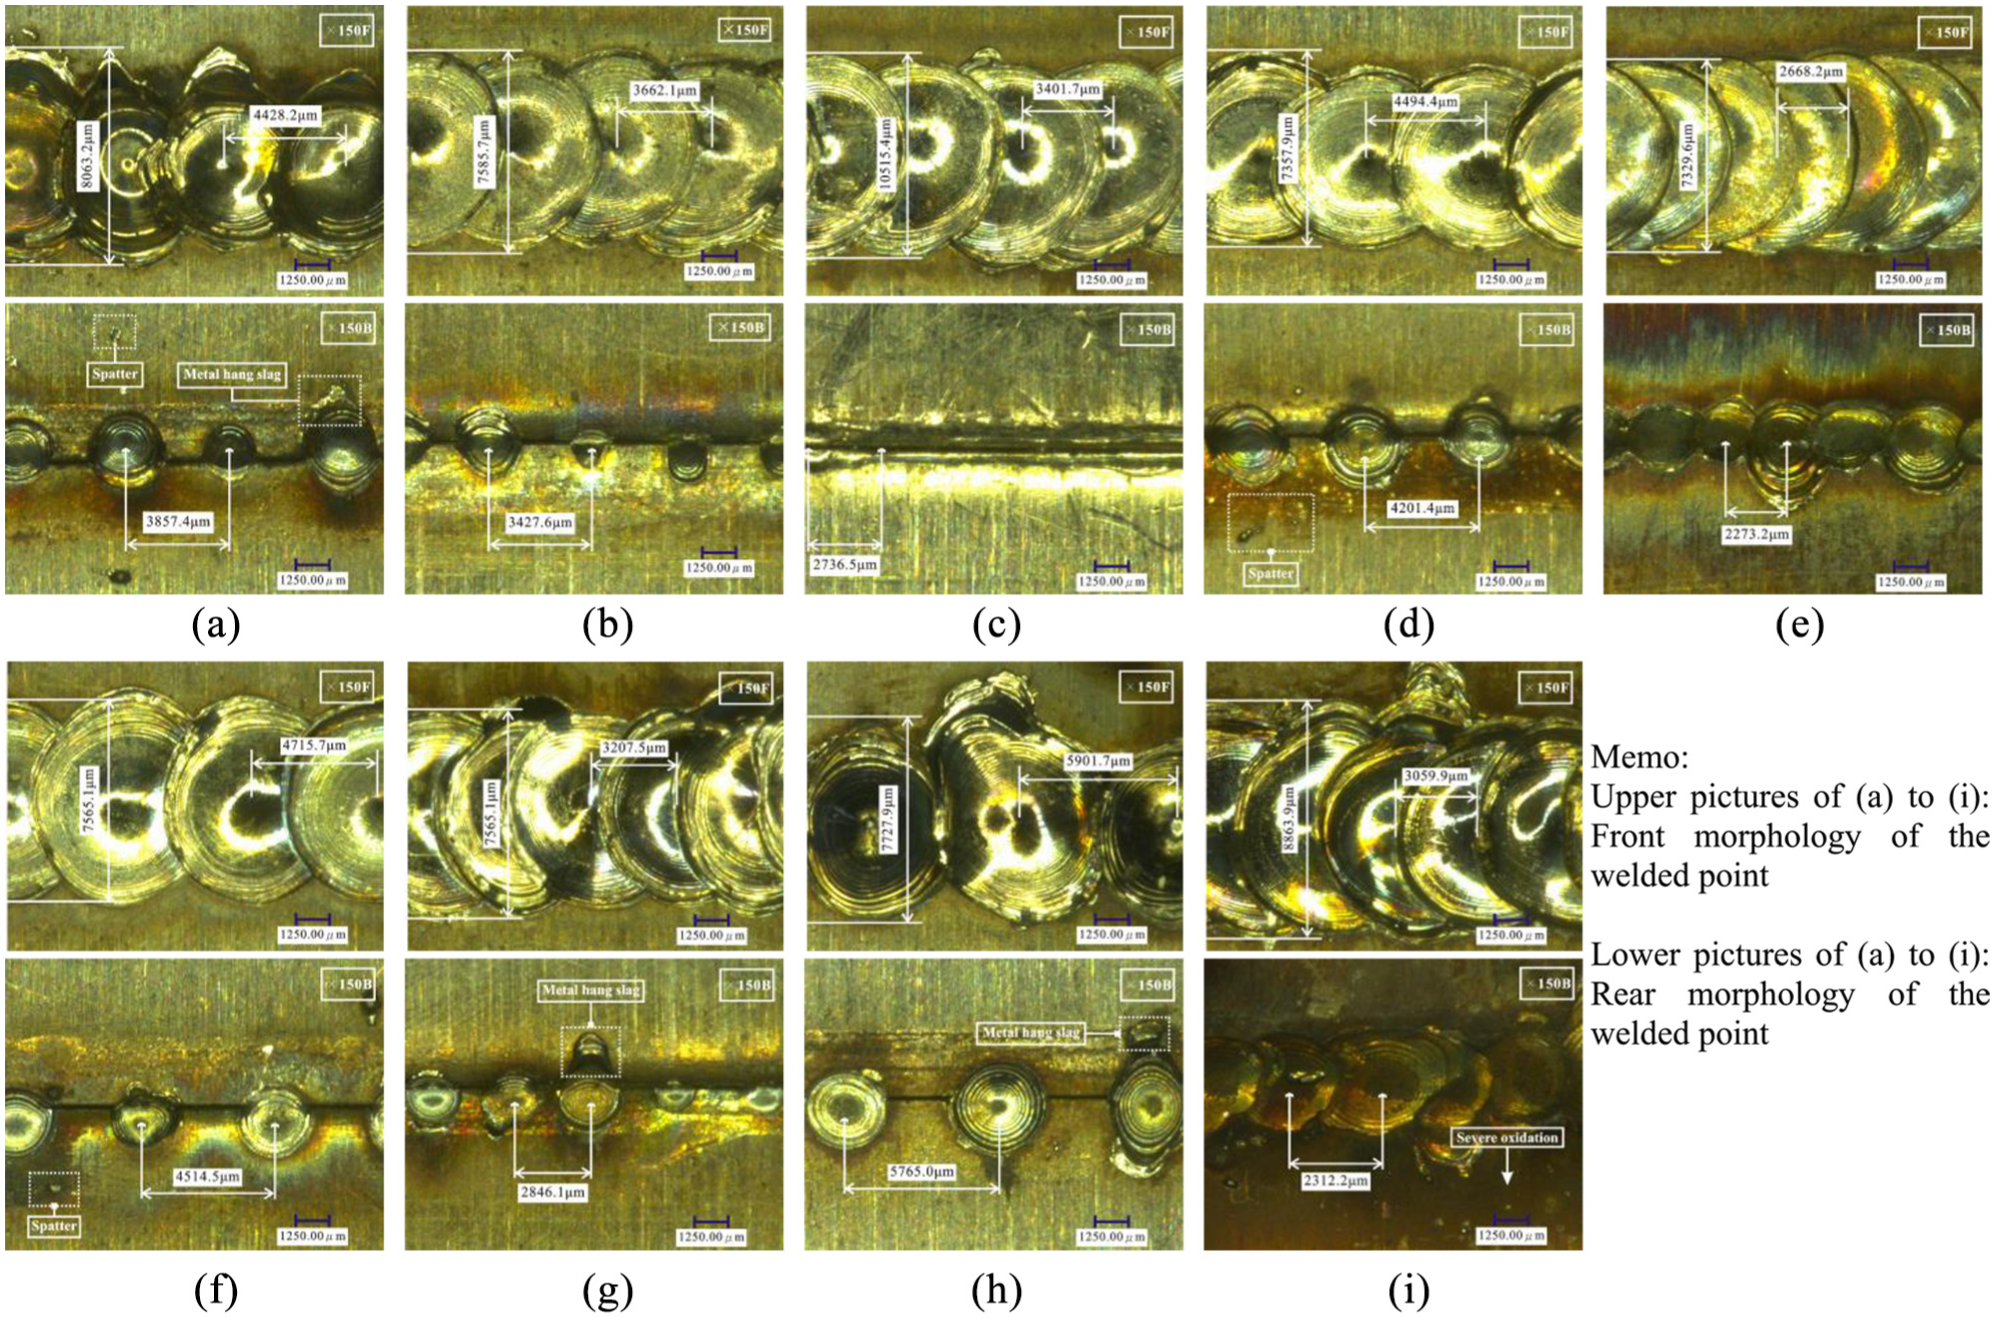
Surface morphologies of the obtained welded points: (a) specimen 1(5), (b) specimen 2(9), (c) specimen 3(10), (d) specimen 4(8), (e) specimen 5(13), (f) specimen 6(8), (g) specimen 7(11), (h) specimen 8(6) and (i) specimen 9(11).
Surface roughness and 3D modelling of welded joints
3D modelling of a welded joint is an effective method with which to survey the latter’s surface roughness, establish the welded point surface sinking form and sinking value, and determine its impact on surface quality. Figure 10 shows the results of laser confocal microscopy of specimen 5(13), including the weld seam thickness distribution, while Table 3 displays the values of surface roughness Ra, which represents the irregularity of the surface profile, obtained for each of the nine specimens. According to this table, the surface roughness values recorded at test points 4, 5 and 6, which are located in the welded joint centre and fusion zone, are larger than those obtained at the other test points (of which 3 and 7 are considered equivalent to the HAZ, while 1, 2, 8 and 9 are the base metal). In Figure 9, it is obvious that specimens 1(5), 7(11) and 8(6) exhibit the roughest surface and surface morphology. Specimen 5(13) showed the best surface roughness, presenting a nearly normal distribution. Although the surface roughness of specimen 9(11) was relatively low, its burned-out morphology may increase the possibility of undercutting and inner cracks.

Laser confocal microscopy of specimen 5: (a) The top view; and (b) The horizontal view(13).
Surface waviness of welded joints
For small-size tubular pressure and liquid containers, the flatness of the inner wall has a great effect on the fluid hydrodynamic state. Therefore, surface waviness of the welded joint is an important quality criterion for such applications. Figure 11 shows the biggest valley depth of surface waviness of the tested welded joints as measured by 3D modelling. It is clear from this figure that those specimens with lower surface roughness also exhibit smaller valley depths of surface waviness. Of all those tested, specimen 5(13) achieved the smallest value of both parameters, thus representing the best flatness of the welded seam.
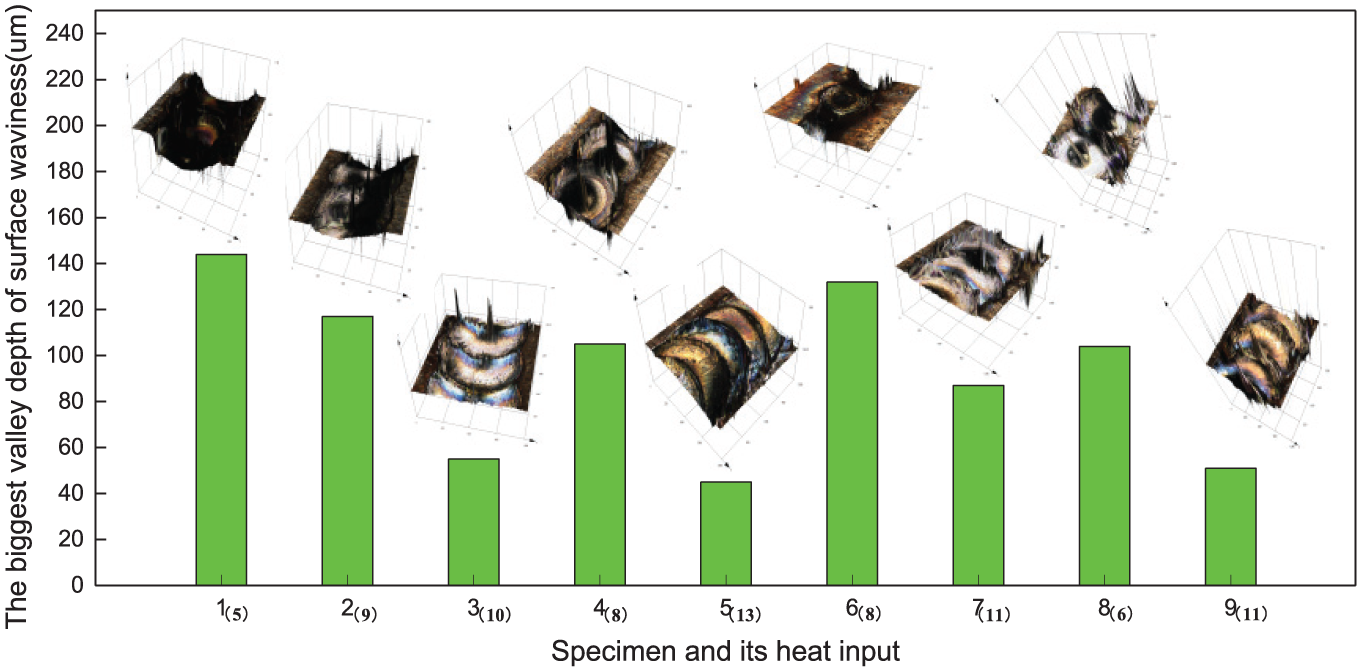
Welding sinking values measured by 3D modelling of welded joints.
Weld width of welded joints
Welding surface morphology has been widely studied for a long time. 20 However, the surface quality of welding is not only a neat and tidy welding seam, but also a uniform weld spot and suitable spot distance. Comparing Figures 9 and 12, two experimental scenarios resulted in increased weld width: an excessive amount of input energy and too slow a welding speed, which led to burning weld (Figure 9(i)), and too small an input energy and too fast a welding speed, which led to non-penetrating weld (Figure 9(c)). In the case of specimen 3(10), which exhibited the widest weld width, its surface roughness distribution was relatively uniform and small. Thus, it can be inferred that when heat spreads mainly to the material surface, the weld surface roughness is uniform but the weld width increases.

Weld width of front weldment surface for each specimen.
Weld spot pitch
Ideally, welding should be characterised by the same distance between spots on the front and back surfaces, as shown in Figure 13(a). However, due to the direction of welding speed and heat transfer, as well as the thermal effect of adjacent areas and welding heat flow, the actual situation is as depicted in Figure 13(b). Specimens 3(10), 5(13) and 9(11), which exhibited the smallest spot pitch (Figure 14), also presented the lowest Rad, Raavg, valley depth of surface waviness and the highest tensile strength values (Table 3 and Figures 4 and 10). However, specimen 3(10) was also characterised by a large spot pitch difference between its front and back surfaces, while its welded width was the largest, which is indicative of inadequate heat penetration and heat extraction to the side wall. The same phenomenon likely took place during the welding of specimen 9(11), with an excessive amount of welding energy acting on the specimen.

Change in the centre spacing of the welded joint surface: (a) L1 = L2 and (b) L3 > L4.

Spot distance of the specimen front and back surfaces.
Combining all the analyses described above, it is clearly apparent that the weld surface characteristics are affected by joint properties to a considerable degree. Therefore, a welding surface characterised by a smaller spot pitch or spot pitch difference, as well as smaller weld width, surface roughness and welding sinking values, implies better welded joint properties.
Conclusion
Orthogonal experiments involving the laser welding of 1-mm-thick DSS sheets were conducted using different electric current, pulse width and frequency values in order to examine the effect of welding properties on the welded joint surface characteristics. Overall, the results revealed that the joint properties and surface quality are strongly correlative with each other, with the following conclusions reached:
Although an even phase proportion (as observed in specimen 5(13)) and the rapid cooling of the welding process causing grain refinement (as observed in specimen 9(11)) can both lead to excellent joint performance, high welding surface quality is not necessarily guaranteed. When the welding current is greater than 160 A and the welding speed is 500 mm/min, the surface quality is not good enough even though the internal tissue and phase composition are relatively ideal.
Welding parameters play an important role in welded joint surface quality. Appropriate parameter values ensure sufficient melting and heat penetration, which in turn reduce both welding sink and splashing. Specimen 5(13) with the most suitable welding parameters (current of 150 A, pulse width of 5 ms, frequency of 25 Hz, welding speed of 500 mm/min and heat input of 13 J/mm2) can reach the lowest volume fraction of the ferrite phase of 42.5% and the highest tensile strength of 848 MPa, and its surface quality is the best.
Surface morphology, surface roughness, valley depth of surface waviness, weld width and spot pitch of the front and back surfaces can be used collectively to make a rapid judgement of the welded joint properties. Welding surfaces characterised by a smaller spot pitch or spot pitch difference, smaller weld width, lower surface roughness and valley depth of surface waviness imply better welded joint mechanical characteristics and a more even microstructure.
Heat input is an effective parameter to judge surface quality and material properties. Under the existing experimental conditions, the higher the heat input, the better the surface quality and the material performance. The heat input of specimen 1(5) is the smallest, and its material properties are the worst, which shows that the lowest tensile strength is 469 MPa, the ferrite content is the largest, that is, 73.7%, and it is easy to be broken at the minimum yield stress. Meanwhile, the surface quality of specimen 1(5) is poor with the greater surface roughness difference Rad of 18.25 and the maximum valley depth of surface waviness of 143 µm.
Footnotes
Acknowledgements
Thanks go to the S.M. Wu Manufacturing Research Centre at the University of Michigan for offering research assistance during the authors’ stay in the United States.
Handling Editor: Farzad Ebrahimi
Declaration of conflicting interests
The author(s) declared no potential conflicts of interest with respect to the research, authorship and/or publication of this article.
Funding
The author(s) disclosed receipt of the following financial support for the research, authorship and/or publication of this article: This study was supported by the National Natural Science Foundation of China (Grant No. 51565005) and the Guangxi Key Laboratory of Manufacturing System & Advanced Manufacturing Technology (Grant No. 12-071-11S07).