
Abstract
Braking performance plays a vital role for the safety in vehicle operation, so the measurement of braking performance is very important. In this article, an automatic measurement method for braking performance measurement using binocular stereo vision is proposed in order to obtain the vehicle’s braking trajectory and other performance characteristics in real time. First, this article describes the principles of stereo vision in the context of measuring vehicle braking performance. Then, it focuses on image processing algorithm for stereo vision and the three-dimensional reconstruction algorithm. Finally, the reliability of the measurement system is verified through multiple sets of real vehicle experiments on different car models. The results show that the proposed vehicle braking performance measurement system can perform automated and non-contact measurements. The detection system presented in this article has good detection accuracy and repeatability, and its detection time is short, so it can meet the needs of vehicle online testing.
Introduction
The braking performance of automobiles is an important factor contributing to safe driving, and measurement of braking performance is also an important part of the vehicle detection. The measurement result reflects the actual condition of the automobile and is directly related to the safety of the car on the road. Therefore, it is of great theoretical and practical significance to improve the accuracy and convenience of the braking performance measurement.
Braking performance measurement methods are divided into bench tests and road tests. Given the fact that bench test methods have the advantages of high efficiency, saving space, independence from weather condition, and others, most of the automobile assessment institutions choose this type of methods. In bench test methods, roller brake and plate brake testers are widely used. However, the shortcomings of bench test methods cannot be neglected. The roller brake tester is a type of static testing equipment, which cannot reflect the real-time dynamics of the braking process. 1 Besides, their low detection speeds are not suitable for transitory braking systems such as anti-lock braking system (ABS),2,3 and only the braking force can be tested, while direct parameters such as braking distance and stability of the vehicle cannot be determined. 4 Plate brake testers are also not suitable for vehicles with ABS, and this method is dependent on the car model. 5 In GB21861-2008, the measurement process of the car’s braking performance is clearly defined. It states that road tests should be applied as a final alternative for those vehicles that cannot be measured online or when results of other methods are questioned by manufacturers. 6 Therefore, the superiority and irreplaceable nature of road test methods have made road test technology of brake performance become a hot research topic.
There is a lot of research on road test technology on an international level, and several widely used methods have been analyzed. The first one is based on the braking track, with representative researchers of this kind of study being Wu et al., 7 Wu and Tang, 8 Tang, 9 and Li and Chen 10 from Northeast Forestry University. Based on the torque balance principle, they obtained the wheel’s trajectory under braking conditions using a pressure sensor. They used this method to detect the trajectory of each wheel, and then simulated a road test system. Finally, other parameters such as heading angle, braking distance, and lateral displacement were estimated for the vehicle braking process. In order to determine the braking distance and the average deceleration, a road test method based on the track for determining the braking stability was studied by Li et al. 11 from Southeast University. The method used for calculating the velocity and the motion coordinates of the vehicle during the braking process was the improved Kalman filter’s recursive algorithm. In addition, there is some research on methods using intelligent road test inspection equipment, such as fifth wheels,12–14 non-contact photoelectric analyzers, and portable braking performance analyzers. At present, the most widely used method is the portable braking performance tester,15,16 which employs microprocessor technology to quickly collect data and meet the requirements of high computational loads. Besides, this instrument can also measure acceleration performance, the friction coefficient of road surface, and the road gradient, so it can be used for studying a variety of models, including special vehicles. In addition, researchers have also developed some new road test equipment, such as an automobile braking performance measurement system which is based on Global Positioning System (GPS) technology.17,18 It acquires parameters such as acceleration, braking distance, initial velocity, and lateral path offset of the vehicle through the Doppler effect. It has high precision, but it is expensive.
In summary, road test methods are closer to the real conditions of vehicle braking and have therefore become a hot research topic. However, traditional bench test methods must be improved in order to measure more accurately the convenience and the stability of the braking performance. As a result, a new technology based on binocular stereo vision detection 19 was proposed for application in braking performance measurement. This technology, which is based on stereo vision, has developed rapidly 20 and has shown interesting results in distance measurement.21,22 At the same time, in recent years, a small number of scholars try to apply this method to vehicle detection,23–25 but the research results of stereo vision algorithm used in braking performance testing has not yet been found. In order to apply the technology based on binocular stereo vision to the braking performance measurement, some research results about the process of stereo vision algorithm were studied and analyzed. Stereo vision system includes image processing, feature extraction, stereo matching, and three-dimensional (3D) reconstruction. In the research of image processing,26,27 the method called median filter which eliminates the interference of image noise was proposed by Tukey 28 in 1971, and then many subsequent scholars optimized and improved the algorithm. In the image feature extraction, Hough transformation 29 is the classic method of line extraction; this algorithm implements the mapping from the image space to the parameter space. A thorough and extensive research has been carried out by some of the scholars, and many valuable results have been obtained.30,31 This article is also based on the standard Hough transformation and improved the algorithm. In the research of stereo matching, Guo et al. 32 proposed a matching algorithm based on disparity gradient. Marenchino 33 studied the area-based matching algorithm and proposed a multi-image matching approach based on cross correlation.
Based on the foregoing considerations, this article focuses on the study of a road test method and presents a test system based on stereo vision which meets the national standards of “the safe operation of motor vehicles’ technical conditions.” This article presents a method based on stereo vision theory, camera calibration, image feature extraction, stereo matching, and 3D reconstruction technology and constitutes a study of the dynamic model of the automobile braking process. Furthermore, a prototype system for the visual measurement of automobile braking performance was designed, and the measurement accuracy was verified using a real vehicle.
Vehicle braking performance measurement system based on binocular stereo vision
Binocular stereo vision algorithm
Binocular stereo vision is based on human visual perception of distance to obtain 3D information. This method is based on the principle of triangulation, where two or more cameras are used to acquire an image of the same scene from different locations and recover distance information by observing parallax. The principle of binocular stereo vision imaging 34 is shown in Figure 1.

Schematic diagram of binocular stereo vision.
The image in Figure 1 is a binocular stereo vision imaging process with parallel axes. Two cameras in the figure represent the “left” and “right eye” and obtain images of the feature point

In the above equation, the focal length of the camera is

Therefore, when the corresponding points on the left and right cameras were correctly matched, the 3D coordinates of a point can be determined using the parallax principle. The 3D coordinates of the object in the cameras’ coordinate system can be obtained after all the points have been calculated.
Measurement of vehicle braking performance using stereo vision technology
During the measurement process, the whole sequence of vehicle braking is recorded by the cameras. Then, the car image is reconstructed as a point using image processing methods and stereo vision algorithms. Let us assume that the car is at point
As shown in Figure 2, the lateral path offset and initial direction are set to coincide with the x- and y-axis, respectively, and the initial deviation of the car is 0. Let us assume that the car moves to the right side when braking and that the angle between the direction of the vehicle’s movement and the initial direction is


Vehicle braking trajectory.
Calibration and image processing of visual detection system
As can be seen, the key to measuring a vehicle’s braking performance by stereo vision is to use the cameras to capture the images of each moment in the car braking process, and then use image processing techniques to determine the spatial coordinates. Therefore, the camera parameter settings and image processing results will directly affect the measurement accuracy of the system.
Camera calibration
The accuracy of visual measurements depends on the result of camera calibration, so it is a very important step in ensuring accurate measurements. The main process of camera calibration is to determine the internal parameters and the external parameters of the camera. The internal parameters are the intrinsic parameters which are determined by the geometric features and the optical properties, that is, the optical center, effective focal length, and the distortion parameter. The external parameters are determined by the position and the orientation, and they can be defined as the 3 × 3 rotation matrix and the 3 × 1 translation matrix.
The traditional calibration method based on the 3D targets has the advantage that can quickly solve the camera parameters, but this method can only be used in an ideal situation. Ideal camera imaging model is a linear model, but in practice, the imaging lens has different degree of distortion, thus resulting in image shift. In view of this, an improved camera calibration method (camera calibration method based on distortion) is proposed to improve the calibration accuracy. In this method, the distortion of the image is removed by correcting the distorted image, and then the corrected image is calibrated by the linear model.
In the system, cameras are DH-HW3102UC series digital cameras with resolution of 2048 × 1536 from Beijing Daheng image production. The camera has a CMOS color digital image sensor, USB 2 interface, 8 mm lens focal length, and 3.2 μm × 3.2 μm pixel size. As shown in Figure 3, the camera is used to capture the target image. When the images from the left and right calibration targets are obtained, 27 points contained within them are used for calibration. The camera’s internal parameters are listed in Table 1.

Schematic diagram of camera calibration process.
Internal parameters of the cameras.

In Table 1,
The calibration results of the external parameters for the left camera were as follows:
The rotation matrix of the left camera was
The calibration results of the external parameters for the right camera were as follows:
The rotation matrix of the right camera was
According to imaging principles, a camera’s imaging matrix
Image acquisition of measured object
In order to make this method applicable to any type of car, a method for dealing with different models of different sizes must be applied. Placing markers at different locations on the test vehicle’s body can solve this problem. In this experiment, four pieces of A4 paper with the same size were used as markers. The vehicle’s braking performance test was carried out using the method proposed in this article, and braking process was recorded by the two cameras. Then, the images were extracted according to the order of the recorded video frames; a sample image is shown in Figure 4.

Images of the braking process.
Image enhancement and feature extraction
Binocular stereo vision can be used to obtain the spatial coordinates of objects using two images to reconstruct a 3D scene. In this process, image enhancement and feature extraction in two dimensions are the most important steps in obtaining the 3D reconstruction, along with the key technique of stereo matching and the establishment of the measurement model. In the experiment of this article, the images of the vehicle braking process which were acquired by the left and right cameras were enhanced in order to facilitate feature extraction. These steps lay the foundation for the subsequent stereo matching; they are also key steps in acquiring the braking trajectory of the vehicle.
Image enhancement
Image enhancement is a set of image processing methods used in order to meet specific needs. During processing, the important information in the image is highlighted, and the minor information is weaken or removed. This process is also a process which improves image quality in order to facilitate feature extraction. In the vision detection system, the main purpose of image enhancement is to make the image more suitable for feature extraction.
Image enhancement is mainly divided into the following steps: image smoothing, histogram equalization, and image sharpening.
Image smoothing. The process of image acquisition, processing, and transmission will produce noise; the noise will make the image blurred and causes a significant reduction in image quality. Image smoothing can eliminate noise and prevent the serious loss of image features. As shown in Figure 5, the image smoothing process shows that the images mixed with salt and pepper noise and Gauss noise become blurred, but the noise is eliminated after median filtering.
Histogram equalization. A difference in brightness between the images will also affect the results of stereo matching. In the binocular stereo vision system, even if the left and right cameras are of the same model and produced by the same manufacturer, their internal parameter values will not be completely identical. Moreover, the two cameras were installed at different positions, so their visual angles were different, and the intensity of detected light was also different. These factors will cause differences between pixels’ gray values for the same point. The brightness difference will affect the matching result, and histogram equalization is one way of eliminating this difference. In the process of histogram equalization, the original gray distribution in the image is transformed through some mapping rules, and then, a new gray level histogram was generated. The above steps equate the gray levels of the left and right images, so the brightness difference of the images is eliminated. The histogram homogenization process is shown in Figure 6.
Image sharpening. Because image smoothing and histogram equalization are differential or averaging operations, they result in blurred images, and some details disappear. In order to compensate for this phenomenon, the reverse operation is usually used, that is, image sharpening. The equalized image obtained in Figure 6 is sharpened, and the result is shown in Figure 7.

Image smoothing process.
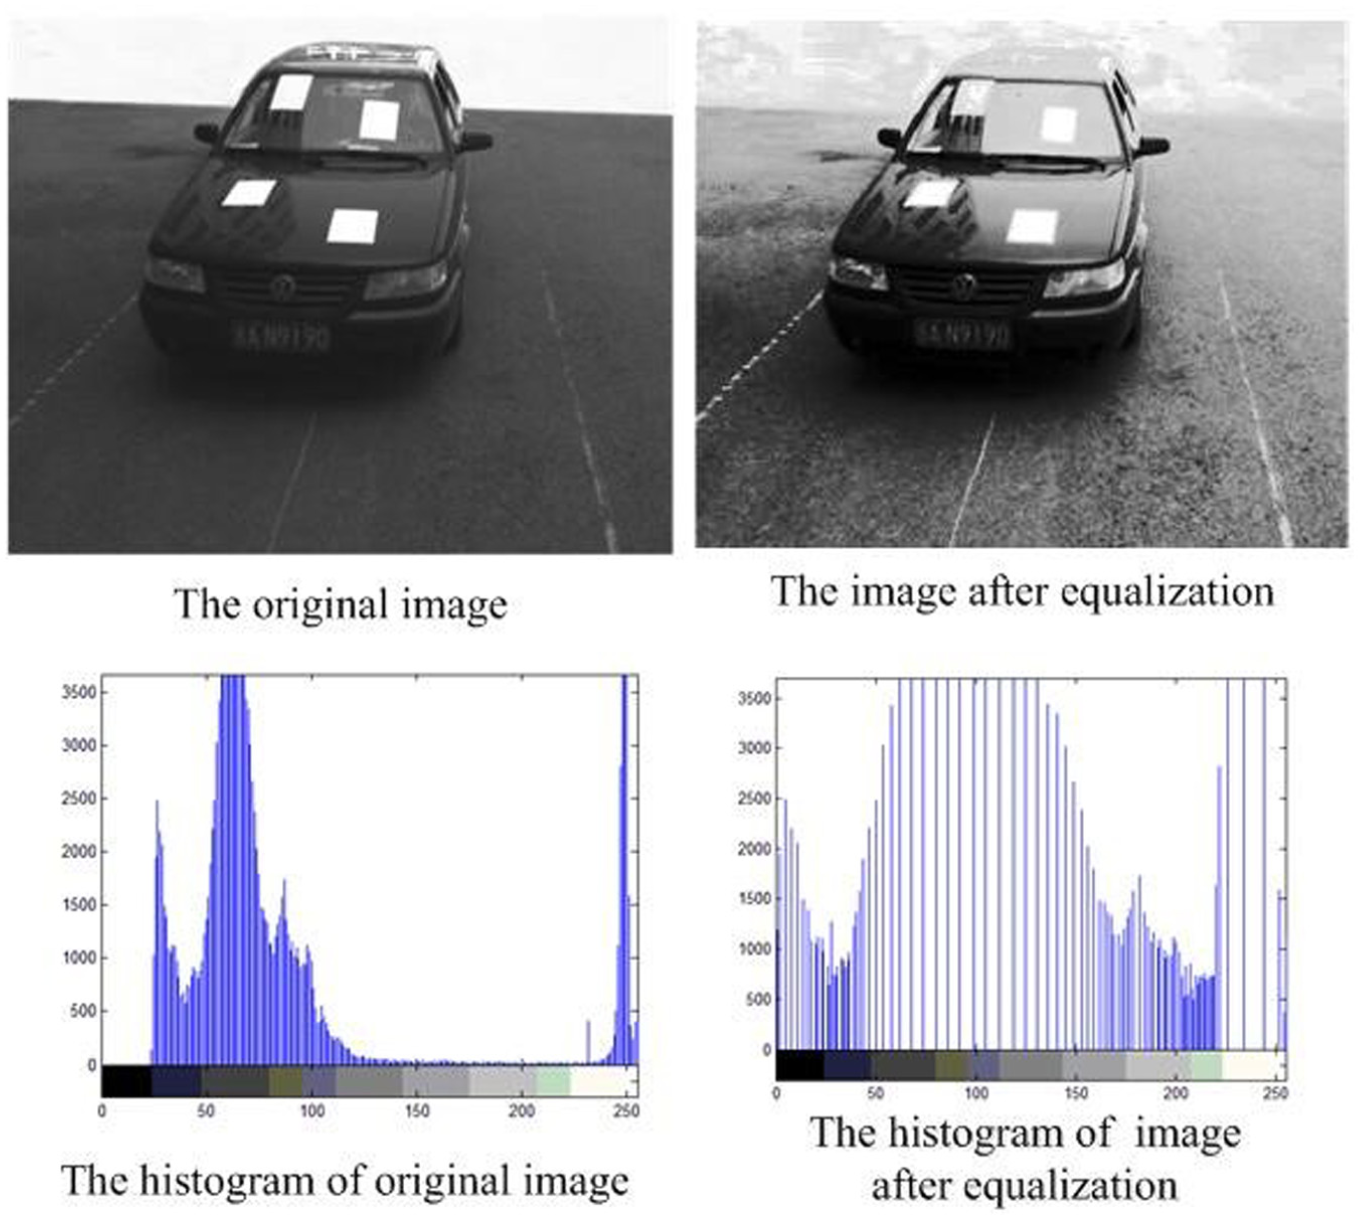
Histogram homogenization process.
Results of image sharpening.
Image feature extraction
After the image of the measured object is enhanced, feature extraction is carried out. The steps of the corresponding algorithm are as follows:
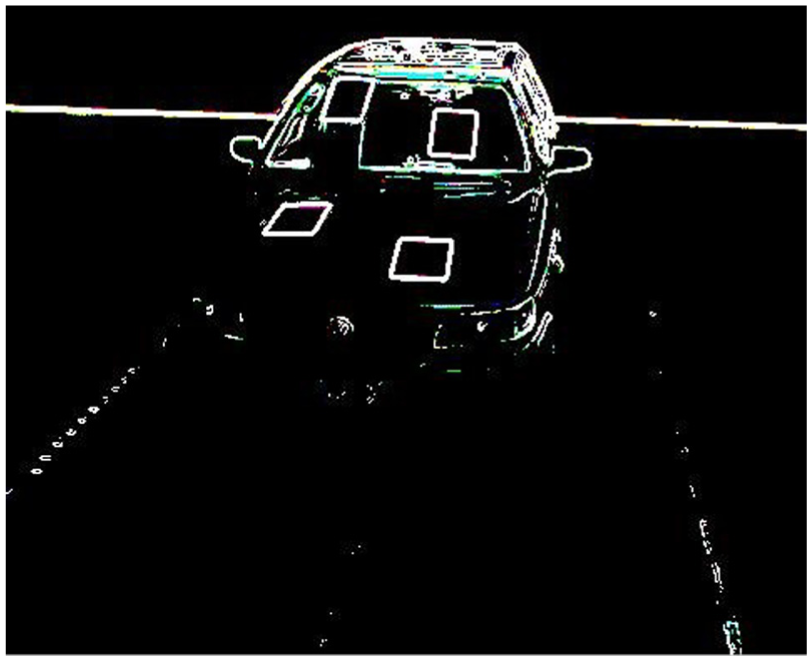
1. Remove the image background, and then detect the image edges. The background subtraction method is used to remove the background of the vehicle’s image containing the markers. Then, the image enhancement algorithm mentioned above is used to remove the image noise and the improved Canny’s 35 edge detection method is used for edge detection. Candy edge detection algorithm adopts the double threshold detection method based on gradient amplitude. The method can suppress noise, but it is also easy to damage parts of low-strength edges. In view of this problem, the improved Canny’s edge detection algorithm adopts the new method based on gradient direction instead of the traditional double threshold method. This method makes full use of the difference between the edge points and noise points in the gradient direction characteristics. The low-intensity edge detail is effectively protected while suppressing noise.
The experiment selects the sharpened image and uses the edge detection algorithm to extract the edge. After repeated operations, the shapes of clearly defined markers were extracted. And the edge detection results are shown in Figure 8.
2. The images of the markers are extracted, and then, their centroid coordinates are calculated. After extracting the edges of the image, the improved Hough transform line extraction method is used to segment the feature area. The implementation of this algorithm is to increase the peak detection and reset processing on the basis of Hough transformation, and at the same time, threshold is set to prevent the generation of false straight line. After the above process, the noise outside the characteristic area is removed, the feature image is obtained, as shown in Figure 9(a), and its binary processing is carried out. Finally, the centroid coordinates of the quadrilateral regions are calculated using the equation for plane centroid calculation. The process of centroid extraction for the feature region is shown in Figure 9(b).
The coordinates of the image’s centroid are

Among them,
3. Assume that, at a certain moment, the centroid coordinates of the four markers were
When the centroid coordinates of the vehicle’s body on one image was obtained, we need to determine the corresponding point of the other image through stereo matching. In this way, the 3D coordinates of the camera coordinate system can be calculated using parallax. So, the next step is to study the stereo matching algorithm.
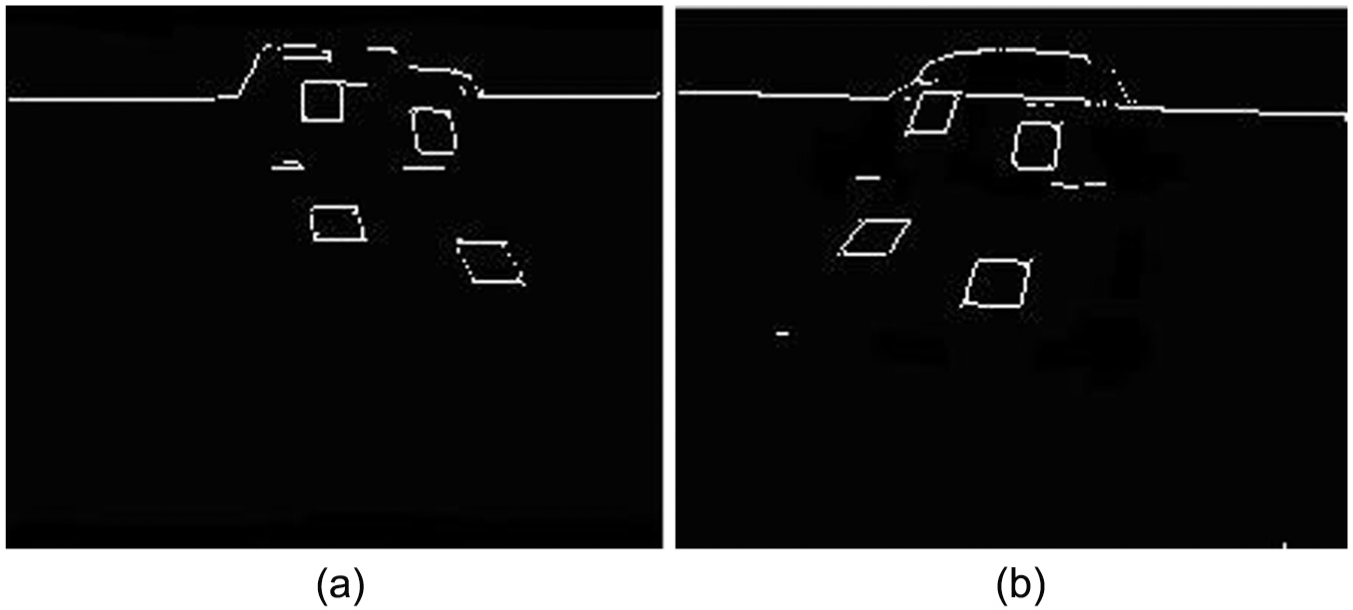
Image edge detection.

Centroid extraction for markers: (a) feature extraction and (b) extraction of centroid.
Stereo matching
The centroid coordinates of the vehicle can be obtained by applying the above process on an image, but the 3D coordinates of the vehicle cannot be obtained using only one image. At least two images of the same object at different angles are needed in order to reconstruct a 3D scene from two-dimensional images. Therefore, the stereo matching algorithm is needed. The nature of stereo matching is to determine the correspondence relationship between images of the same object from different observation angles. In this article, the stereo matching algorithm is used to determine the position of the same points in the images of the left and right cameras.
The key in stereo matching is to narrow the search range and reduce the number of candidate points. A stereo matching algorithm based on disparity gradient is adopted in this article, and the steps of the algorithm are as follows: the left and right cameras are used to capture two images and extract the feature points, and then, the candidate points’ matching relation is established using the epipolar geometry. We start the candidate point matching from the positive direction, and then repeat in the opposite direction; finally, a new relationship of mutual correspondence is obtained. The new matching points are checked according to the constraint conditions, and by means of the disparity smoothness constraint, the false matching is selected and eliminated. Then, the disparity gradient is calculated, judging the correctness of the matching according to whether the disparity gradient satisfies the corresponding constraints. When the feature points are correctly matched, the next step is 3D reconstruction.
3D reconstruction
3D reconstruction refers to the restoration of the object in 3D geometry from two or more two-dimensional images. Let us assume that


In the above equation, the homogeneous coordinates of points


According to the geometry, equations (9) and (10) are two sets of spatial linear equations obtained through the simultaneous plane equations and are solved using the least-squares method to obtain spatial coordinates
Real vehicle tests
In order to test the reliability and accuracy of this system, commercial car models were used for the real vehicle test. To determine the performance of this method vis-à-vis other commonly applied methods, the results of the measurement system proposed in this article are compared with the test results of the portable brake tester. Vehicle braking deceleration, braking distance, mean fully developed deceleration (MFDD), and braking coordination time are the parameters examined in this comparative analysis. The visual detection system and the experimental process and results are introduced in the following section.
Experimental setup of braking performance measurement system
The braking performance measurement system based on stereo vision is composed of cameras of the same type and model, an industrial control computer, a portal frame, and a millimeter wave radar, as shown in Figure 10.

Schematic diagram of braking performance measurement system based on stereo vision.
Data acquisition was conducted as follows: a driver drives the car according to the required speed conditions, whereas the speed and position of the car while on the monitored area are measured by the millimeter wave radar. Then, the millimeter wave radar sends a signal to the computer to control the camera and start recording the image. Meanwhile, an alarm sends an emergency braking signal to the driver to brake the car. The cameras continue recording until the car stops fully. All the data are processed by the system’s software and after a series of process include image processing, calculation, and summary, and the braking trajectory curve is output on the display. The final evaluation results are displayed after all the tests are finished.
Experiments and result analysis
Multi-group testing toward the same vehicle
For comparative tests, the portable braking tester is installed in the vehicle and the instrument debugging is done before the testing. When the testing started, the driver started to brake when the emergency brake signal was received. At the same time, stereo vision detection system acquires the images of braking process. The initial conditions of the test are presented in Table 2.
Initial conditions of the test.

The images of the braking process were processed using the image processing algorithms presented above, and then, the centroid coordinates were extracted. Finally, the 3D coordinates of the vehicle were obtained through 3D reconstruction. After all the images were processed using the same method, a series of coordinates were obtained. The longitudinal displacement of each point relative to the starting point of braking is the complete braking distance, while the lateral displacement is the lateral path offset. The results of the experiment are shown in Table 3.
Results of the visual detection method.

In order to analyse the braking trajectory of the vehicle, curve fitting was used to analyze the data and obtain a smooth curve. After comparison of commonly used data-fitting techniques, the least-squares method was chosen for fitting a smooth curve, as it met the requirements of the test.
The experimental data of Table 3 were linearly quadratic and cubic-fitted using MATLAB 7.0 and the corresponding fitting curves are shown in Figure 11.

Curve fitting of the braking trajectory.
Analysis of the actual braking process and the comparison of the three fitting methods’ variance show that quadratic fitting is the most consistent with the physical phenomenon. Therefore, the experimental data were quadratic-fitted using the least-squares method. Finally, the results of the visual detection method are presented in this article. At the same time, the test results of the portable brake tester are read, and the braking performance parameters of the Jetta are shown in Table 4. The road adhesion coefficient was set to φ = 0.75 36 according to the actual conditions.
Braking performance parameter table of Jetta.

The two groups of test results and the actual conditions were compared, and it can be seen that the visual detection method can measure the initial speed accurately, while the display of the portable brake tester was less than the actual value. The lateral path offset of the vehicle can be measured directly by the visual detection method, and the measured values are within the specifications of national standards. Experimental results show that the theory proposed in this article is correct, and that the system can measure the braking parameters accurately.
In order to test the repeatability of the method, the test vehicle was tested for five times, each with an initial velocity of 50 km/h, under the same conditions. The braking trajectory of the test vehicle was obtained using to the tire marks on the ground, as shown in Figure 12, while the detection results are shown in Table 5.
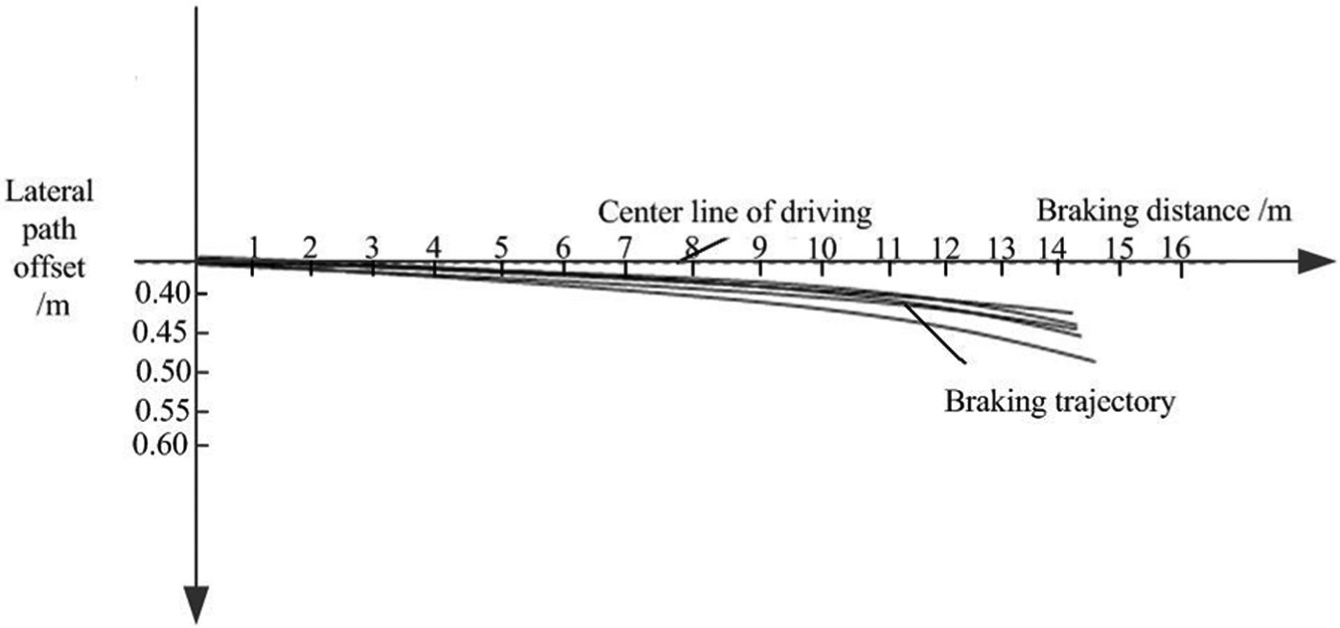
Braking trajectory of test vehicle.
Braking performance measurement results of Jetta.

A comparison of Figures 11 and 12 shows that the curve of the braking trajectory obtained by the visual detection method is very close to the actual braking mark of the car. The consistency of results under several experiments shows that this method has good repeatability and can therefore reflect real braking conditions accurately.
For a further analysis of the measurement accuracy of the system, the initial speed before braking and the lateral path offset were tested as an example. We used actual speed as a benchmark when evaluating the accuracy of initial speed and the tire mark measured by a meter ruler as the benchmark when evaluating the accuracy of lateral path offset of the vehicle. The test data are shown in Table 6. In the table, the visual detection method proposed in this article is denoted as VM, while the manual measurement method is denoted as MM.
Accuracy evaluation of experimental results.

The data in Table 5 show that for the measurement of the initial braking speed, the maximum absolute error of the VM method was 0.4 km/h and the maximum relative error was 1.4%. The error is small, which indicates that visual method can determine initial braking speed accurately. For the measurement of the lateral path offset, the maximum relative error of the method VM was 2.4%. This shows that the data measured by visual method can reflect the braking stability under different test conditions. In summary, the visual detection system has good measurement accuracy and repeatability.
Braking performance testing of different vehicles
In order to verify the applicability and accuracy of the visual method, five different vehicles are selected to test the braking performance in the same environment. Three different methods were used for the measurement of braking performance in each vehicle. The visual detection method proposed in this article is denoted as VM, the portable brake tester method is recorded as TM, and the manual measurement method is recorded as MM. The test results are shown in Table 7.
Braking parameters’ measurement results of test vehicle.

The measurement results of Table 7 show that the braking distance of the five vehicles is relatively short and the lateral path offset is small, which indicates that the test vehicles had good braking performance. However, according to the test process, it is necessary to install the portable braking performance tester in the experimental vehicle before testing and disassemble the instrument after measurements are completed, so the portable brake performance tester method required a longer time to set up. The visual detection method only needs a calibration of the system when the initial test is carried out. During the process of vehicle braking, cameras collect images constantly. At the end of the braking, a series of process including image processing, calculation, and summary are performed, and the changes in brake trajectory curve over time are displayed on the software interface. Thus, the method proposed in this article has high accuracy, good repeatability, and fast detection speed. It was easy to use and suitable for measurements conducted on different vehicles.
Conclusion
Considering the state-of-the-art in vehicle braking performance testing technology, this article proposes a new measurement method which uses a vision system for the measurement of vehicle braking performance. First, the principles of binocular stereo vision and the measurement of vehicle braking performance using vision technology are introduced. Then, the camera calibration, image edge detection, feature extraction, stereo matching, and 3D reconstruction algorithms are presented. Finally, a vehicle braking performance measurement system based on stereo vision is established and real car test results are documented. The comparison between the proposed visual detection method and the portable braking performance tester shows that the visual detection method can measure the initial speed of the vehicle accurately and the lateral path offset can be measured directly. This confirms the theoretical approach presented in the article, and that the visual detection method can reflect the real dynamic process of vehicle braking. Repeated tests were carried out and on different car models, and the experimental results show that the detection system has good accuracy and repeatability. The measurement efficiency of the system is high, while it is suitable for the vast majority of commercially available car models and can meet the requirements of the test line.
Footnotes
Handling Editor: Seung-Bok Choi
Declaration of conflicting interests
The author(s) declared no potential conflicts of interest with respect to the research, authorship, and/or publication of this article.
Funding
The author(s) disclosed receipt of the following financial support for the research, authorship, and/or publication of this article: This research was funded by the Science and Technology Development Project of Jilin Province (no. 20150204025GX).