
Abstract
This article presents an approach to investigate the variation propagation of machine tools due to the geometric errors produced in assembly process and determine a pre-adjustment method in assembly design stage. At the beginning, a state-space model was used to describe the variation propagation in machine tool assembly process. Subsequently, a finite element analysis consistent with a selected assembly sequence was conducted, including the components in their unassembled state which is always ignored in the existing study. A horizontal machine center was taken as an example to clarify the proposed method. The guide rail deformations in normal direction were defined to obtain the joint kinematic errors in each assembly station. Based on this, an analysis calculation is formulated to determine the total deviation in assembly and then the adjustment before assembling was identified to reduce the assembly errors. The method has strong feasibility and practicality, and when this method is adopted, the static deformation error produced in assembly process would be decreased obviously and can effectively improve the precision of machine tools assembly. The proposed method was eventually applied to the assembly of a horizontal machine center, and the final evaluation of accuracy in our experiments can meet the requirements well.
Keywords
Introduction
The rapid development of the manufacturing industry has accelerated the ever-increasing demands for high precision and reliable machine centers. 1 Geometric accuracy is one of the basic and key performance factors for precision machine tools. 2 The principal sources of errors affecting the machine accuracy are classified as geometric and kinematic errors caused by thermal distortions, stiffness errors related to the cutting forces, and other sources.3–5 Among all the error sources, geometric and kinematic errors have the highest influence on the machining quality because they impart a direct effect on the relative position between the cutting tool and work piece. 6 Accordingly, it is crucially important to reduce the errors to improve the machining accuracy along with the structural improvement of the machine tool via a better design, manufacturing, and assembly process plan. During the assembly, the geometric errors accumulate and propagate in a step-by-step assembly process, the deviation of each component would produce and change; thus, the final accuracy and efficiency of the machine tools would be affected. As a consequence, the variation propagation in the assembly process should be modeled to predict the final errors and the adjustment of the components should be determined before being assembled to improve the final machine accuracy.
Mechanical assembly can be classified into two types: 7 Type-1 is called “part-defined assemblies” because the accuracy of positioning of the machined or modeled parts entirely depends on their respective manufacturing techniques, such as the assembly of precision instruments. The Type-2 assembly mainly includes compliant parts such as aircraft and automobile body, where the position accuracy is crucially defined by the fixtures rather than the mating features. For decades, many researchers have conducted a considerable amount of studies specializing in Type-2 assemblies. State-space model has widely been applied to control the dimension and variation propagation of sheet metal assembly process.8,9 Liu et al. 10 proceeded to develop a common state-space method to modeling three-dimensional (3D) variation propagation in multistage assembly process (MAP). However, the assembly of machine tools is quite different from the compliant components whose variation accumulation mainly depends on the fixtures at each assembly stage. 11 For precision machine tools assembly, the accuracy is not assured by the locating parts but depends on the key product characteristics (KPCs) of the modules. Thus, it is critical to model complex variation propagation of machine tools assembly and make compensable adjustment in the design stage. In this area, Koga and Aoyama 12 proposed a representation model in an assembly process which can be used in a design system.
For precision machine tools, the product quality depends both on the tolerance allocation and the insurance of the assembly process planning. The tolerance allocation could guarantee the machining error of a single part while the assembly technique controls the variation accumulation in the assembly process. 13 Nevertheless, the assembly process planning primarily depends on the practical experiences of the workers. Therefore, there is a significant requirement to develop a mathematical model to predict and suppress the variation propagation in the assembly process of machine tools. In machine tools assembly, the incoming error primarily includes the manufacturing error of parts and the errors induced by gravity impact. An integration of tolerance allocation of components and variation propagation in the assembly process based on state-space model was further studied. 14 Guo et al. 15 put forward a novel method toward the measurement process designing for machine tools assembly based on the Kalman filter. Sun et al. 16 proposed a pre-deformation method to improve the precision and performance of the machine center assembly. Lu and Wang 17 considered the effect of joint surface in evaluating the assembly accuracy in different assembly sequences. However, there is a phenomenon in practice where the component lies in a different orientation compared to the operation position that could not be ignored. Moreover, it would produce an inverse deformation before being assembled. It is not accurate to consider only the final assembly station in calculating the total errors. Researchers have not investigated this matter yet in considerably recent studies.
In this study, the assembly accuracy considering the deformations of guide rails caused by gravity in each assembly station was analyzed. The variation propagation in the assembly process using state-space model is introduced in section “Modeling of machine tool assembly process.” Section “Finite element modeling of a horizontal machining center” proposes the finite element method (FEM) model in detail based on a flow chain of selected assembly sequences and considers the moving parts located in different positions as well. The static deformation of the machine tools derived from FEM results is discussed section “Pre-deformation of the machine centers.” Besides, the total errors that integrated the first and the final assembly stations were calculated, and the adjustment amounts to satisfy the final constraint before being assembled were obtained. An experiment was conducted to validate the availability of the variation propagation model and the FEM method in the final section.
Modeling of machine tool assembly process
Of all factors affecting the geometric accuracy, the guide errors play a particularly important role because they directly affect the relative position between the tool and work piece. There are two components in guide errors: the geometric errors and the joint kinematic errors produced in the step-by-step machine tool assembly process. 18 In this discussion of geometric accuracy assurance for machine tool assembly, only the joint kinematic errors were considered.
The joint kinematic errors (three translations and three rotations) are commonly defined by the machined surfaces that support the motion systems. These surfaces where the motion component is mounted are defined as the KPCs in assembly model. A coordinate system is built in each KPC. So, each KPC could be expressed by coordinates to demonstrate the position and orientation relative to another KPC. The KPCs and their coordinate systems construct a coordinate systems transformation chain. It is named as datum flow chain (DFC), 14 which illustrates the connection relationship and variation propagation direction of the machine tool assembly. Figure 1 illustrates the structure of the machine tool. All the KPCs are represented with red lines.

Structure of the machine center and key characteristics.
It is important to establish the variation propagation model of precision machine tool to identify variations corresponding to the assembly process. State-space model is generally used in modeling the MAP. The horizontal machining center is considered as an example to illustrate the variation propagation in assembly process

where
where

Therefore, the general form of
The

where

where

Equation (6) could be rewritten as
Equation (7) represents the total accumulated variation after
Hence, from the above discussion,

where

Moreover, in this study,
Finite element modeling of a horizontal machining center
A horizontal machine center shown in Figure 1 is considered as an example. It is exceedingly difficult to obtain accurate analytical solutions of the geometric deformation and error accumulation in the assembly process. Therefore, FEA method could be used to simulate the numerical analysis to approximate the analytical solutions.
As Figure 1 demonstrates, the KPCs that affect the variation propagation in the assembly process include the bed, column, saddle, spindle box, and worktable. Nearly all of them are large castings that contain a large number of bolt holes, fillets, chamfers, and little grooves. It would inevitably increase the difficulty of meshing and calculation if all the structures are modeled. Moreover, they hardly affected the analysis results; thus, the solid model of machine center was built with small structures were simplified. The geometric modeling and solution of the FEM were performed by Creo 2.0 and Abaqus 6.11.
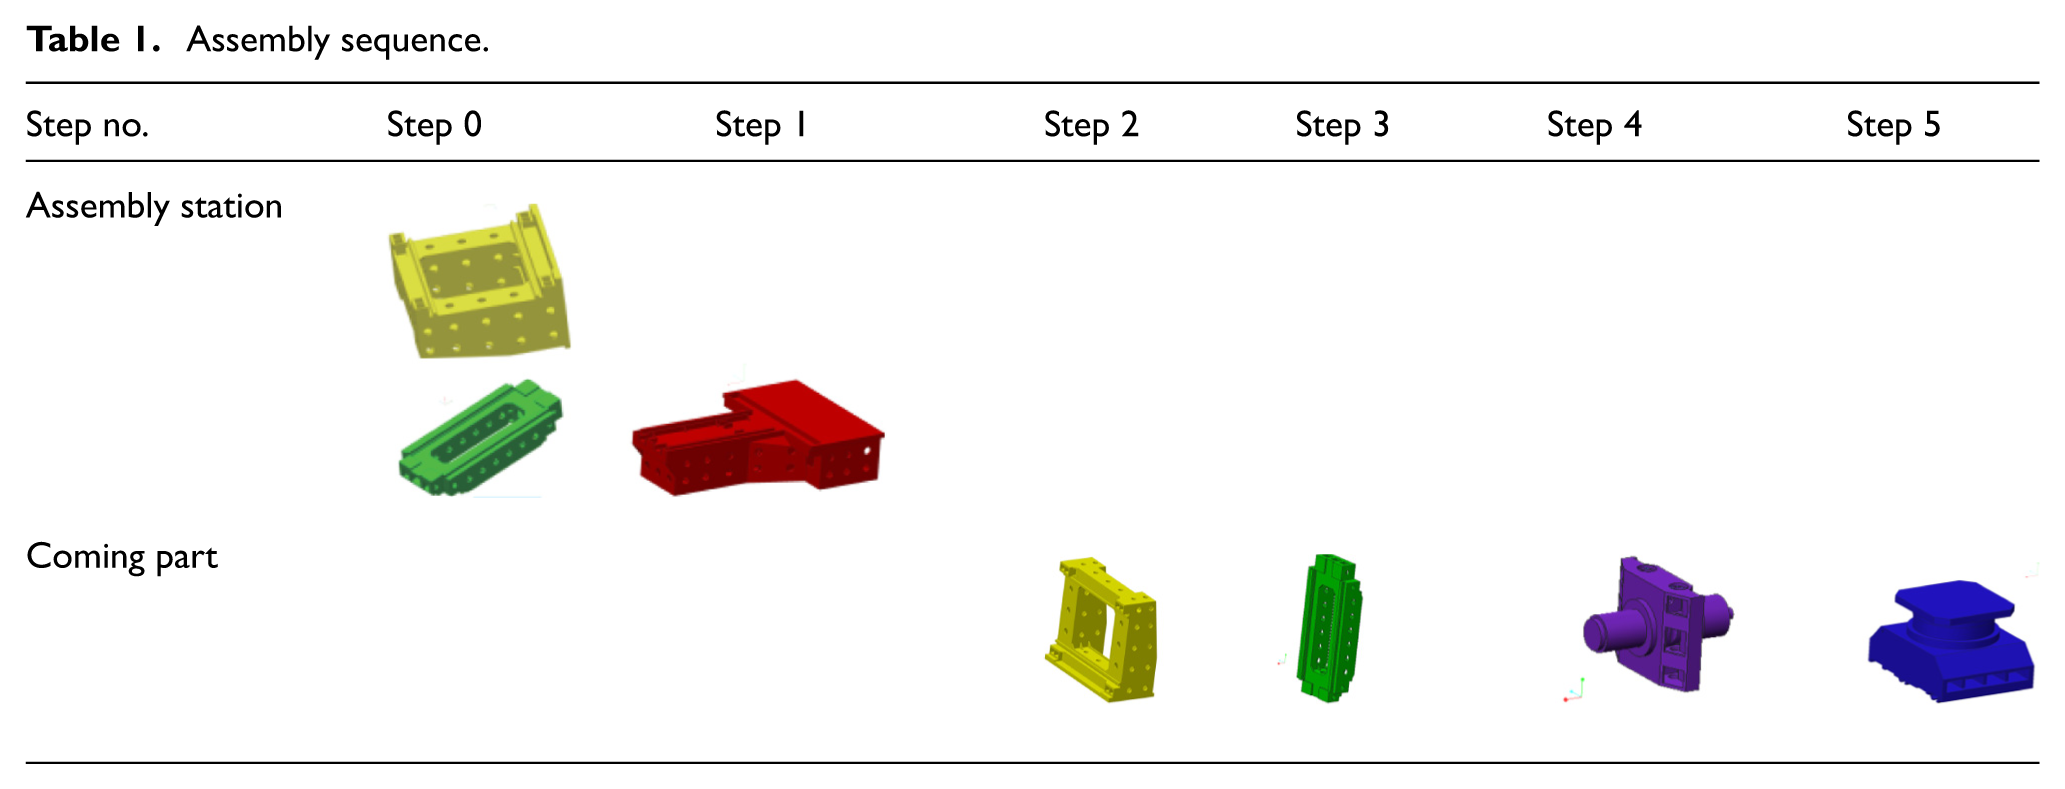
Assembly sequence of horizontal machine center
In the machine tool assembly process, adjustment process is conducted by scrapping or re-machining to control the variation accumulation. The adjustment value depends on the estimation of propagated variation. Furthermore, in each assembly step, an incoming part is assembled to the preceding assembly that generates geometric deviation accumulation in the sustaining ones. Therefore, an assembly sequence should be designed to obtain the gravity impact from one part to the other as shown in Table 1.
Assembly sequence.
Equivalents of joint surfaces in the machine center
Since the joint surfaces between the assembly parts impart a significant influence on the machine performance. Thus, considering the characteristics of joint surfaces and modeling the equivalents is required prior to the FEA analysis.
There are two kinds of joint surfaces of machine tools: fixed joint and kinematic joint. In the horizontal machine center, the bed and column are bolted together while the guide and slide are connected through rollers. In our analysis, the adjacent parts were directly connected using a series of spring elements.21–24 The equivalent form of the fixed joint surface is shown in Figure 2(a). The sketch of the interactions between contact phenomena in the area of the guide rail–roller–slide is shown in Figure 2(b). For simplification, the number of the spring elements was considered to be less than the true bolts or the rollers, but the spring elements had an overall contact stiffness equivalent to that of the original mode. This two-point contact mode could significantly increase the efficiency of pre-processing of the analysis model, without affecting the accuracy of the final results. The parameters of the guide way and slider largely depends on the data prescribed by their manufacturers. On this machine, INA-RUE65-EL roller guide ways were used. So, the stiffness was calculated according to the brochure supplied by Schaeffler Technologies AG & Co. KG. 25 And, the column-bed joint total stiffness is usually between 1E10 and 1E11 N/mm. The stiffness values used in this article are recorded in Table 2.
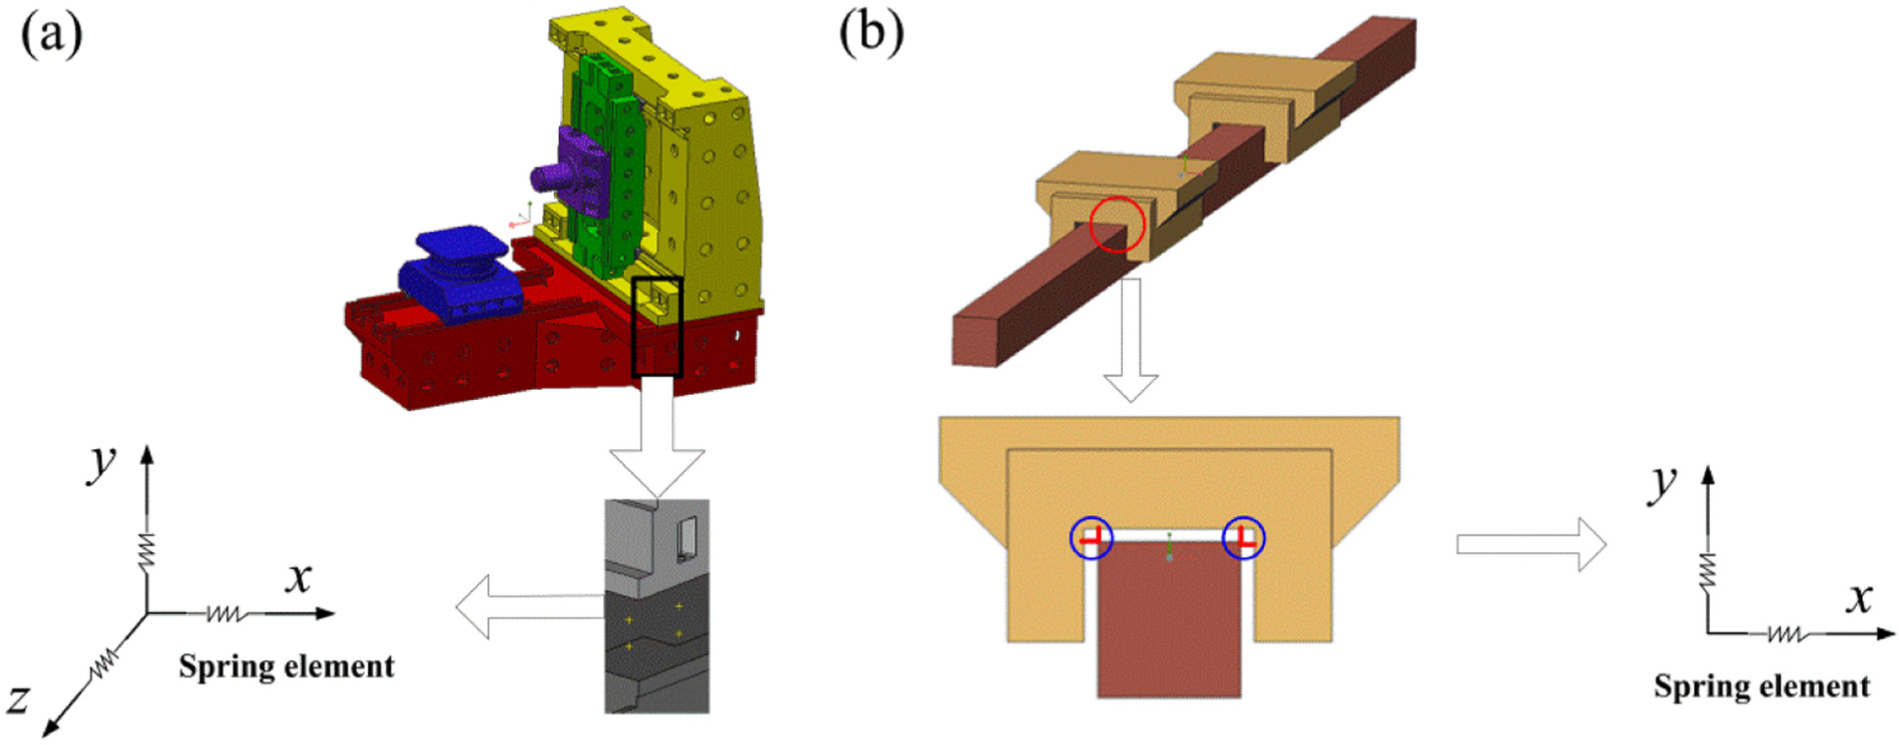
Equivalent schematic diagram of joint surface: (a) fixed joint surface and (b) kinematic joint surface.
Parameters of equivalent joints.

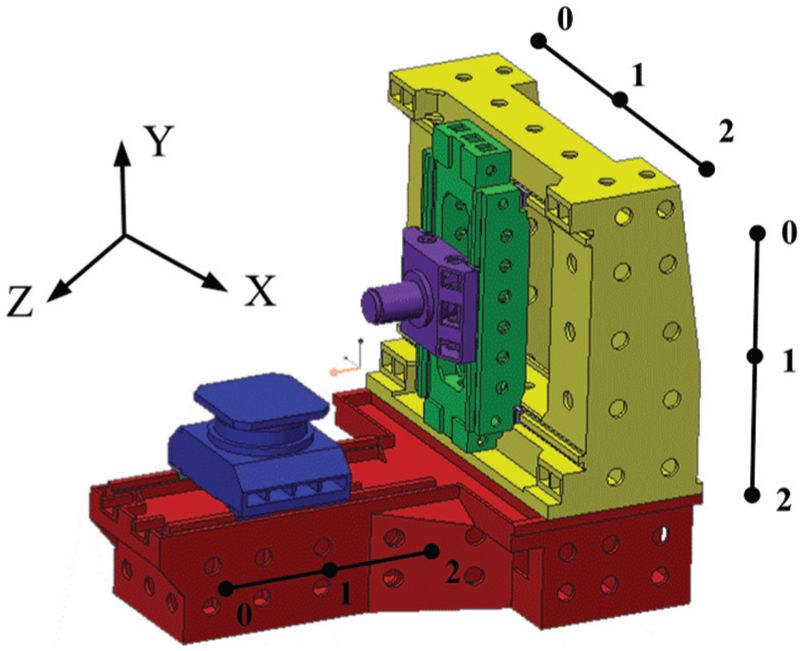
Definition of analysis position of X-, Y-, Z-axes
The deformation of the motion guide rails changes with the relative position of the moving parts. Thus, the static simulation of the machine center should consider the different positions of the spindle, saddle, and worktable. According to the structure of the machine center, three positions in each axis were defined in this model. The travels of X-, Y- and Z-axes in this machine center are 1050, 800, 1260, respectively. The three positions of each axis are defined in Figure 3. For each axis, the center position denoted as No. 1 is considered and then a position along the guides on both sides denoted as No. 0 and No. 2 are depicted. The position coordinates and numbers are defined in Table 3 specifically.
Different positions of the moving parts.
Position coordinate

Meshing models and the boundary conditions
The analytical solution could be satisfactorily approximated via numerical solution if the machine center structure is reasonably simplified and finely meshed. Considering the complexity of the structures of the machine center and the calculation ability of Abaqus, auto-meshing process was applied in this model. To improve the accuracy of the simulation results, the regions we were considerably concerned about were fine meshed. The tetrahedron element with different sizes on different parts was used to mesh the solid structure, an example is shown in Figure 4.

Mesh model of the machine center for FEM static analysis.
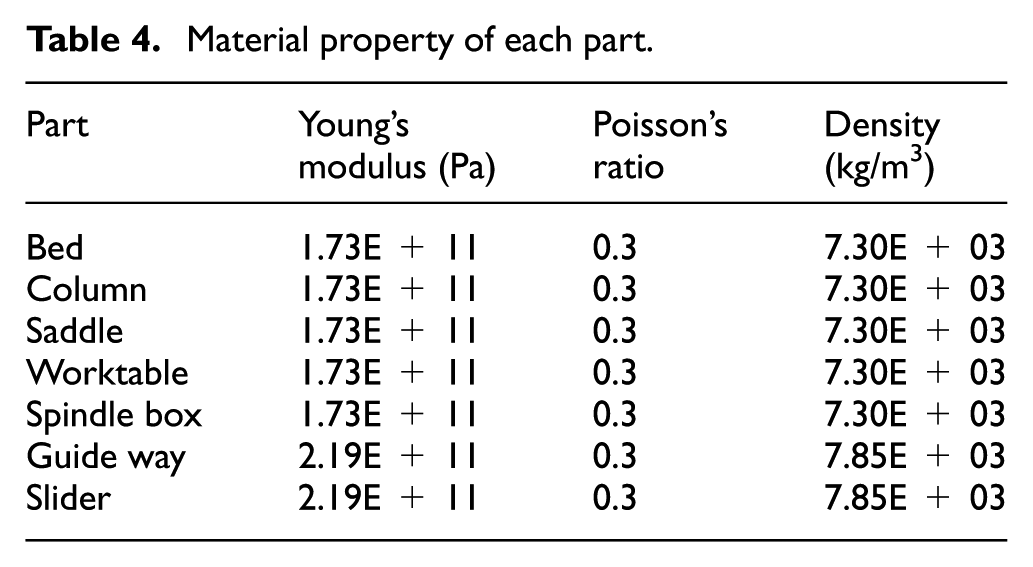
Besides, the credibility of the simulation results also depends on whether the contact relationship and boundary conditions are well defined. In practice, the machine center is fixed in the form of three-point support, with anchor bolt fixed onto the base. Thus, in FEA pre-processing, a full-degree-of-freedom constraint was applied on the three support surfaces of the bed. Only the gravity impact is considered in this study, thus the gravity along Y (acceleration, −9800 mm/s2) is applied on the whole model. Young’s modulus and Poisson’s ratio of each part are given in Table 4.
Material property of each part.
FEA results
To reduce the effects of gravity impact on the final assembly accuracy and to identify the specific straightness error in each assembly station, the adjustment should be determined based on the variation propagation and accumulation. Besides, the calculated deformation should be along the sensitivity direction. The effects of moving parts on the guide deformation are summarized, and the overall variation accumulation in the assembly process is analyzed in the following section.
The deformations of guide rails change with the relative positions of the moving parts and supporting components. For X-axis guide rails, they are mounted on the column and primarily support the saddle and the spindle. Figure 5 illustrates the deformation difference in the Z-direction caused by gravity with different positions of the saddle and spindle box in the assembly station Step 4. The upper lines represent the upper guide deformation (solid lines) and the lower lines represent the lower guide (dashed lines).
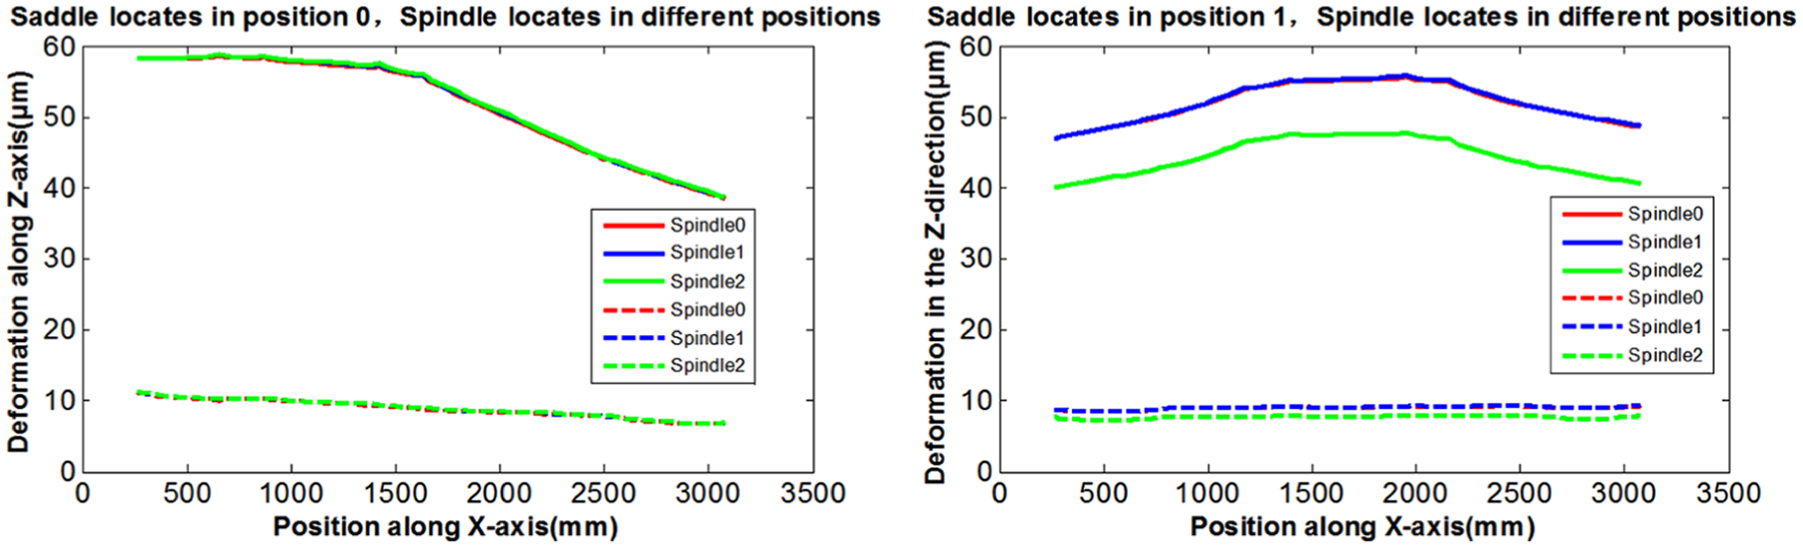
Deformation of X-axis guide rails with different positions of the saddle and spindle box.
The column advances forward under gravity, so the deformation of the upper guide is appreciably substantial than that of the lower guide. As observed above, the position of the saddle plays an important role in determining the deformation change of X-axis guide rails. The maximum deviation occurs in the same position where the saddle locates. In Step 4, the guides have the same characteristics as when the spindle lies in different positions except that there is a decrease of 8 µm in the upper guide when the saddle locates in position 1 and the spindle locates in position 2. It is consistent with the fact that the stiffness in the middle of the column is less than in other positions.
As Y-axis guides are mounted on the saddle and support the spindle, the position of the saddle hardly imparts any effect on the deformation change. Besides, the left guide and the right guide possess the same deformation characteristics. Thus, only the left guide deformation of Y-axis in the Z-direction considering the spindle locates in different positions in assembly station Step 4 was extracted as shown in Figure 6(a).

Deformation with different positions of the moving parts: (a) effect of the spindle on Y-axis in Step 4 and (b) effect of the worktable on Z-axis in Step 5.
The deformation of the left guide of Y-axis changes minimally when the spindle moves along the guide rails. The difference between them could be ignored. After the spindle is assembled, the gravity of the spindle produces a moment to the guide, the guide along with the column proceed forward, thus the deformation is considerably larger in Step 4 than in Step 3.
Z-axis guides are mounted on the bed and support the worktable, where the position of the worktable imparts significant influence on the deformation change while the position of the saddle and the spindle have minimal effect that could be ignored. Besides, the left guide and the right guide possess the same deformation characteristics. Thus, the single left guide deformation of Z-axis in the Y-direction considering the worktable locates in different positions in assembly station Step 5 was analyzed as shown in Figure 6(b). It could be observed that the deformation changes considerably as the worktable moves along the guide. To obtain an overall deformation caused by the working table, the least-square fitting method was used to acquire a total deformation curve illustrated in the following section.
Pre-deformation of the machine centers
The straightness error
In practice, X-axis and Y-axis guide rails are first mounted on the column and the saddle, respectively, which is denoted as Step 0. Moreover, in this assembly station, the column and the saddle lie in XZ plane, while in other assembly stations, they lie in XY plane. Furthermore, the Z-axis guide rails are mounted on the bed and they maintain a similar orientation in the assembly process. Thus, to define the pre-deformation value, we should determine the variation between the first and the final assembly stations. In this example, all the guide rails are considered to have the deformation in the normal direction only for simplification.
As illustrated in Figure 7(a) the deformation under Step 0 and Step 5 of the upper X-axis guide rail is contrasted. In Step 0, the deformation is represented as a convex shape; on the contrary, the deformation is represented as a concave shape in Step 5. The straightness values EX are 16.3 and 3.14 µm, respectively.
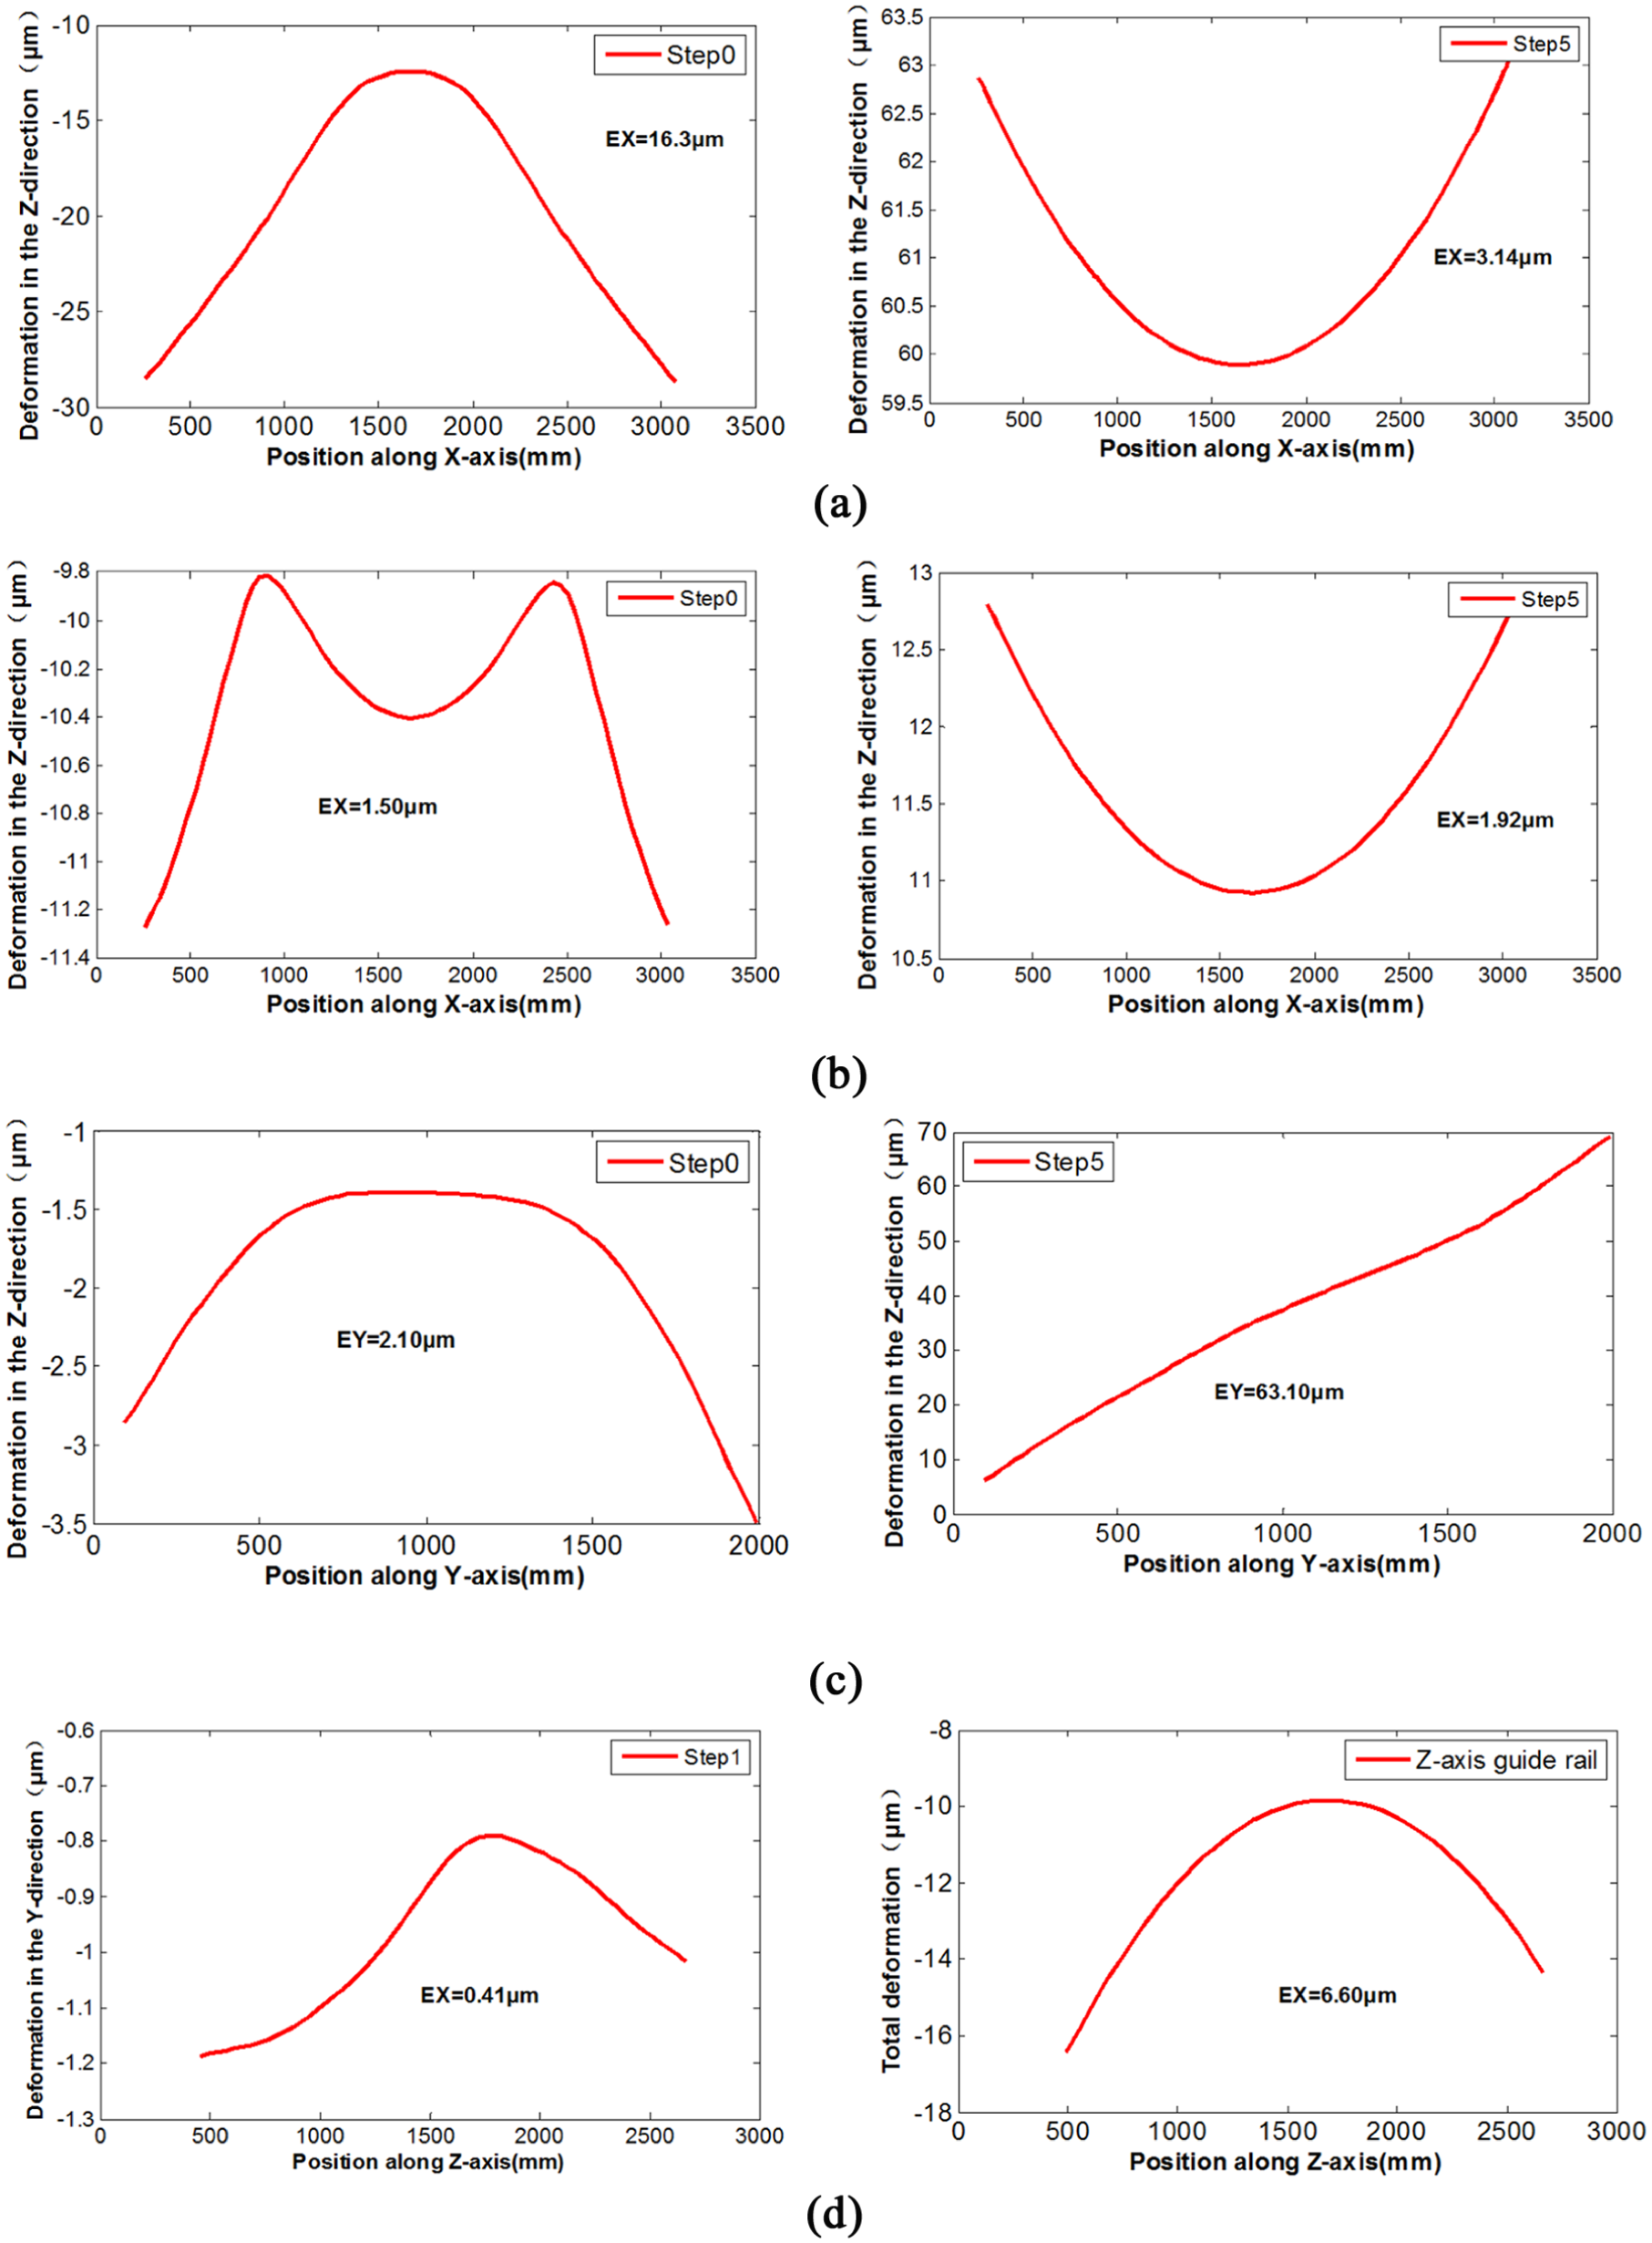
Straightness deviation of the initial and the final states of three axes: (a) upper X-axis guide rail in Z-direction, (b) lower X-axis guide rail in Z-direction, (c) Y-axis guide rail in Z-direction, and (d) Z-axis guide rail in Y-direction.
As illustrated in Figure 7(b), the deformation of lower X-axis guide rail under Step 0 and Step 5 is contrasted. The trend is similar as the upper guide rail, but the deformation value is smaller. The straightness values EX are 1.50 and 1.92 µm, respectively.
The left and right guide rails of Y-axis possess the same deformation characteristics. As indicated in Figure 7(c), in Step 0, the deformation is represented as a convex shape and the straightness is 2.10 µm. In Step 5, the straightness is 63.10 µm and is represented as an uphill shape.
Likewise the Y-axis guide rails, the guide rails of Z-axis possess the same deformation characteristics. As illustrated in Figure 7(d), and after all the components are assembled, the deformation increased with the same trends as in Step 0. The straightness is 0.41 and 7.04 µm, respectively.
Pre-deformation of the guide rails
Based on the above analysis, Z-direction to X-axis and Y-axis guide rails, Y-direction to Z-axis guide rails is observed to be the sensitive direction of error. In addition, before the column and the saddle are assembled onto the bed, guide rails mounted on them generate an inverse deformation with respect to the final station that demonstrated compensative effect to certain extent. The total deformation combining the first and final states is shown as Figure 8.

Total deformation.
For example, if the straightness error of the machine center is constrained within 5 µm, we should adopt certain adjustments to the guide rails before being assembled except the X-axis lower guide rail. The adjustment curve in the X-, Y- and Z-axes guide rails are shown in Figure 9. The adjustment of the machine center is set as follows: (1) the total deformation of X-axis guide rail changes to a convex shape in the positive Z-direction, that means it deforms considerably in the middle, so adjustment of 8 m in the middle should be conducted before assembling; (2) the adjustment of Y-axis represents an uphill shape, it attains a maximum straightness of 30 µm at the top; and (3) for Z-axis, adjustment of 0.5 µm should be adopted in the second half of the guide rails.
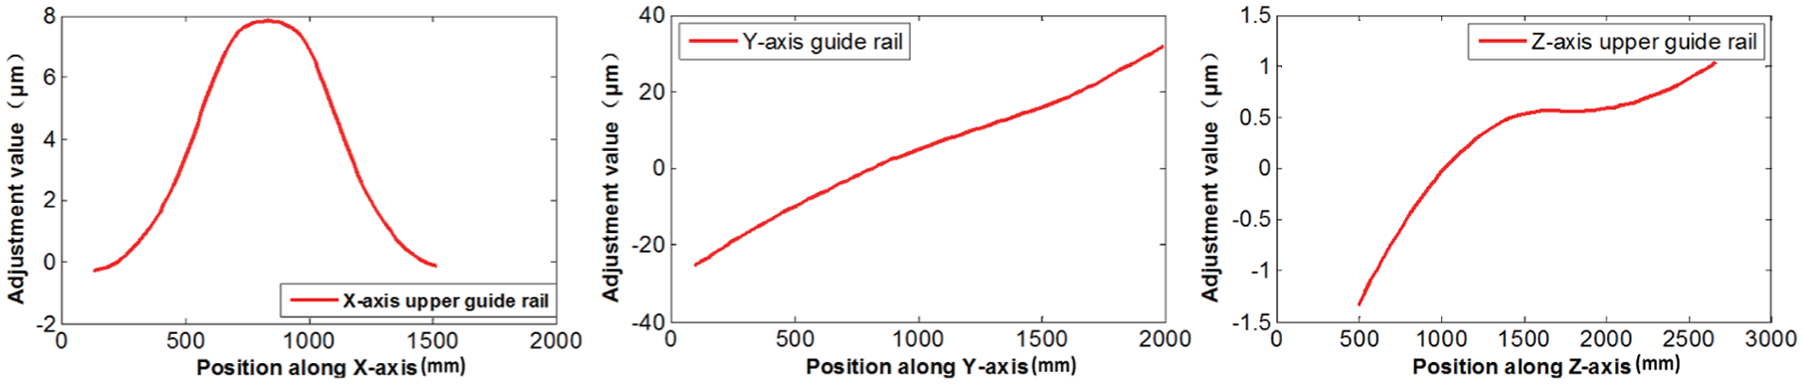
Adjustment value of guide surface in normal direction.
Variance of errors and estimation considering the adjustment in assembly process
The straightness variation accumulation and propagation in the assembly process calculated based on the FEM results without adjustments are illustrated in Figure 10(a), and for the straightness of lower X-axis guide to satisfy the requirement, only the upper guide of X-axis is illustrated here. The straightness error in each assembly station considering the adjustment is shown in Figure 10(b). Comparing the results, it could be observed that the straightness errors are all reduced within 5 µm in the final assembly station.
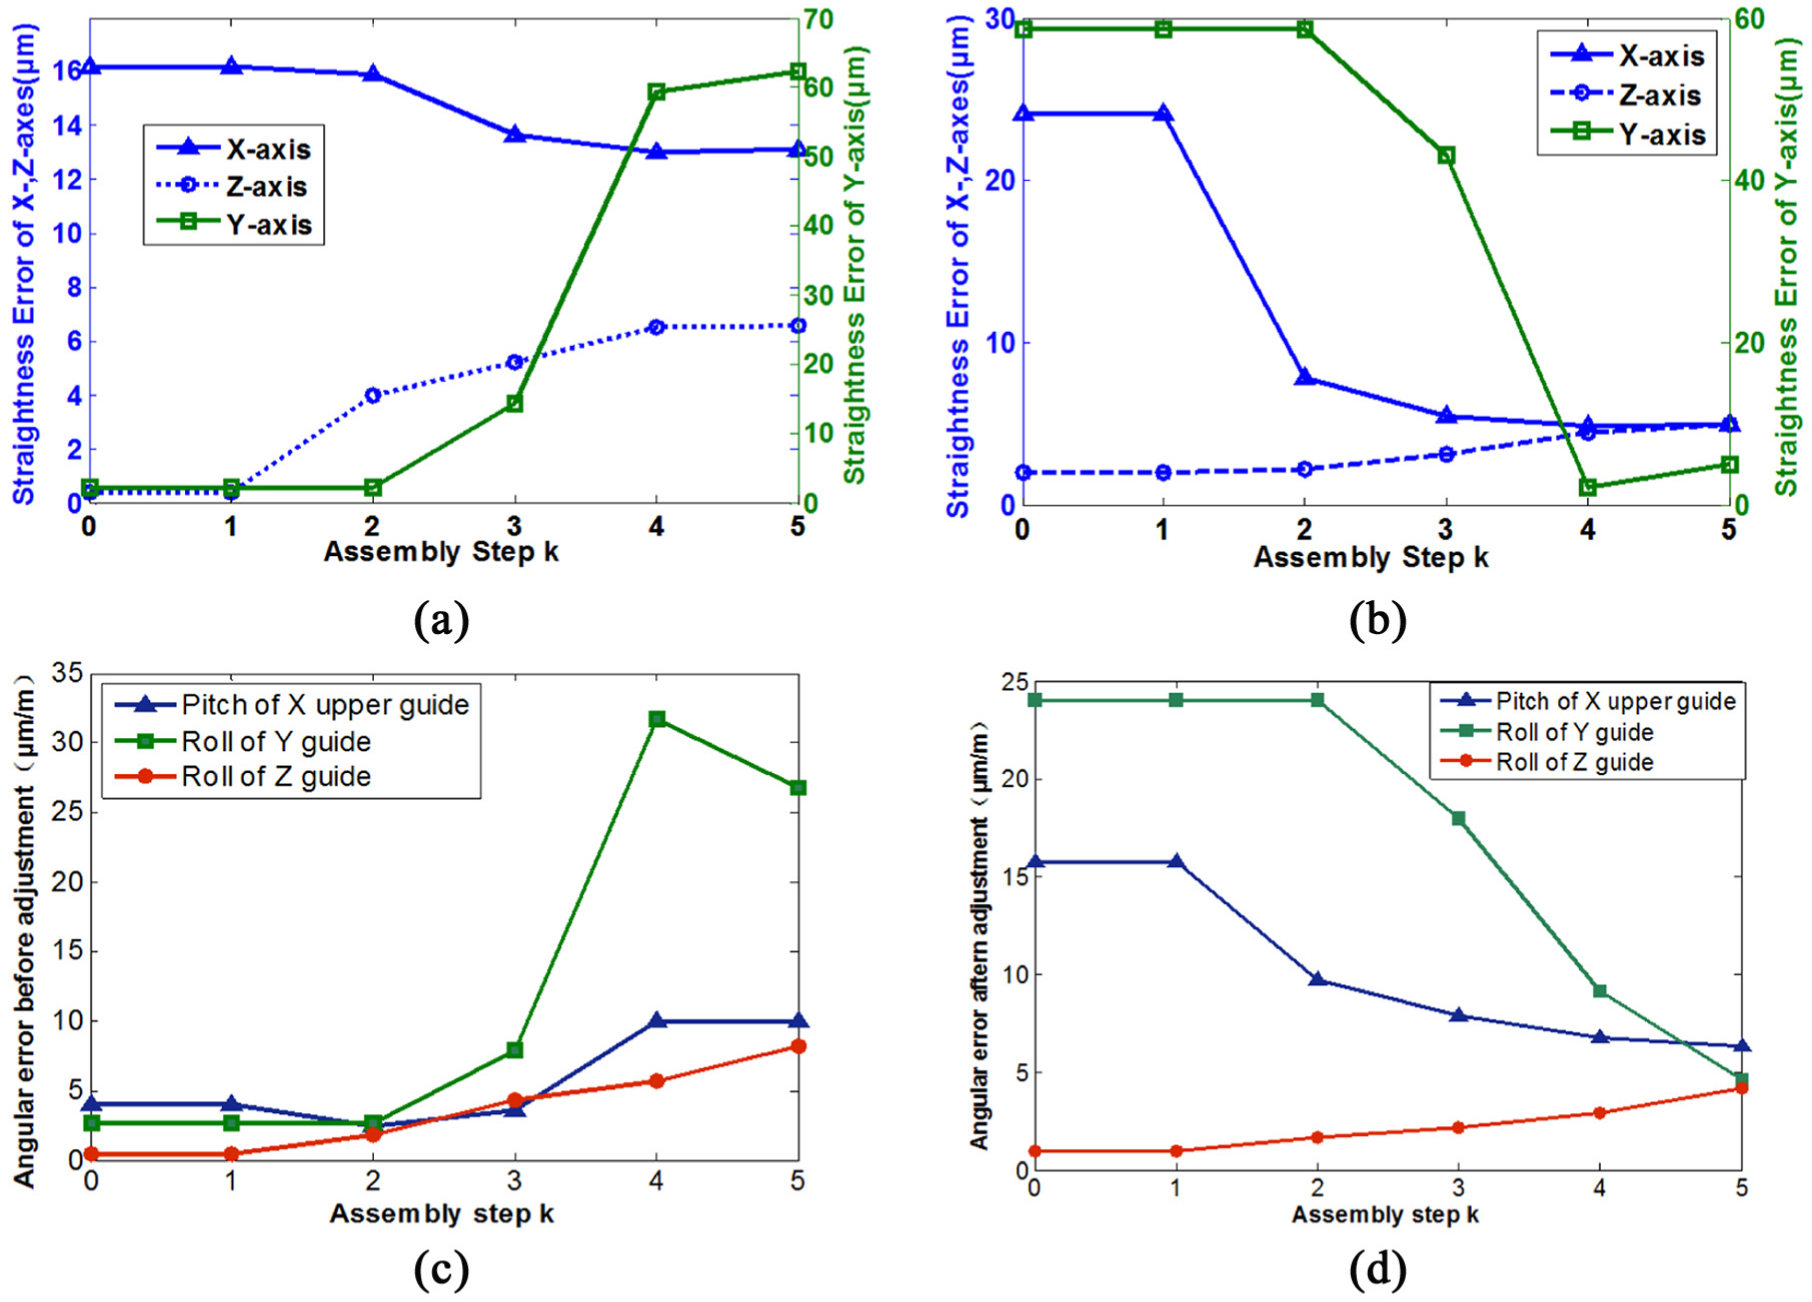
Variance of straightness and angular error in assembly process: (a) straightness error without adjustment, (b) straightness error considers adjustment, (c) angular error without adjustment, and (d) angular error considers adjustment.
All the calculated surfaces in the machine tool structure should be parallel or perpendicular to each other. From previous statement, we could comprehend that both linear and angular errors influence the final position error, but only angular errors affect the final angular error. Thus, the pitch error of X-axis, roll error of Y-axis and Z-axis would be discussed subsequently. According to the description in section “Modeling of machine tool assembly process,” the state-space equation of the sensitive direction can be demonstrated as
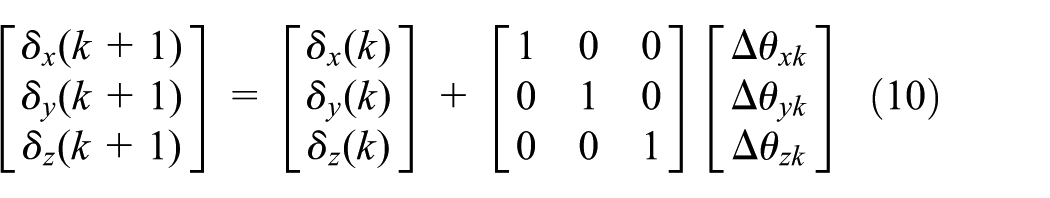
The final angular error state could be expressed as

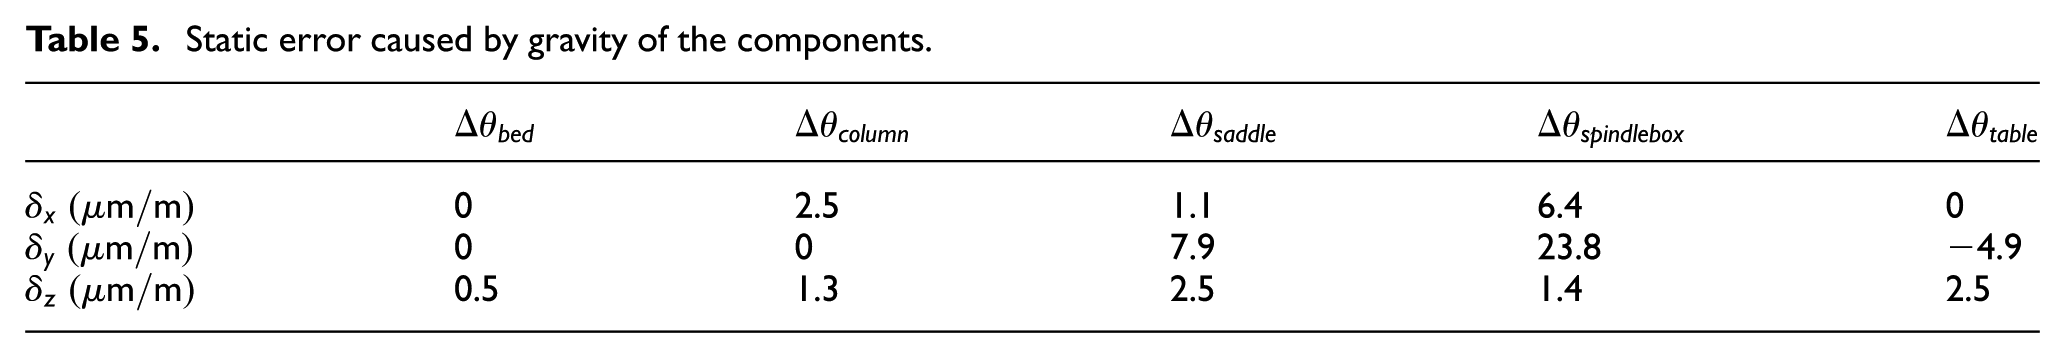
According to the FEM results, the angular error caused by gravity of every component is generated in Table 5, and the error state could be calculated. Furthermore, the error accumulation in each assembly station is shown in Figure 10(c).
Static error caused by gravity of the components.
As illustrated in Figure 10(a), the normal direction straightness of the Y-axis and Z-axis represents an uphill trend in the assembly process, and the final errors are 62.39 µm and 6.6 µm, respectively, before adjustment; for X-axis, the straightness represents a downtrend in assembly process, and the final error is 13.11 µm. From Figure 10(b), we could observe that all the errors could be reduced to 5 m after adjustment.
Similarly, the angular error of X-, Y- and Z-axes could be reduced from 10.0, 26.8, and 8.2 µm/m to 6.3, 4.6, and 0.09 µm/m, respectively, based on Figure 10(c) and (d).
Experiment
The machine center assembly performance is verified by M800H in Beijing Precision Machinery & Engineering Research Co., Ltd. Measurements were conducted using the Taylor Ultra Autocollimator.
Measurements were conducted on the guide rail components before they were first assembled. Ultra Autocollimator was used in the measurement of straightness misalignment with the reflector mounted on the guide rail and the light pipe fixed to receive the reflected light. During measurement, the reflector was placed at different positions on the guide rails. The measurement setup and the comparison between the result of experimental measurements and the simulation are illustrated in Figure 11. Every row covers three sub sections: the measurement setup, the straightness error before and after adjustment.
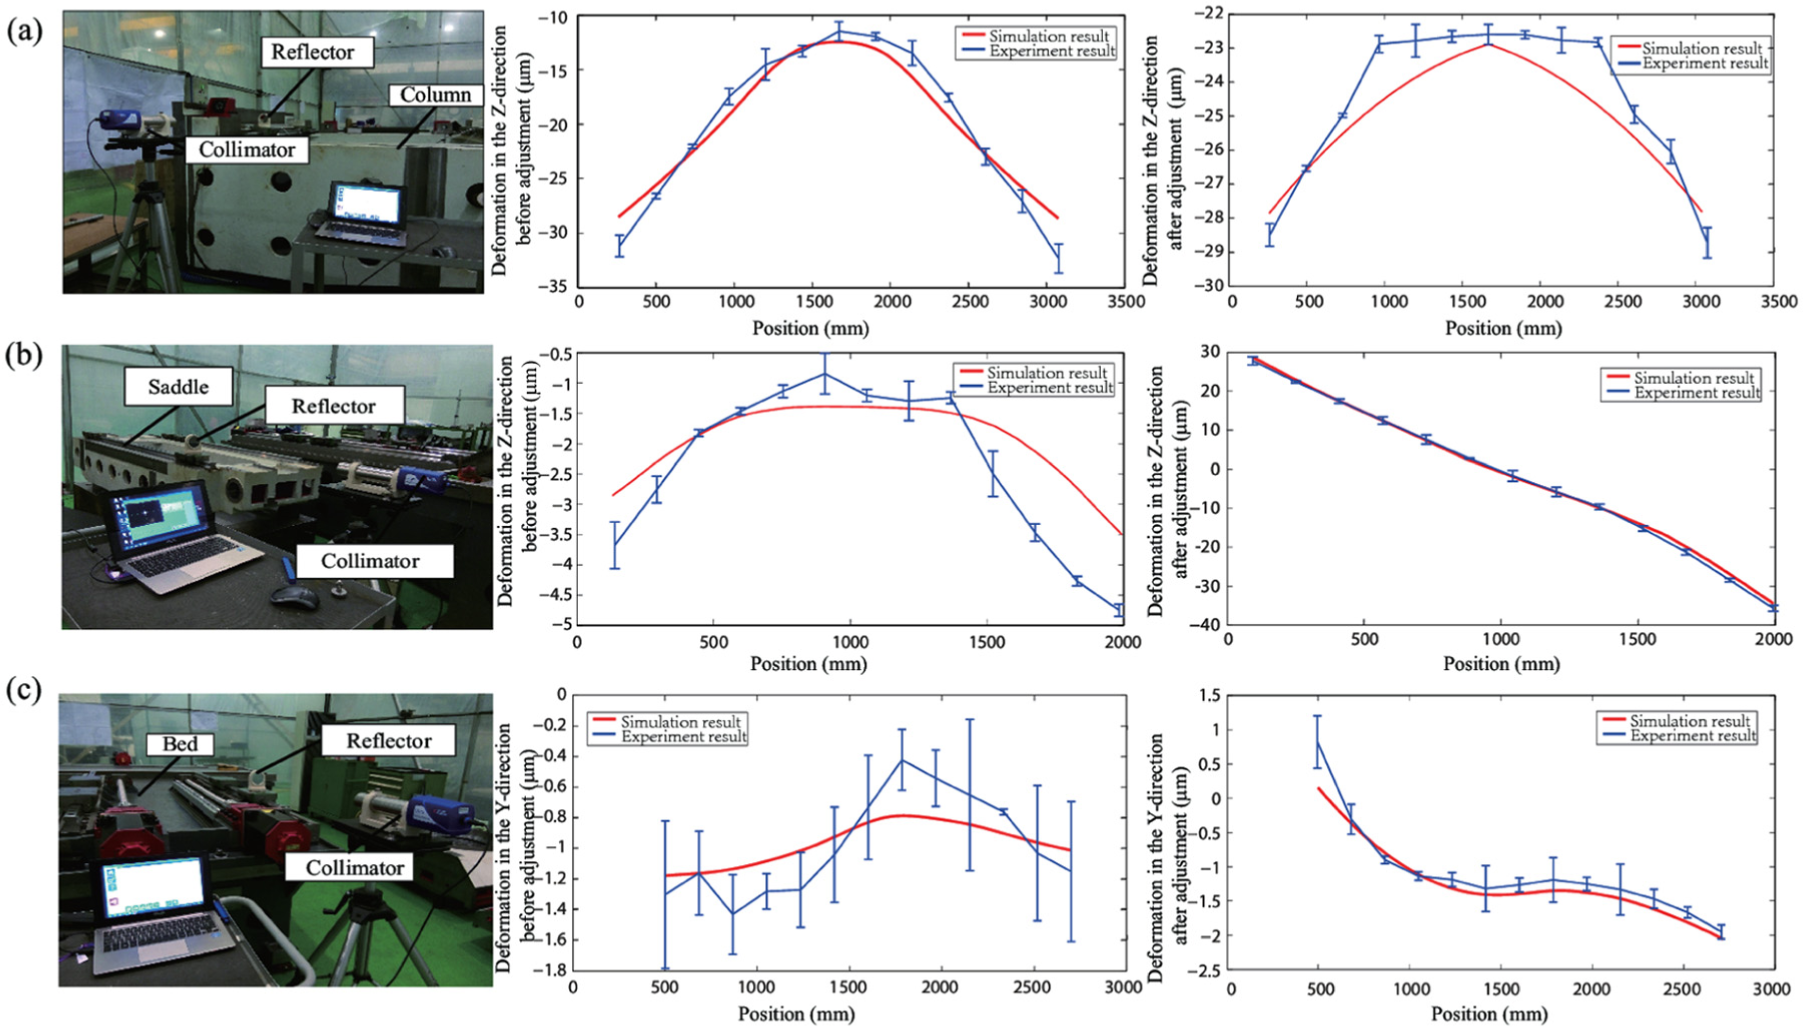
Experiment setup for straightness error before assembling: (a) X-axis upper guide, (b) Y-axis left guide, and (c) Z-axis left guide.
It should be noted that the error was derived not only from the stiffness error caused by gravity deformation but also from the machining error, supporting device and fixture layout; since only the gravity impact has been considered in this study, and it could be accepted that errors exist between experimental and simulation results. The experiments of X-axis upper guide rail, Y-axis left guide rail, and Z-axis left guide rail were conducted in this study. It is illustrated that the maximum variation ratios of the result are 11.2%, 26.2%, and 20.5%, respectively. In addition, the experimental results and deformation trend are consistent with the simulation results. Therefore, it should be regarded that the achieved qualitative conformity was high, which proves the high reliability of the calculation using the aforementioned FEM model.
Meanwhile, the measurement for the final accuracy inspection after assembling all the components was conducted using laser interferometer as shown in Figure 12. Figure 12(a) illustrates the straightness measurement setup; only the measurement for X-axis is illustrated here. The straightness errors of three axes in the final were 6.15, 7.36, and 5.74 µm, respectively. Figure 12(b) demonstrates the angular measurement setup; only the measurement for Y-axis is illustrated here. The angular errors of three axes in the final were 3.47, 4.44, and 3.30 µm/m, respectively. According to ISO 230-1-2012 test code for machine tools part 1: geometric accuracy of machines operating under no-load or quasi-static conditions and the acceptance criteria, 26 the straightness errors of the three axes are 5 m and the angular errors are 25 µm/m. It could be observed that the straightness and the angular errors could satisfy the requirement in this method.

Experimental setup for accuracy verification in the final: (a) experimental setup for straightness and (b) experimental setup for angular.
Conclusion
This study proposes an approach to predicate the variation propagation considering gravity deformation in the assembly process of precision machine tools. The following conclusions could be inferred:
Gravity deformation is demonstrated to be one of the major causes of geometric errors of precision machine tools. An FEA method is developed to evaluate the variation accumulation in the assembly process. The column and saddle would produce a deformation in a reverse direction compared to the working station before being assembled. Besides, the deformation changes with the position of the moving parts. This study proposes a comprehensive FEM of the machine tool assembly process consistent with a given assembly sequence. Based on this method, the total deformation caused by gravity could be obtained.
Combining the simulation results with the variation propagation model, the straightness errors and angular errors could be calculated, which were used to determine the adjustment values to enhance the accuracy.
The measurement of the same horizontal machine center is conducted to validate the proposed method. The straightness error and angular error could be reduced to satisfy the required accuracy according to the proposed adjustment. The results verify that the proposed method was effective in its ability to realize the performance of the machine tool assembly.
Footnotes
Handling Editor: Jining Sun
Declaration of conflicting interests
The author(s) declared no potential conflicts of interest with respect to the research, authorship, and/or publication of this article.
Funding
The author(s) disclosed receipt of the following financial support for the research, authorship, and/or publication of this article: This work was supported by the National Key Science and Technology Special Projects under grant no. 2015ZX04005001.