
Abstract
Nowadays solid state recycling of aluminum chips provides a competitive market for the aluminum foundry. Chip recycling requires an efficient pretreatment system in terms of optimizing consolidating technique to achieve a high metal recovery with rapid return of investment and hence drive down fixed cost and increase productivity without compromising on metal quality. Solid state recycling through hot extrusion is a promising technique to recycle machining chips without re-melting. In this article, aluminum chips were cold compacted followed by hot extrusion under extrusion ratio of 5.2 and at three different extrusion temperatures of 350°C, 425°C, and 500°C. The effect of extrusion temperature on the surface roughness (Ra and Rz) and machining time needed to remove a unit volume of aluminum alloy 6061 machined by turning were investigated. The effect of extrusion temperature was investigated using the Box–Behnken design; three machining parameters (depth of cut, feed rate, and cutting speed) on the surface roughness of the machined specimens were also examined. Obtained results were in favor of the presence of significant effect of those four parameters on specimen surface roughness with dominating effect of feed rate. Moreover, the optimum cutting conditions for minimum machining time per unit volume (Tm) while Ra is kept below an industrially accepted value of 0.8 μm was found for the original alloy for the following cutting conditions: cutting speed of 116 m/min, depth of cut of 0.33 mm, and feed rate of 0.11 mm/rev.
Keywords
Introduction
As the world population growth will follow a pattern that is close to exponential in the near history, the consumption of the planet’s limited and finite resources is thought to increase dramatically. Recycling, originated long time ago in mankind history, was given a significant consideration during the 20th century. The goal of recycling was to help communities move towards sustainability by converting waste into useful materials and hence reducing the amount of fresh resources consumed including material and energy. Recycling also was useful in reducing pollution in all forms.
Recycling aluminum scrap is an economically viable process due to the high price of aluminum alloys, high volumes produced all over the world, and high scrap rate during casting, machining, and various manufacturing processes. Aluminum chips are the hardest, among aluminum scrap types, to be recycled using conventional methods due to the nature of chips’ different sizes and shapes and being covered in lubricants and oxides. 1 Significant work was conducted to develop special methods, known generally as direct recycling processes. While conventional recycling processes allow only the use of about 52% of scrap in new products, direct recycling processes allow for the use of up to 96%. 2 Regarding the material and energy losses, the direct recycling of aluminum scrap proves to have higher efficiency than re-melting process.3,4
Tekkaya et al. 5 investigated the hot extrusion of aluminum chips from milling and turning operations. They concluded that the chip geometry did not affect the extrusion process and the way the billets were produced and compacted. The most significant factor was using chips from the same kind of alloys. Machining parameters and cutting properties were very similar to those produced by conventional extrusion. The yield strength of the product was only 10% less than that of profiles extruded from solid billets. Analysis of variance (ANOVA) was used to estimate the effect of each factor, and it was found that the most significant factor affecting surface roughness is the feed rate followed by the lubrication use and alloy source. 6
Lela et al. 7 built a mathematical model to relate the process parameter of direct recycling aluminum alloy EN AW 2011 into semi-products using hot extrusion. The Box–Behnken experimental design was used to build the model. The studied process parameters were extrusion temperature (ET), chip size, and compact force. The results showed that the ET was the only factor affecting tensile strength. Yield strength was affected significantly by both ET and chip size. Optical microscopy showed that extruded samples at both low temperature and compact force showed poor metallic bonding between chips accompanied by the presence of cracks and in-homogeneities in contrast to those extruded at high temperature.
Equal channel angular pressing (ECAP) process was used by Haase et al. with the integration of extrusion die to enhance the mechanical properties of extruded AA 6060 chips. A conventional forward extrusion press was used to produce cold pre-compacted turning chips before hot extrusion. Two different temperatures (450°C and 500°C) were used to examine the effect of ET. The results showed superior mechanical properties including strength, ductility, chip bonding of ECAP, and extruded samples compared to the ones subjected to extrusions only. 8
Shamsudin investigated the temperature and preheating time effect on milling chips of AA 6061 hot extruded through a flat-faced die using different preheating temperatures. The chips are cold compacted before the extrusion. Different preheat time periods were tested. The results showed that the ET and preheat time have significant effect on the product’s mechanical properties. The highest strength and ductility were attained at a temperature of 500°C and preheat time of 2 h. 9
Güley et al. 10 have extruded a mixture of AA1050 pins with AA6060 chips to investigate the mixture mechanical properties. The extruded profiles of the mixture showed intermediate character between AA1050 and AA6060 as cast billet, while the pure AA6060 chip profiles proved very comparable properties to those of as-cast billets.
The objective of the current work is to consolidate 6061 aluminum chips by cold compaction followed by hot extrusion at three temperatures and investigate the surface quality, produced by turning machining, through measurements of surface roughness achieved for different process variables. Three levels of machining parameters are implemented, namely, cutting speed, feed rate, and depth of cut.
ANOVA will be conducted, and a quadratic model relating surface roughness to the process variables will be concluded.
Materials and methods
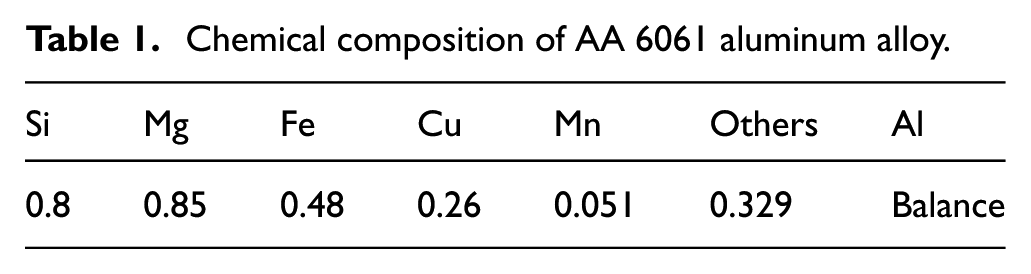
The material used in this article was aluminum alloy AA 6061 (as received). The chemical composition of this aluminum alloy is presented in Table 1. The machined chips are prepared by dry turning of the as-received rod using the cutting conditions specified as: cutting speed of 88 m/min, feed rate of 1 mm/rev, and depth of cut of 1 mm. The chips undergo cold compaction to be followed by hot extrusion through the flat-faced die at three different temperatures (350°C, 425°C, and 500°C) with extrusion ratio of 5.2.
Chemical composition of AA 6061 aluminum alloy.
Relative density of the as-received and hot extruded samples was measured using Archimedes’ immersion principle (in distilled water). The microstructure of as-received and hot extruded specimens was examined using optical microscopy on Zeiss Axio Imager. The specimens under microstructure investigation were prepared using the following machining processes: grinding, polishing, and etching using Keller’s reagent. The tensile test was conducted at ambient temperature using LR300K (300 kN) universal testing machine. Tensile tests were performed at an initial strain rate of 83.3 × 10⁻⁵ s−1 at room temperature. Fabrication of the tensile test specimens was produced according to ASTM-B557-06 standard, that is, parallel to the extrusion direction.
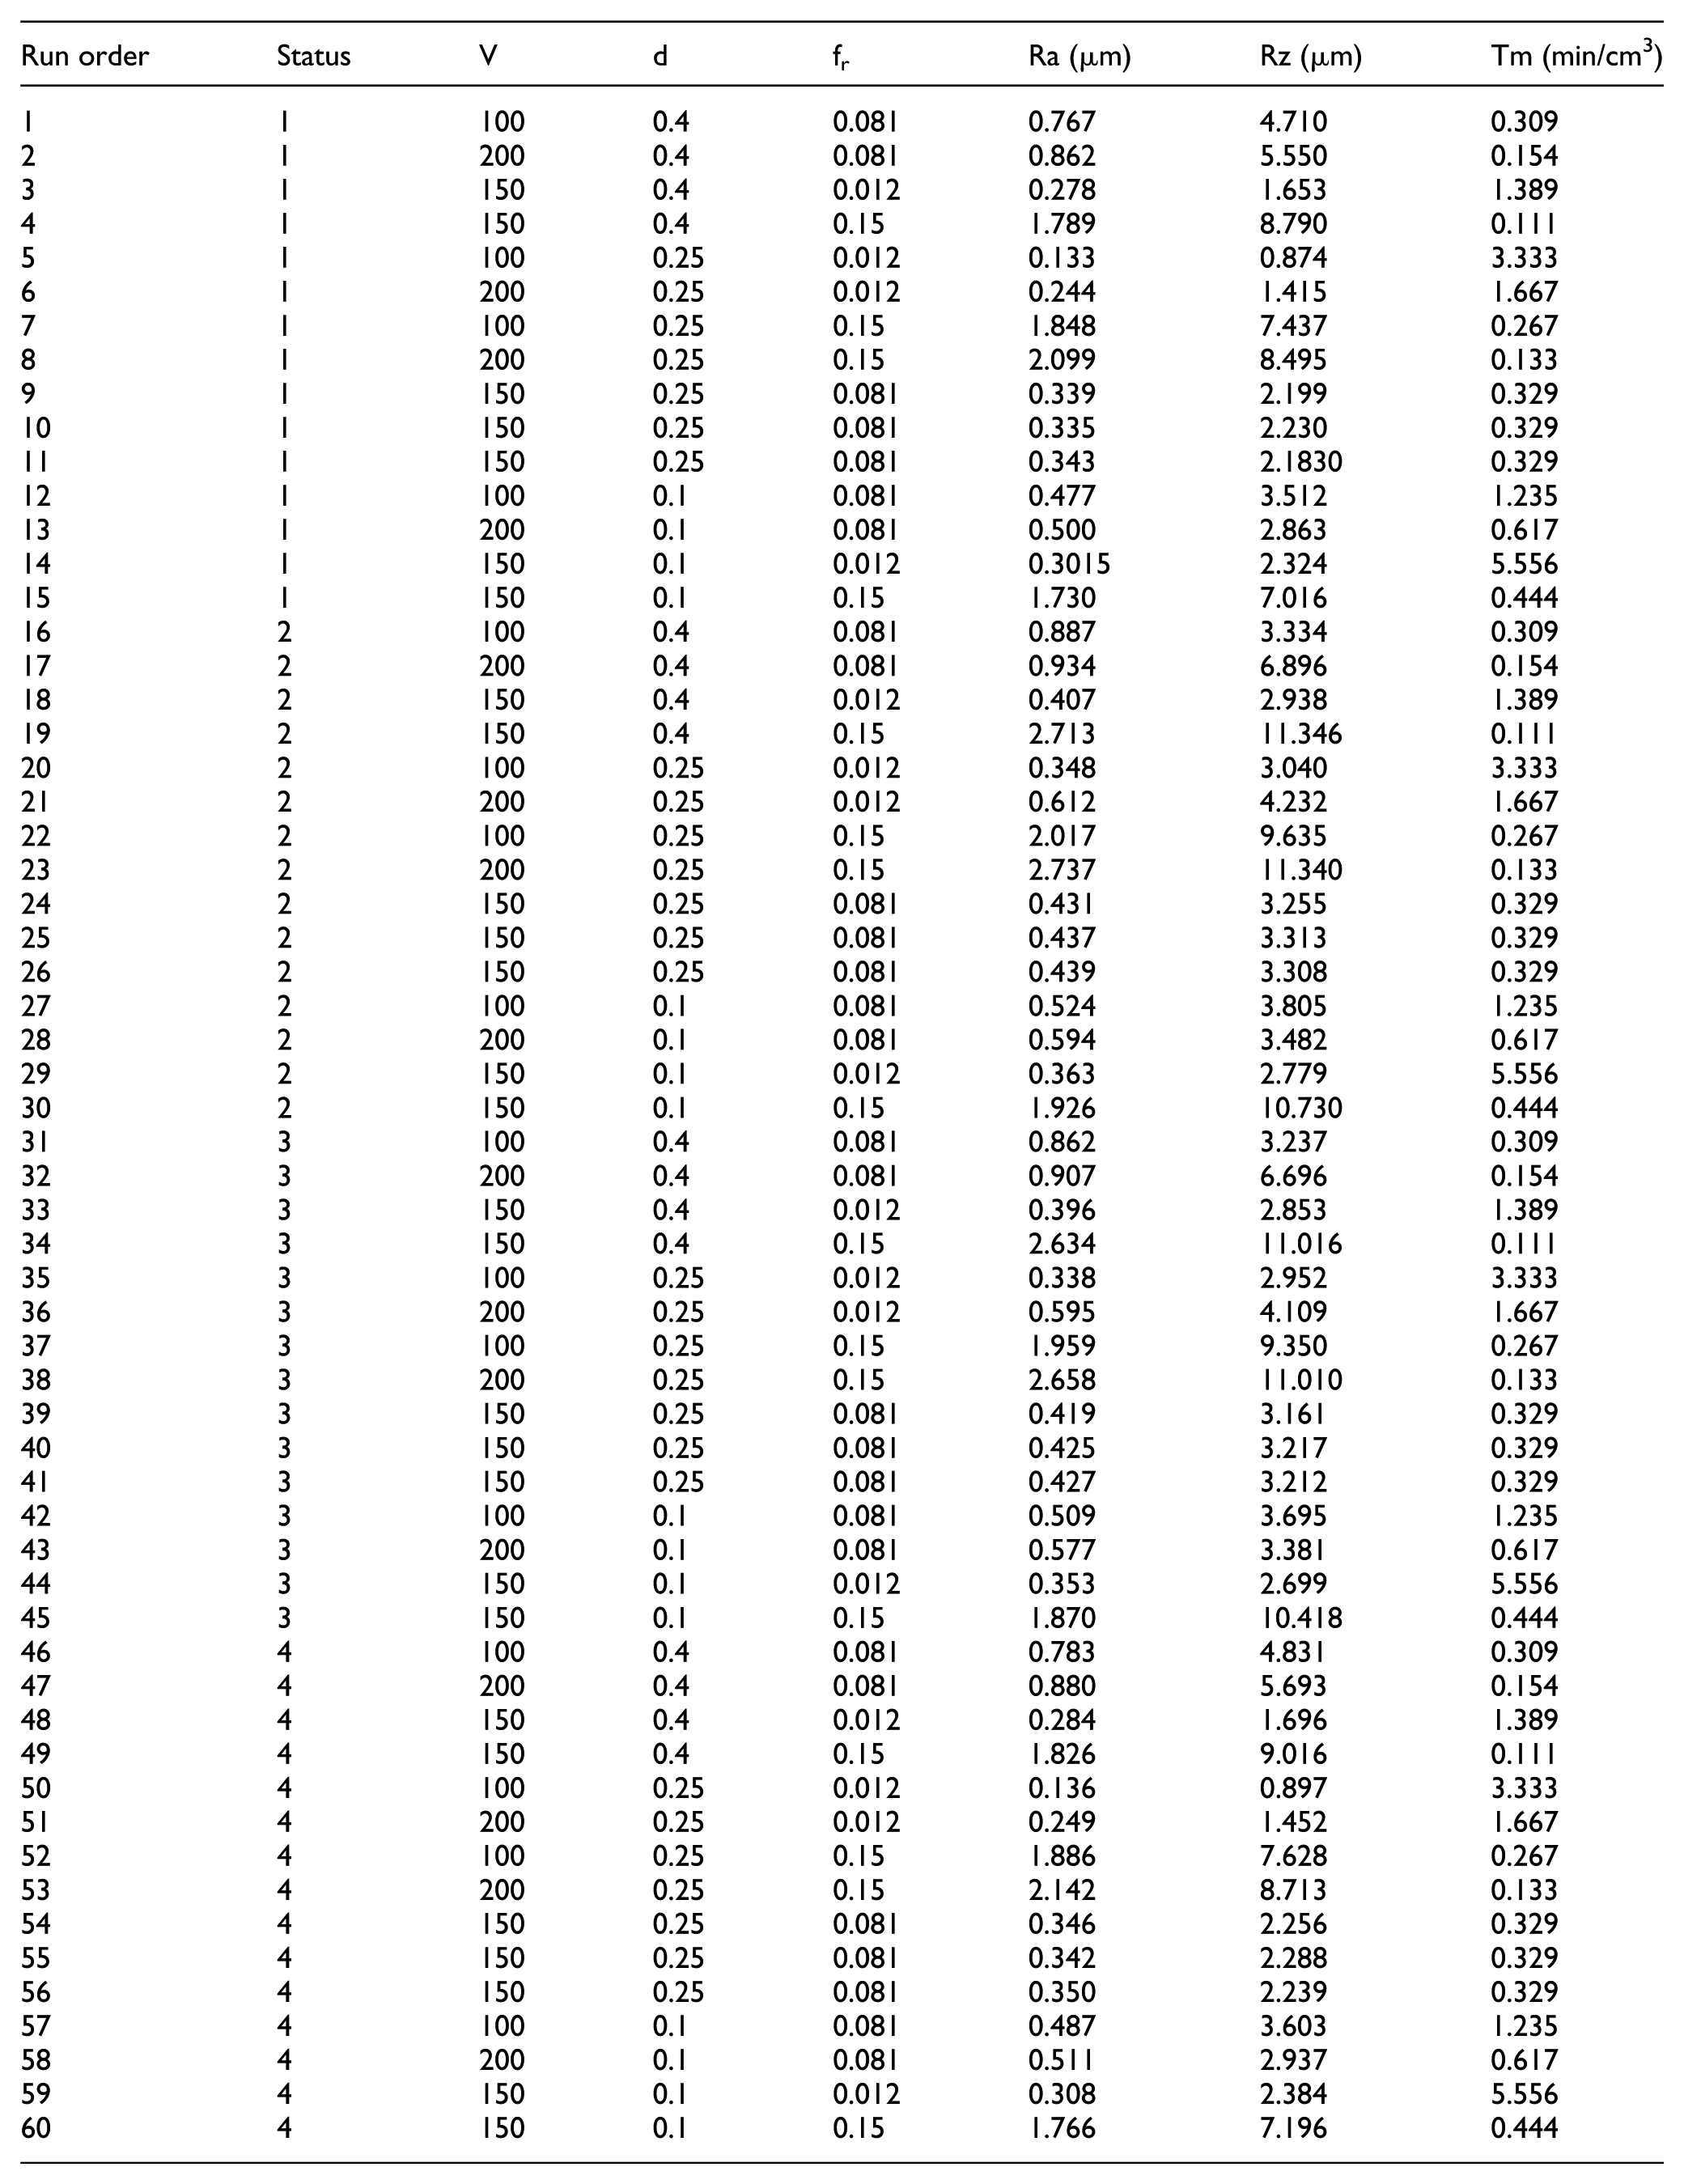
After extrusion process, the billets were machined using the Emco Concept Turn 45 computer numerical control (CNC) lathe, which is equipped with a Sinumeric 840-D. All test runs were done using CNC part program. The specification for tool holder and insert is SVJCL2020K16 and VCGT160404 FN-ALU, respectively. The cutting tool angles are maintained at clearance angle of 5°, cutting edge angle of 35°, and a nose radius of 0.4 mm. CNC part program controls all cutting parameters and in wet conditions. The produced surface roughness was measured using surface roughness tester TESA. The test specimen drawing is shown in Figure 1, while the test specimen fixation to the test rig for machining is shown in Figure 2. The test rig for measuring surface roughness is shown in Figure 3. The test specimens had an initial length of 100 mm with a diameter of 11 mm. The test specimens were divided into five areas. The first area with a length of 40 mm was used for chuck clamping, and the other four areas with 10 mm for each and separated by a groove of 2 mm were used for machining with different feed rates as shown in Figure 1. The test specimens had four different starting conditions; as received, hot extruded at three different temperatures 350°C, 425°C, and 500°C. The cutting parameters and values of surface roughness Ra and Rz, and machining time needed to remove a unit volume are recorded in Appendix 2, where Ra is the arithmetic average deviation of the profile being assessed in µm and Rz is the average height of the profile in µm.

Test specimen drawing.

Test specimen fixation to the test rig for machining.
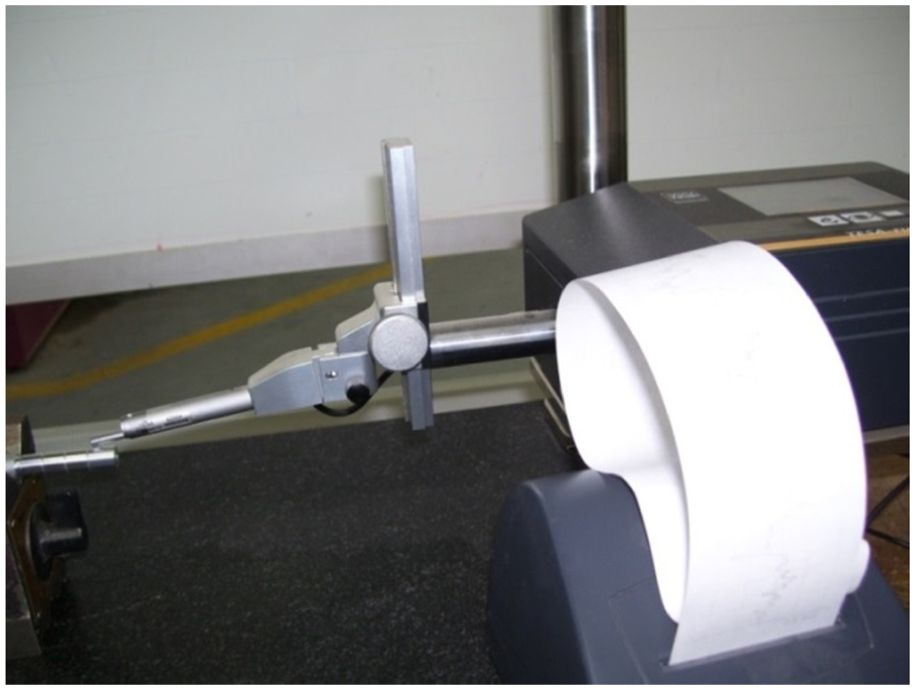
Test rig for measuring surface roughness.
One of the main techniques used for statistical and mathematical optimization of output variables is the response surface methodology (RSM). Those variables, represented in the model by the dependent variables, are influenced by a set of controllable input variables, or factors, (represented in the model by the independent variables). 11 The Box–Behnken design is one of RSM designs that is used extensively in studying and optimizing surface roughness of different machining processes through several publications.7,12–15
The Box–Behnken design was first introduced in 1960 by Box and Behnken. 16 The design has two main advantages: (1) very efficient design with fewer design points than the traditional RSM central composite design (CCD) and (2) the design does not contain points at the corners of the cubic shape created by the factors boundaries which is frequently hard or costly to achieve.
In this research, a rotatable Box–Behnken design consisting of 60 experiments was built including four factors, namely, cutting speed, feed rate, depth of cut, and specimen condition. Table 2 summarizes the studied factors and their levels. The specimen condition was treated as a categorical variable, while the other factors were treated as continuous variables. Appendix 2 illustrates the full list of experiments with measured response values (Ra and Rz) in micrometers.
Cutting parameters and their levels used in the Box–Behnken design.

Results and discussions
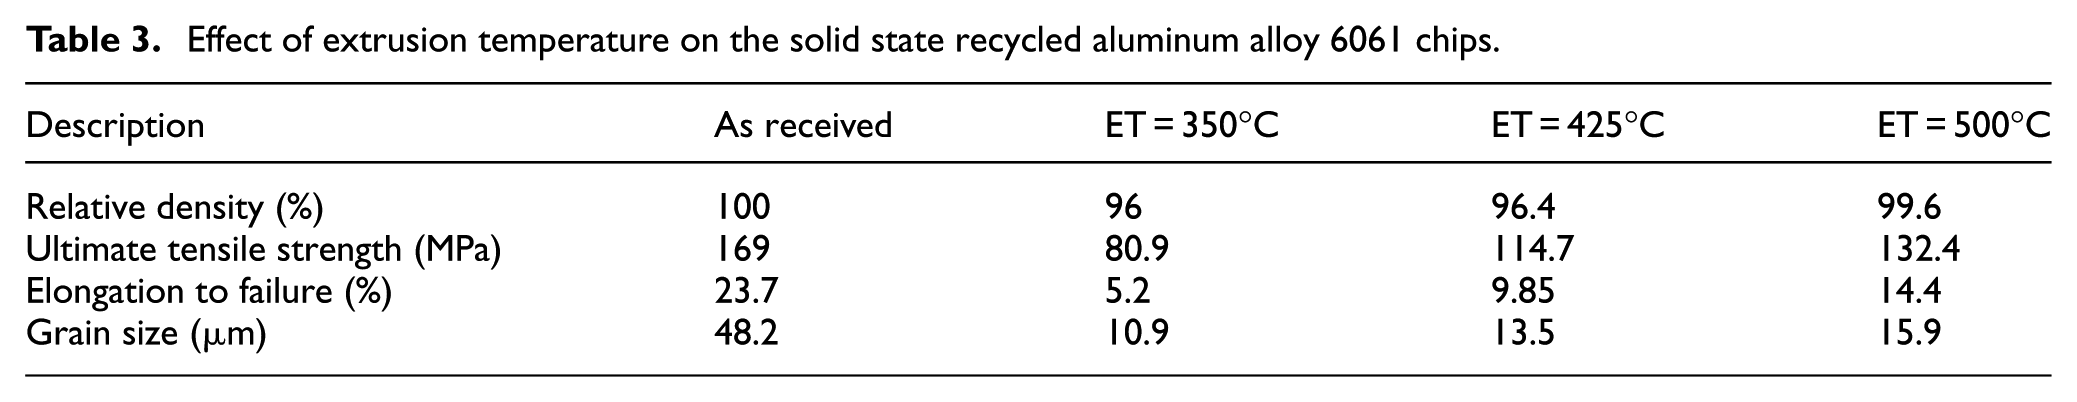
The tensile properties of the as-received rod and extruded recycled product are shown in Table 3, along with the relative density. The relative density is 96%, 96.4%, and 99.6% for ETs of 350°C, 425°C, and 500°C, respectively. It can be explained that higher ET enables plastic flow of material to fill voids and make the sample fully dense.1,4,9 The high relative density has a significant effect for improving the surface roughness value. Moreover, the results illustrated in Table 3 show that the ET has crucial effect on tensile properties of hot extruded chips, which increases proportionally with temperature when increased from 350 to 500°C. The ultimate tensile strength (UTS) of the extruded chips increased significantly from 80.9 to 132.4 MPa with the increase in ET from 350°C to 500°C. The same trend was also noted in the case of the elongation to failure (%). It was increased from 5.2% to 14.3% with the increase in the ET from 350°C to 500°C. The increase in UTS and elongation% with the increase in ET is due to the decrease in the porosities% as proved by relative density measurements. The improvements made in the tensile properties of the recycled chip samples due to the increase in ET are in good agreement with the previous work reported by Haase et al. 8
Effect of extrusion temperature on the solid state recycled aluminum alloy 6061 chips.
The microstructure of the as-received sample is composed of coarse-grained structure with average grain size of about 48.2 μm as shown in Figure 4(a). However, the recycled samples consisted of finer grains as compared to as-received specimen as shown in Figure 4(b)–(d). Average grain sizes of 10.9 and 15.8 were noted for samples extruded at ET 350°C and 500°C, respectively, as shown in Table 2.

Microstructure of (a) as-received and hot extruded chips, (b) ET = 350°C, (c) ET = 425°C, and (d) ET = 500°C.
The finer microstructure obtained in the case of the recycled samples is due to severe plastic strain imposed during machining, compaction, and extrusion processes.8,17,18 These observations are congruent with previous works.8,18 Haase et al. 8 observed that the grain size of the as-received AA 6060 alloy was 385 µm, while it was 31.8 µm for the hot extruded chips at 450°C. Moreover, in previous work by Hu et al., 18 the Mg ships were classified into three different groups according to its size. The grain size of the as-received Mg alloy was 200 µm, while it was 22, 25, and 11 µm for the three different groups’ chips recycled by hot extrusion at 400°C.
Figures 5 and 6 show the variation of both Ra and Rz versus the specimen condition respectively. The roughness was depicted at a particular machining condition (cutting speed of 150 m/min, feed rate of 0.081 mm/rev, and depth of cut of 0.25 mm) which comprises the center point of the Box–Behnken design. The figures illustrate that the roughness values of specimens extruded from AA 6061 chips at temperatures 350°C and 425°C were significantly higher than those of the original AA 6061 alloy specimen. It is also clear that extrusion at 500°C reduces the roughness values to a very close value as the original alloy. These results match previous research that proved the significant effect of ET on extruded chips’ mechanical properties.7–9

Surface roughness, Ra (µm), versus specimen condition.

Surface roughness, Rz (µm), versus specimen condition.
A quadratic model of the form given in equation (1) was fitted to the data using Minitab 17 software depending on the Box–Behnken design. Stepwise technique was utilized to reduce the model into significant terms only. Stepwise is an automated technique that adds terms to the model one by one. The added term is kept in the model if it has a significant effect (p-value < 0.05), otherwise, it is removed. The process is repeated until the model includes only all of the significant terms 19

where
Table 4 illustrates the quadratic models developed for Ra and Rz. The specimen condition (factor D) and its significant interactions are not included in the equation since it is treated as a categorical factor as mentioned before. The adequacy of the quadratic models was tested through calculating the coefficient of determination. Adjusted R2 and predicted R2 were calculated as 95% and 92%, respectively, for both Ra and Rz.
Quadratic models for Ra and Rz.

Machining time needed to remove a unit volume (Tm) measured in min/cm3 was calculated for each run using equation (2), where V = surface cutting speed (m/min), fr = feed rate (mm/rev), and d = depth of cut (mm). Optimization process was run using the desirability function approach to minimize the machining time per unit volume while maintaining Ra below 0.8 μm for all starting material conditions. The results showed that the optimum (minimum) machining time of 0.24 min/cm3 for the predicted surface roughness of 0.698 μm was achieved for the original AA 6061 alloy (specimen condition 1) at the cutting speed of 116 m/min, feed rate of 0.11 mm/rev, and depth of cut of 0.33 mm. Figure 7 shows the optimization plot for Ra with the red line pointing to the value of optimum solution at each factor. It is worth mentioning that similar predicted surface roughness (Ra) of 0.713 µm was calculated for the consolidated extruded chip at 500°C (specimen condition 4) using the same machining conditions. For chips extruded at temperatures of 350°C and 425°C, a little higher machining time will be needed to maintain the same level of surface roughness

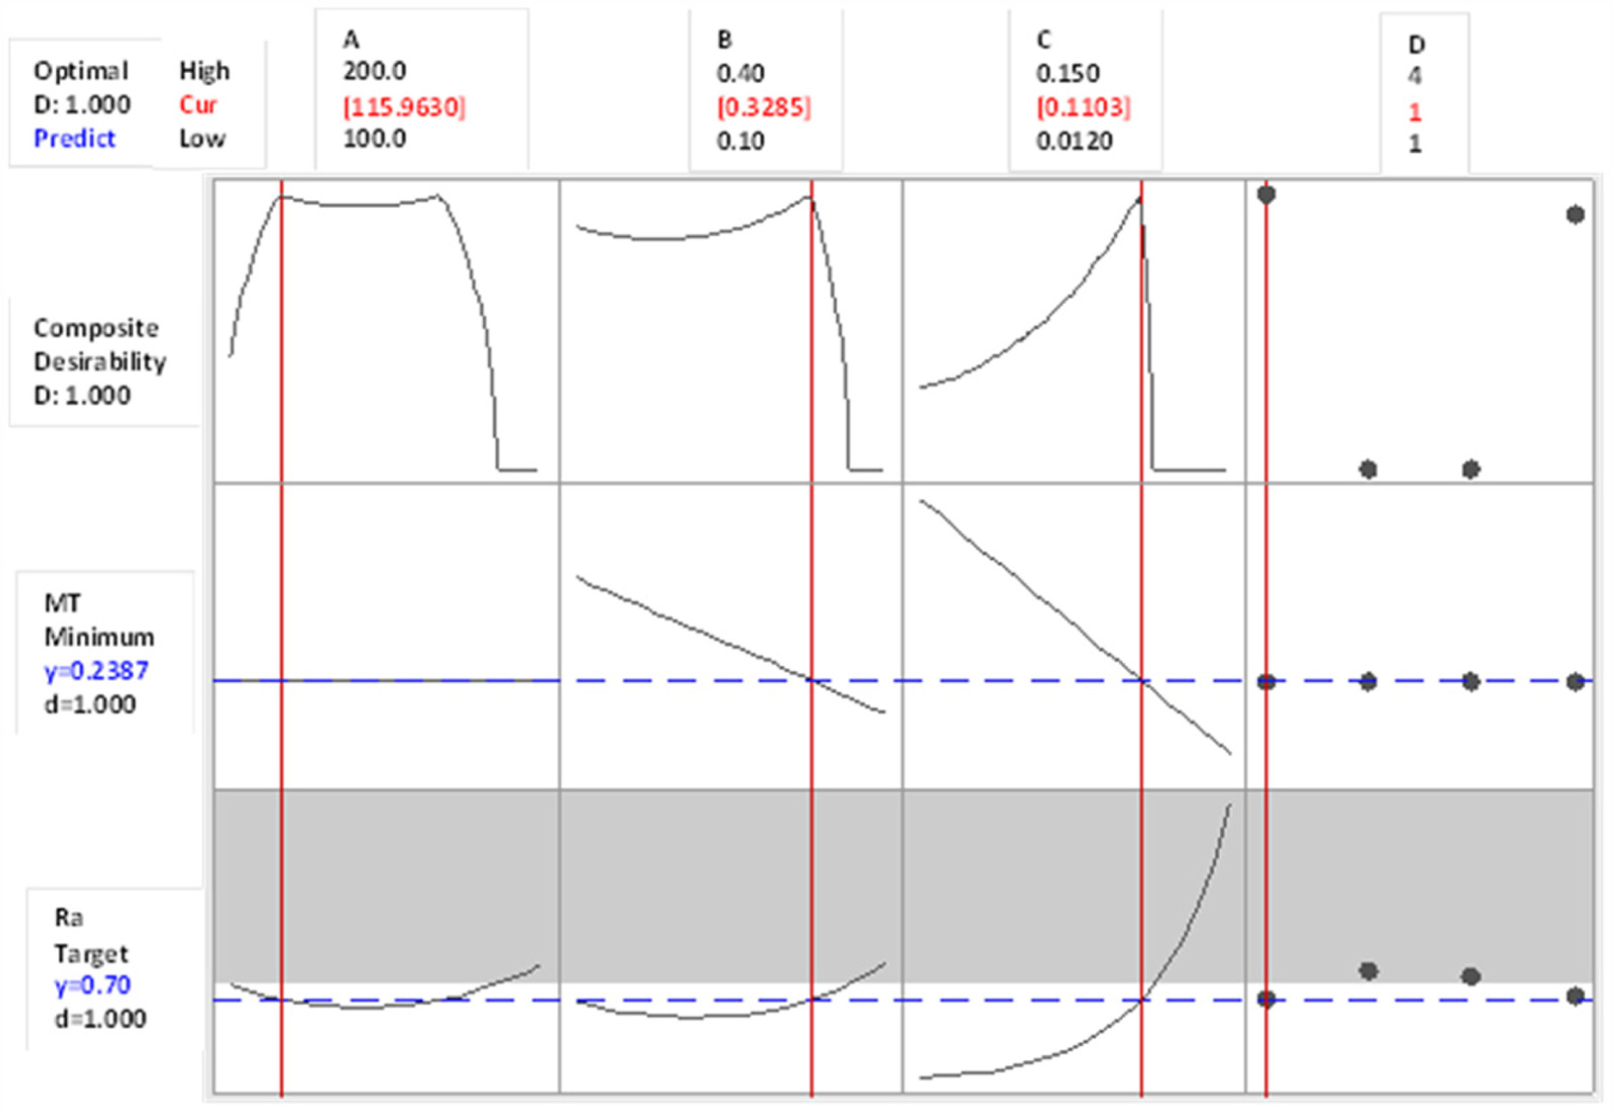
Optimization plot for Ra.
ANOVA was used to investigate the effect of each factor (linear and quadratic) and interaction for its significance in the model. The results illustrated in Table 5 for Ra show that all factors have significant effect on Ra with their both linear and quadratic terms. The feed rate, by far, had the greatest influence on the surface roughness in both its linear and quadratic terms.
ANOVA results for Ra.

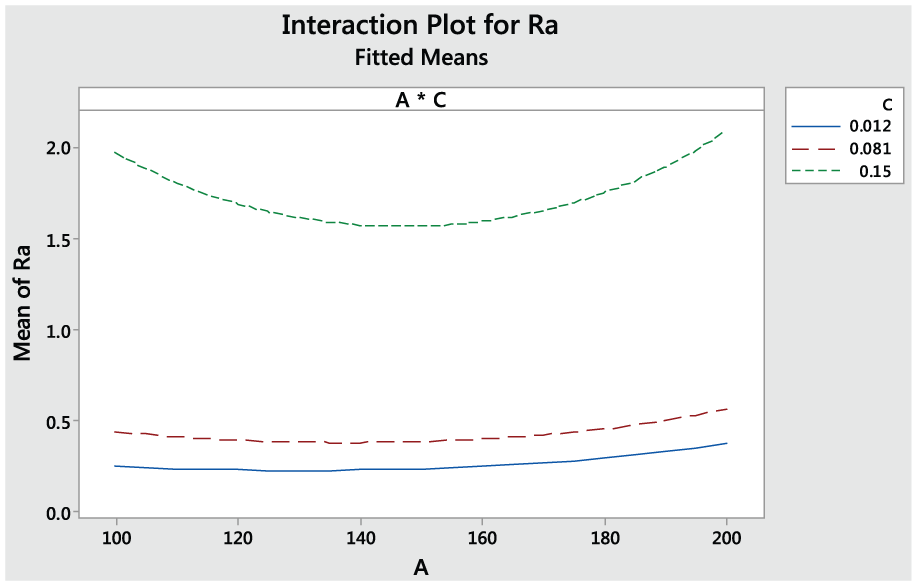
Figures 8 and 9 show the plots for significant interactions of feed rate–cutting speed and feed rate–specimen condition, respectively. Although these interactions are statistically significant, they have little effect on the variation of Ra which is illustrated by almost parallel curves in the plots. The ANOVA results for Rz showed the same patterns except that the significant interaction is cutting speed and feed rate.
Interaction plot of cutting speed and feed rate for Ra.

Interaction plot of specimen condition and feed rate for Ra.
Figures 10–12 show the surface plots of Ra versus two of the studied processing parameters while fixing the third parameter at its mean value. The response surfaces in the figures were plotted for specimen condition (1). The figures show the curvature nature of the relationship between Ra and the studied factors as a result of significant interaction and quadratic terms.

Response surface plot for Ra versus cutting speed and depth of cut at a mean feed rate of 0.081 mm/rev.

Response surface plot for Ra versus cutting speed and feed rate at a mean depth of cut 0.25 mm.

Response surface plots for Ra versus depth of cut and feed rate at a mean cutting speed of 150 m/min.
To validate this model, extra 16 experimental runs were conducted. Four machining conditions, one of which was the predicted optimum condition, were selected for the four starting specimen conditions (as received, ET = 350°C, ET = 425°C, and ET = 500°C). For all these 16 conditions, the measured surface roughness values were compared to the predicted ones as shown in Table 6. Figure 13 shows a scatter plot for both measured and predicted values. It is clear from the figure that the relation between them is linear with calculated R2 of 0.98. It is worth mentioning that the machining parameters that corresponded to the optimum condition of Ra and Tm (cutting speed of 116 m/min, feed rate of 0.11 mm/rev, and depth of cut of 0.33 mm) yielded an experimental value of Ra of 0.635 µm compared to the predicted value of 0.698, for specimen condition 1, which exhibited about 9% error.
Extra runs for validation and verification of the predicted equations in Table 4.


Scatter plot for the predicted versus experimental Ra values for the (16) validation runs.
Conclusion
Solid state recycling is promoted due to its low environmental impact, which produces no waste or pollution. In the current work, 6061 aluminum chips, produced by dry turning, are consolidated by cold compaction followed by hot extrusion at three temperatures. Surface roughness values of machined surfaces by turning are measured for different machining parameters (three levels for cutting speeds, feed rates, and depths of cut). Quadratic models, generated by ANOVA, are generated with only significant terms that relate surface roughness to the process variables. It was concluded that the most significant factor on the surface roughness is the feed rate, both its linear and quadratic terms. The optimum cutting conditions for minimum machining time per unit volume (Tm) while Ra is kept below an industrially accepted value of 0.8 µm was found for the original alloy for the following cutting conditions: cutting speed of 116 m/min, depth of cut of 0.33 mm, and feed rate of 0.11 mm/rev. These optimum cutting conditions resulted in Tm value of 0.24 min/cm3 and a predicted Ra value of 0.698 µm. It is concluded that for chips extruded at temperatures of 350°C and 425°C, a little higher machining time will be needed to maintain the same level of surface roughness. In total, 16 new experimental tests were used to validate the model, and a comparison between the predicted and the experimental values of Ra concluded the successfulness of the proposed model with maximum error of 10%.
Footnotes
Appendix 1
Appendix 2
| Run order | Status | V | d | fr | Ra (µm) | Rz (µm) | Tm (min/cm3) |
|---|---|---|---|---|---|---|---|
| 1 | 1 | 100 | 0.4 | 0.081 | 0.767 | 4.710 | 0.309 |
| 2 | 1 | 200 | 0.4 | 0.081 | 0.862 | 5.550 | 0.154 |
| 3 | 1 | 150 | 0.4 | 0.012 | 0.278 | 1.653 | 1.389 |
| 4 | 1 | 150 | 0.4 | 0.15 | 1.789 | 8.790 | 0.111 |
| 5 | 1 | 100 | 0.25 | 0.012 | 0.133 | 0.874 | 3.333 |
| 6 | 1 | 200 | 0.25 | 0.012 | 0.244 | 1.415 | 1.667 |
| 7 | 1 | 100 | 0.25 | 0.15 | 1.848 | 7.437 | 0.267 |
| 8 | 1 | 200 | 0.25 | 0.15 | 2.099 | 8.495 | 0.133 |
| 9 | 1 | 150 | 0.25 | 0.081 | 0.339 | 2.199 | 0.329 |
| 10 | 1 | 150 | 0.25 | 0.081 | 0.335 | 2.230 | 0.329 |
| 11 | 1 | 150 | 0.25 | 0.081 | 0.343 | 2.1830 | 0.329 |
| 12 | 1 | 100 | 0.1 | 0.081 | 0.477 | 3.512 | 1.235 |
| 13 | 1 | 200 | 0.1 | 0.081 | 0.500 | 2.863 | 0.617 |
| 14 | 1 | 150 | 0.1 | 0.012 | 0.3015 | 2.324 | 5.556 |
| 15 | 1 | 150 | 0.1 | 0.15 | 1.730 | 7.016 | 0.444 |
| 16 | 2 | 100 | 0.4 | 0.081 | 0.887 | 3.334 | 0.309 |
| 17 | 2 | 200 | 0.4 | 0.081 | 0.934 | 6.896 | 0.154 |
| 18 | 2 | 150 | 0.4 | 0.012 | 0.407 | 2.938 | 1.389 |
| 19 | 2 | 150 | 0.4 | 0.15 | 2.713 | 11.346 | 0.111 |
| 20 | 2 | 100 | 0.25 | 0.012 | 0.348 | 3.040 | 3.333 |
| 21 | 2 | 200 | 0.25 | 0.012 | 0.612 | 4.232 | 1.667 |
| 22 | 2 | 100 | 0.25 | 0.15 | 2.017 | 9.635 | 0.267 |
| 23 | 2 | 200 | 0.25 | 0.15 | 2.737 | 11.340 | 0.133 |
| 24 | 2 | 150 | 0.25 | 0.081 | 0.431 | 3.255 | 0.329 |
| 25 | 2 | 150 | 0.25 | 0.081 | 0.437 | 3.313 | 0.329 |
| 26 | 2 | 150 | 0.25 | 0.081 | 0.439 | 3.308 | 0.329 |
| 27 | 2 | 100 | 0.1 | 0.081 | 0.524 | 3.805 | 1.235 |
| 28 | 2 | 200 | 0.1 | 0.081 | 0.594 | 3.482 | 0.617 |
| 29 | 2 | 150 | 0.1 | 0.012 | 0.363 | 2.779 | 5.556 |
| 30 | 2 | 150 | 0.1 | 0.15 | 1.926 | 10.730 | 0.444 |
| 31 | 3 | 100 | 0.4 | 0.081 | 0.862 | 3.237 | 0.309 |
| 32 | 3 | 200 | 0.4 | 0.081 | 0.907 | 6.696 | 0.154 |
| 33 | 3 | 150 | 0.4 | 0.012 | 0.396 | 2.853 | 1.389 |
| 34 | 3 | 150 | 0.4 | 0.15 | 2.634 | 11.016 | 0.111 |
| 35 | 3 | 100 | 0.25 | 0.012 | 0.338 | 2.952 | 3.333 |
| 36 | 3 | 200 | 0.25 | 0.012 | 0.595 | 4.109 | 1.667 |
| 37 | 3 | 100 | 0.25 | 0.15 | 1.959 | 9.350 | 0.267 |
| 38 | 3 | 200 | 0.25 | 0.15 | 2.658 | 11.010 | 0.133 |
| 39 | 3 | 150 | 0.25 | 0.081 | 0.419 | 3.161 | 0.329 |
| 40 | 3 | 150 | 0.25 | 0.081 | 0.425 | 3.217 | 0.329 |
| 41 | 3 | 150 | 0.25 | 0.081 | 0.427 | 3.212 | 0.329 |
| 42 | 3 | 100 | 0.1 | 0.081 | 0.509 | 3.695 | 1.235 |
| 43 | 3 | 200 | 0.1 | 0.081 | 0.577 | 3.381 | 0.617 |
| 44 | 3 | 150 | 0.1 | 0.012 | 0.353 | 2.699 | 5.556 |
| 45 | 3 | 150 | 0.1 | 0.15 | 1.870 | 10.418 | 0.444 |
| 46 | 4 | 100 | 0.4 | 0.081 | 0.783 | 4.831 | 0.309 |
| 47 | 4 | 200 | 0.4 | 0.081 | 0.880 | 5.693 | 0.154 |
| 48 | 4 | 150 | 0.4 | 0.012 | 0.284 | 1.696 | 1.389 |
| 49 | 4 | 150 | 0.4 | 0.15 | 1.826 | 9.016 | 0.111 |
| 50 | 4 | 100 | 0.25 | 0.012 | 0.136 | 0.897 | 3.333 |
| 51 | 4 | 200 | 0.25 | 0.012 | 0.249 | 1.452 | 1.667 |
| 52 | 4 | 100 | 0.25 | 0.15 | 1.886 | 7.628 | 0.267 |
| 53 | 4 | 200 | 0.25 | 0.15 | 2.142 | 8.713 | 0.133 |
| 54 | 4 | 150 | 0.25 | 0.081 | 0.346 | 2.256 | 0.329 |
| 55 | 4 | 150 | 0.25 | 0.081 | 0.342 | 2.288 | 0.329 |
| 56 | 4 | 150 | 0.25 | 0.081 | 0.350 | 2.239 | 0.329 |
| 57 | 4 | 100 | 0.1 | 0.081 | 0.487 | 3.603 | 1.235 |
| 58 | 4 | 200 | 0.1 | 0.081 | 0.511 | 2.937 | 0.617 |
| 59 | 4 | 150 | 0.1 | 0.012 | 0.308 | 2.384 | 5.556 |
| 60 | 4 | 150 | 0.1 | 0.15 | 1.766 | 7.196 | 0.444 |
Academic Editor: Kang Cheung Chan
Declaration of conflicting interests
The author(s) declared no potential conflicts of interest with respect to the research, authorship, and/or publication of this article.
Funding
The author(s) disclosed receipt of the following financial support for the research, authorship, and/or publication of this article: This project was supported by the King Saud University, Deanship of Scientific Research, College of Engineering Research Center.