
Abstract
Prototyping through incremental sheet forming is emerging as a latest trend in the manufacturing industries for fabricating personalized components according to customer requirement. In this study, a laboratory scale single-point incremental forming test setup was designed and fabricated to deform AA6061 sheet metal plastically. In addition, response surface methodology with Box–Behnken design technique was used to establish different regression models correlating input process parameters with mechanical responses such as angle of failure, part depth per unit time and surface roughness. Correspondingly, the regression models were implemented to optimize the input process parameters, and the predicted responses were successfully validated at the optimal conditions. It was observed that the predicted absolute error for angle of failure, part depth per unit time and surface roughness responses was approximately 0.9%, 4.4% and 6.3%, respectively, for the optimum parametric combination. Furthermore, the post-deformation responses from an optimized single point incremental forming truncated cone were correlated with microstructural evolution. It was observed that the peak hardness and highest areal surface roughness of 158 ± 9 HV and 1.943 μm, respectively, were found near to the pole of single-point incremental forming truncated cone, and the highest major plastic strain at this region was 0.80. During incremental forming, a significant increase in microhardness occurred due to grain refinement, whereas a substantial increase in the Brass and S texture component was responsible for the increase in the surface roughness.
Keywords
Introduction
Nowadays, manufacturing industries are leaning towards digital manufacturing for producing highly customized and flexible components to sustain the market competition and enhance customer satisfaction. Various digital manufacturing technologies such as direct metal laser sintering (DMLS), photopolymerization with ultraviolet (UV) range wavelengths, selective laser melting (SLM), direct metal laser deposition (DMLD) and prototyping with incremental sheet forming (ISF) have been widely investigated in the recent literature.1,2 Among these processes, researchers gain a special interest in ISF due to its capability of reforming the sheet metal into customer-oriented shape without any addition or subtraction of material. In this context, it is worthy to mention that there are several ISF variants such as single-point incremental forming (SPIF), two-point incremental forming (TPIF) and double-sided incremental forming (DSIF) to produce desired part geometry.3–7 The SPIF process is gaining much popularity and attention especially in the research community due to its ‘die-less’ nature, flexibility in part design and enhanced formability. The SPIF process has widespread applications in automobile, shipbuilding, aerospace, prototyping industries and also in biomedical sectors.8,9 In spite of several lucrative advantages, the major setback for SPIF process is its higher fabrication time for which the productivity of the component drastically reduces. Furthermore, it has been observed that the formability during SPIF process is dependent on the forming tool diameter, the feed rate of the tool, step size, wall angle of the formed component, material properties, lubricant condition and tool path design etc.10–12 In this regard, several optimization techniques were proposed to improve the productivity and formability during SPIF process.13–16
Aluminium sheets are popular for their widespread applications in fabricating various three-dimensional sheet metal components including auto-bodies, aircraft parts, pressure vessels, shipping and packaging industries etc.17–20 The SPIF process of aluminium sheet metal is of great interest among the sheet metal researchers as it enhances the formability at the room temperature due to suppression of localized necking. 21 In this regard, Box–Behnken design (BBD) technique was implemented to optimize the SPIF input process parameters in order to improve the formability of sheet material. Also, Kurra et al. 22 used BBD technique to optimize the surface roughness of the sheet metal during SPIF process.
Post-deformation studies such as microhardness and surface roughness offer a reliable inspection tool to detect the quality of the deformed component.23–27 During SPIF process, the incremental steps lead to progressive changes in plastic flow across the component, which can accumulate risk of unsatisfactory performance during the application. For this reason, microhardness and surface roughness profile analysis at different locations of SPIF truncated cone are essential. Najafabady and Ghaei 28 investigated microhardness across the complete profile of SPIF component and reported an increasing trend of the hardness profile from the base point to topmost point of the SPIF component. The increase in hardness occurred due to higher work-hardening in the material during deformation. It is well known that the microstructure and texture are highly deformation-dependent and are likely to change with the amount of plastic strain accumulation. 29 Park et al. 30 investigated the strain evolution during the differential rolling technique, and an attempt was made to correlate the textural properties such as grain angle boundaries, orientation distribution function (ODF) and misorientation angles with strain evolution of the deformed material. It is noteworthy that the surface quality of the deformed components is influenced when the material is subjected to larger strains. 29 Osakada and Oyane 31 found that surface roughness increased with progressive accumulation of plastic strain. Their study concluded that the roughening of the deformed surface accounted for the spin or rotation of grains, which was dependent on the crystal lattice of the material. In spite of enormous efforts in the past, the complete study regarding SPIF process linking surface roughness, crystallographic orientation and textural evolution was paid limited attention.
In this work, a laboratory scale SPIF setup was developed, and the response surface methodology (RSM) technique was performed to optimize the input parameters. Also, hardness and strain distribution at various locations of the optimized conical cup were analyzed. Consequently, the fracture strain and stress triaxiality were estimated using Hill48 anisotropic yield model. Finally, surface roughness evolution in the SPIF truncated cone was correlated with microtexture.
Materials and methods
As-rolled 0.7 mm thin sheets of AA6061 alloy were machined to the required dimensions (170 × 170 mm) for SPIF test. The investigated sheet material is precipitation hardening alloy containing aluminium, silicon and magnesium as major alloying elements. Uniaxial tensile test was conducted along rolling direction (RD) of the sheet metal with a crosshead velocity of 2 mm/min. Different mechanical properties such as yield strength, ultimate tensile strength and total elongation till fracture were found to be 171.27 MPa, 194.18 MPa and 10%, respectively. The Hollomon hardening law,
SPIF experimental setup
An experimental setup was developed to perform the SPIF test on the AA6061 thin sheet metal. The experimental setup consisted of the backing plate, blank holder and hemispherical tip forming tool. The fabricated setup was attached to a three-axis CNC milling machine (PCNC 1100 CNC mill) through a tool holder as depicted in Figure 1(a). The close-up image of the experimental tooling arrangement is presented in Figure 1(b). The sheet metal was tightly fastened between the backing support plate and blank holder as shown in the schematic arrangement of the SPIF tooling in Figure 2(a). The sheets were screwed into the mould to prevent the drawing of the sheet metal and development of wrinkling defects during the deformation process. Three forming tools with different hemispherical tip diameters were used in this study as shown in Figure 2(b). A mirror was kept beneath the designed fixture (Figure 1(b)) to identify the initiation of fracture in the specimen and consequently to stop the experiment.
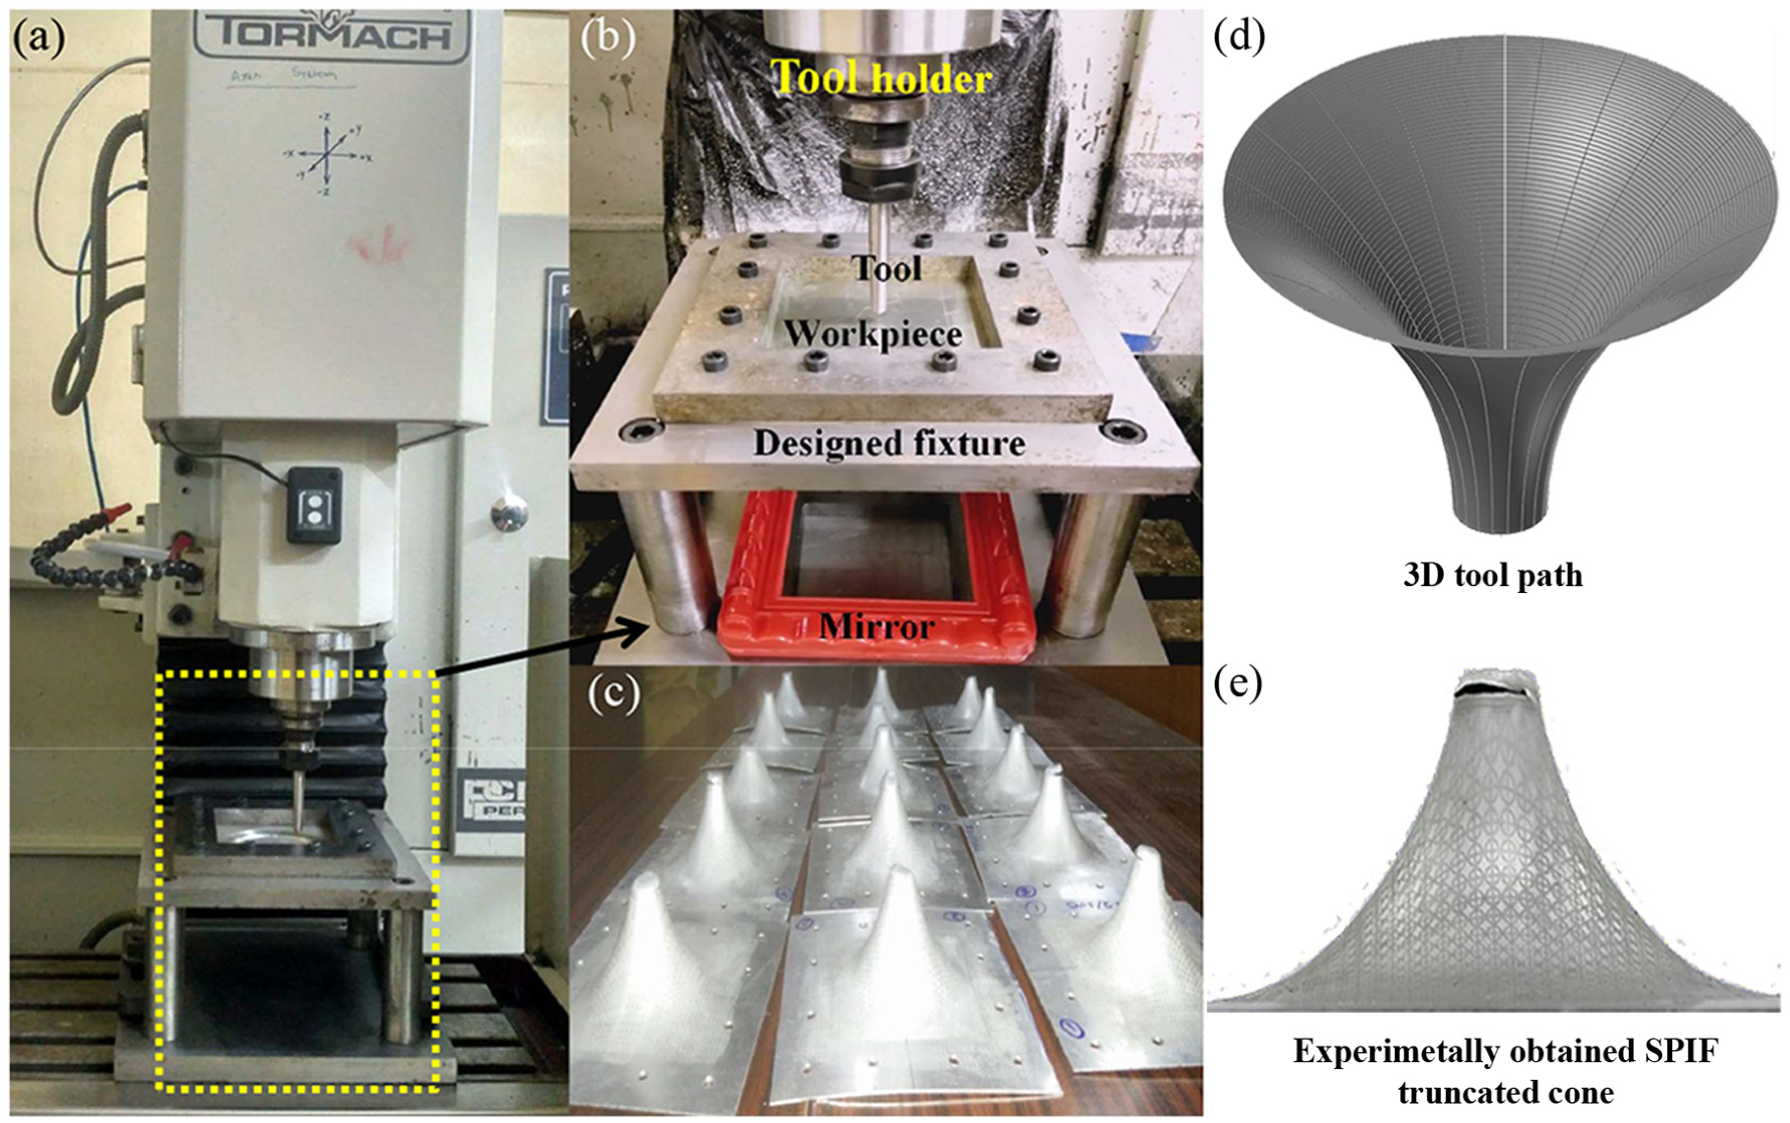
(a) SPIF experimental setup, (b) magnified view of the tooling arrangements, (c) 15 experimental cones according to the Box–Behnken design matrix, (d) 3D tool path generated through MasterCAM software and (e) geometric shape of a typical deformed cone.
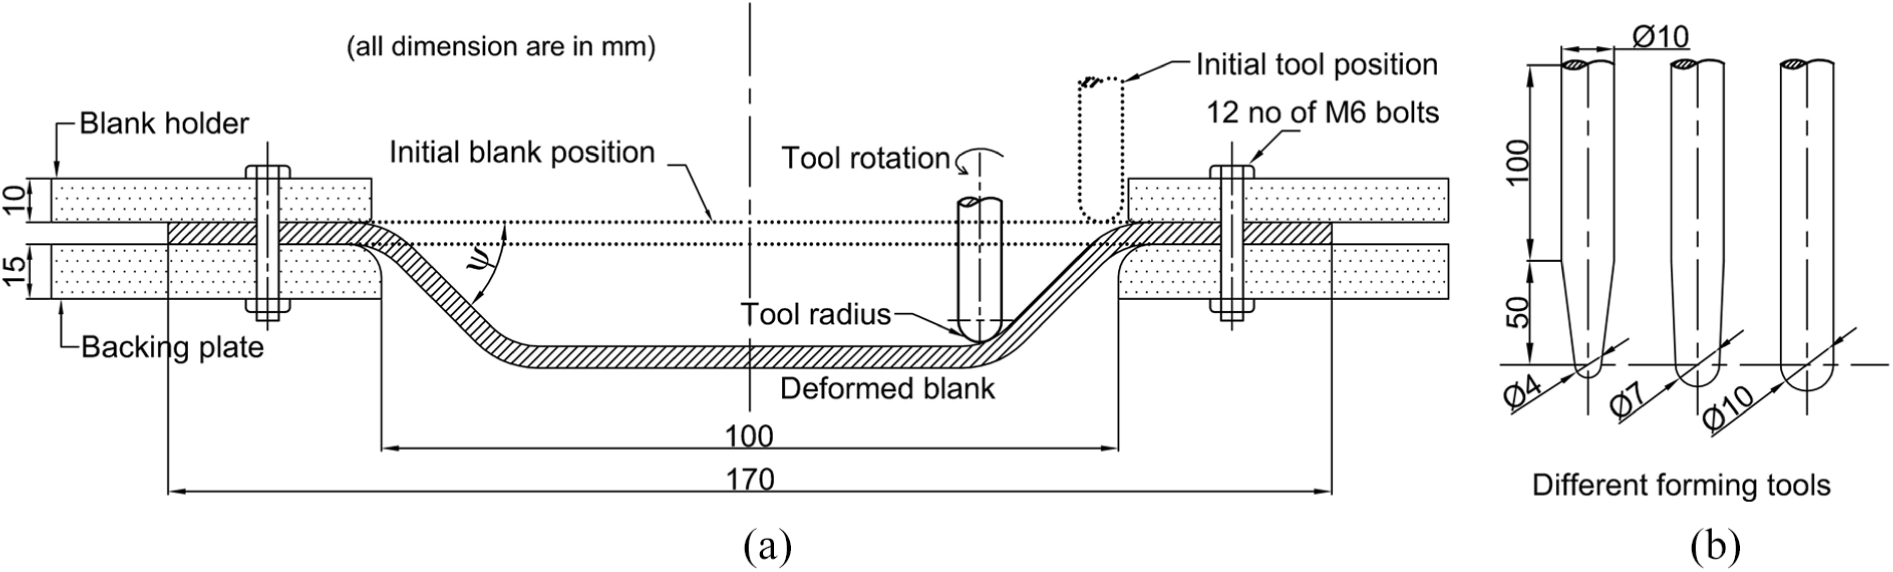
Schematic diagram of (a) SPIF test setup and (b) forming tool geometry with different tool tip diameter.
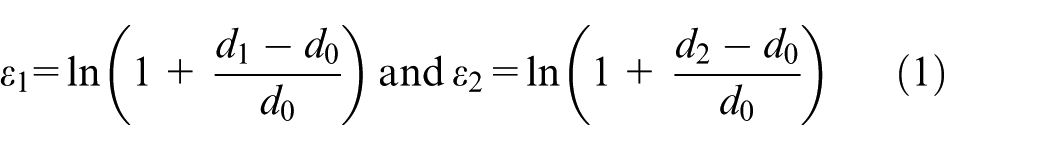
Fracture strain on the deformed hyperbolic truncated cone surface was measured using circular grid analysis (CGA) method.
33
In the CGA method, the surface of the undeformed blank was marked with circular grid of 2.5 mm initial diameter (
The rotating tool was moved on the surface of the work-piece in a predefined tool path using commercial software MasterCAM. Few initial trials were carried out, and spiral tool path was selected with a variable wall angle to produce axis-symmetric SPIF component. The adopted three-dimensional (3D) tool path is shown in Figure 1(d), and a typically deformed sample is shown in Figure 1(e) for better visualization of the geometric shape. For all the SPIF experiments, the spindle speed was kept constant at 2500 rpm. Also, the lubrication was provided on a blank surface before starting the SPIF experiments. Moreover, the amount of the step-down height of tool after each pass is defined as step size. The feed rate of the tool is described as tool velocity while it rotates over the deformable blank.
Response surface methodology
It was observed that there were several input parameters or factors such as forming tool diameter, step size, tool feed rate and wall angle etc. Which influenced the SPIF process.
22
The formability of a SPIF component increased with the reduction in tool diameter, whereas the same reduced with the increase in step size. For smaller tool diameter, there was a highly concentrated deformation zone which caused high strain accumulation and led to better formability. Hence, three significant input parameters, namely, tool diameter (A), incremental step size (B) and feed rate (C), were adopted in this work. Moreover, it is necessary to optimize input process variables before using SPIF component for further post-deformation study. In this work, optimization of the process variables was performed by implementing RSM technique available in MINITAB (version 16) statistical software. The output response (Y) can be described as per equation (2) for k number of independent variables of X (
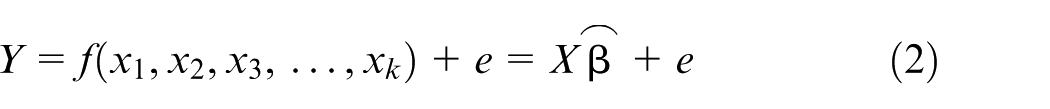
Where,
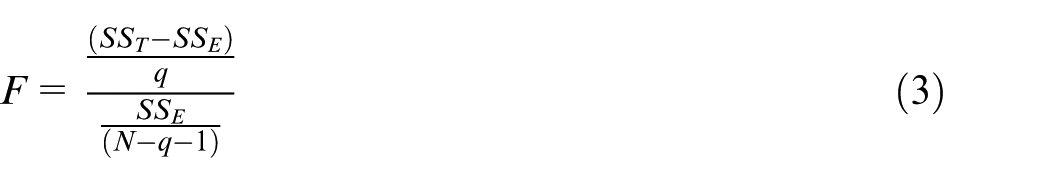
Here, N represents the total number of runs and q is the total non-consist terms or predictors. The expressions of
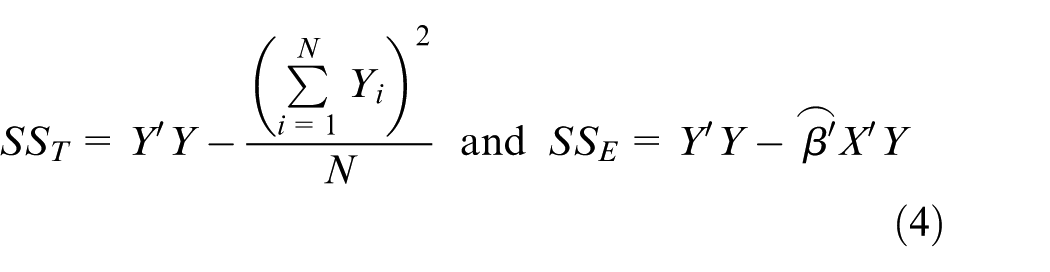
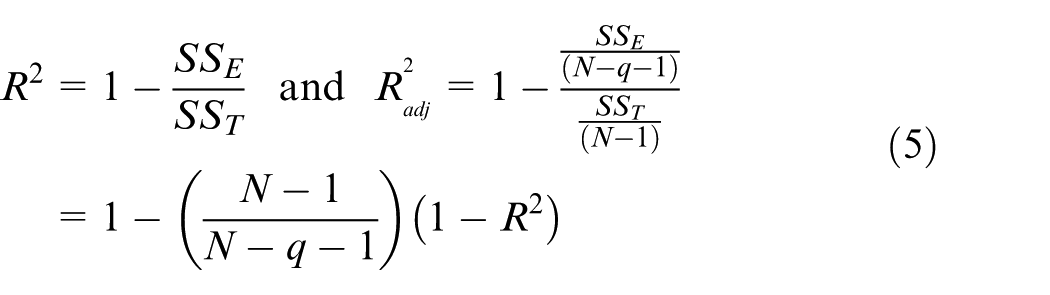
The coefficient of determination
In this work, the correlations among the input process parameters were successfully established with the help of RSM technique. Two most efficient RSM designs which have been used extensively for fitting quadratic models are central composite design (CCD) and BBD.
35
The CCD technique is based on
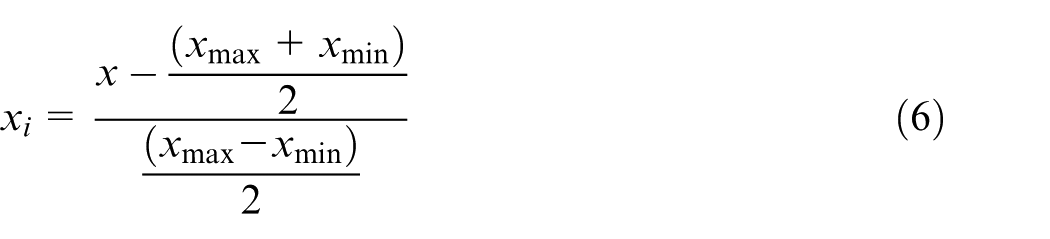
Here,
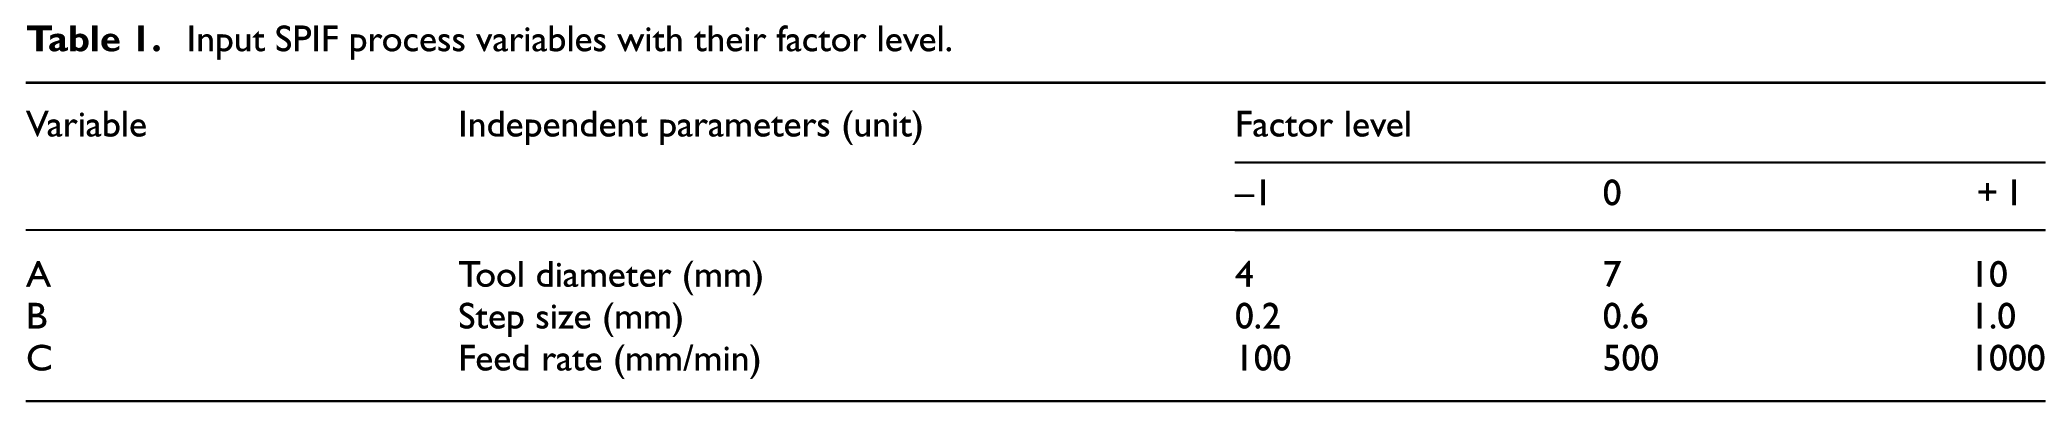
Input SPIF process variables with their factor level.
Design matrix with actual values and corresponding responses of the SPIF process variables with Box–Behnken design (BBD).
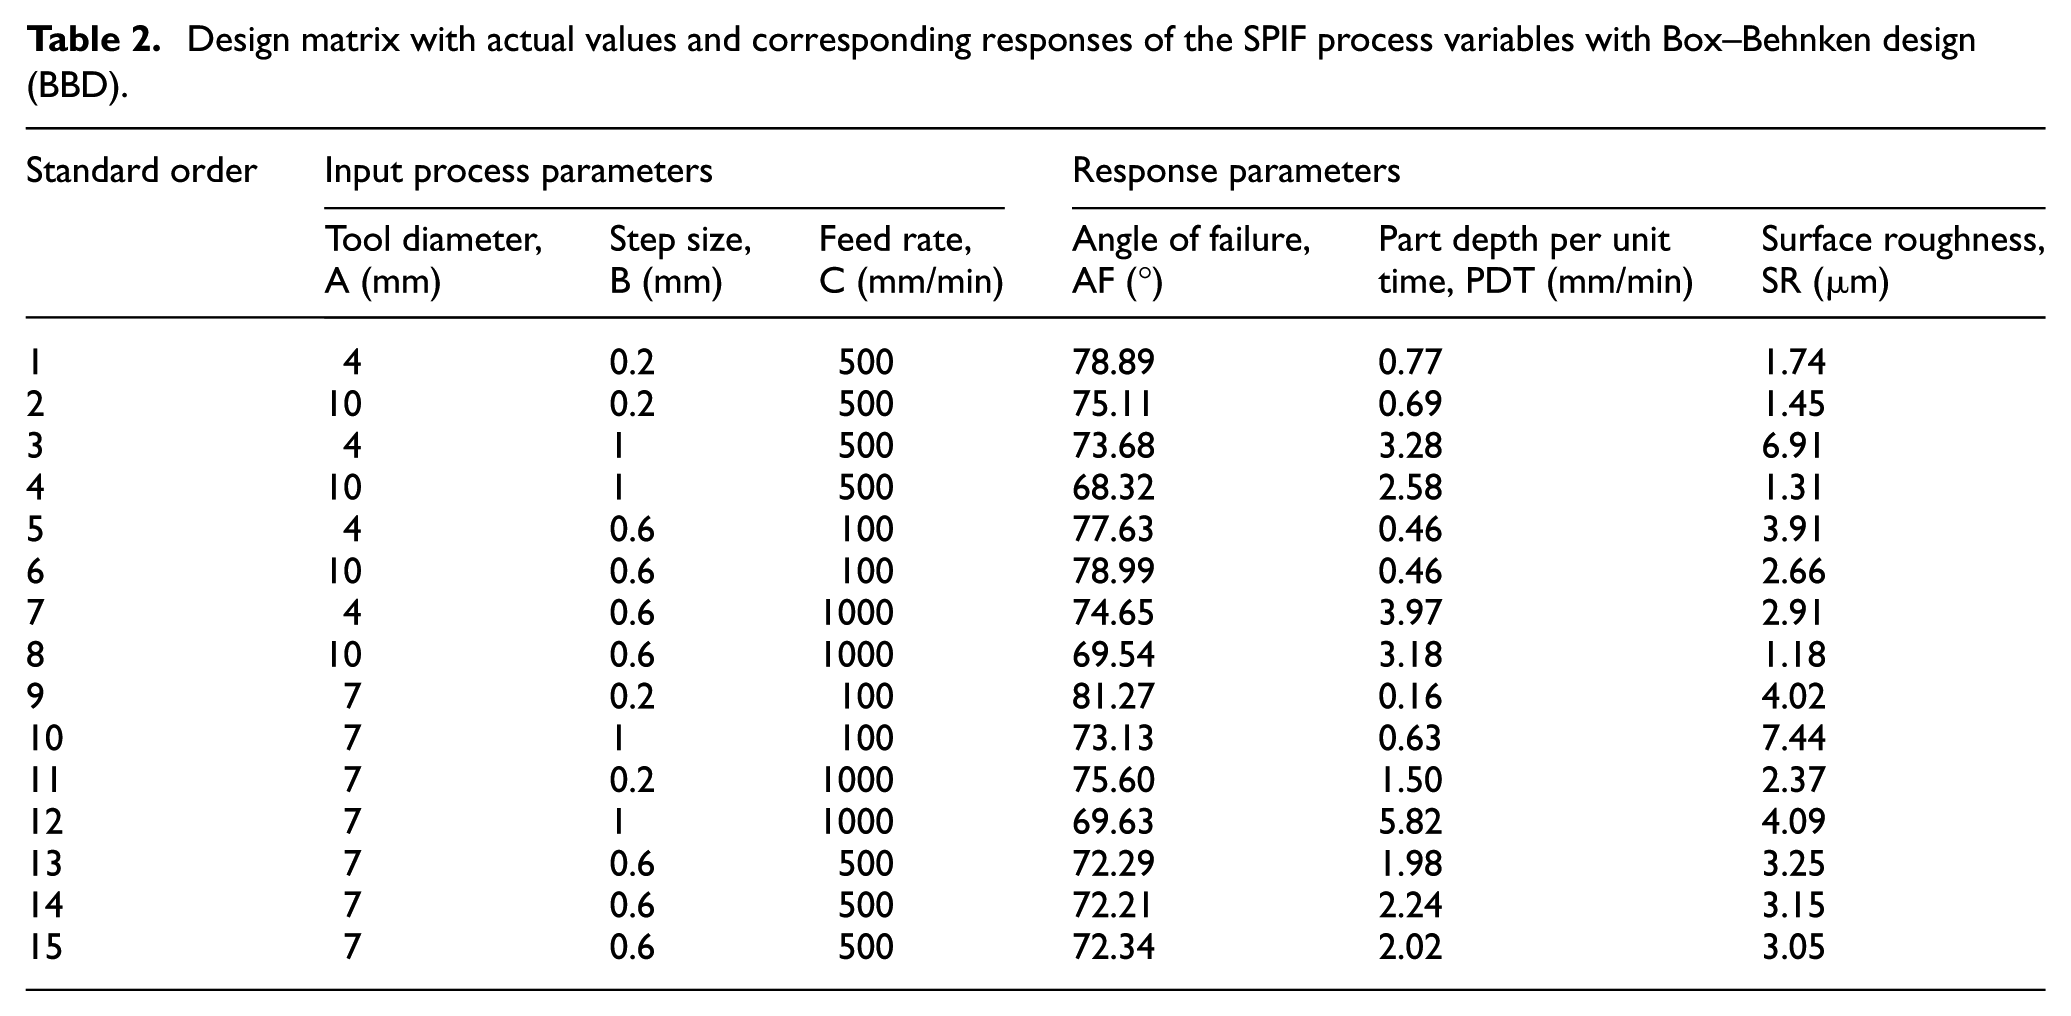
The experiments were stopped when the visible crack/fracture occurred on the surface of the deformed truncated cone. For each experimental condition, three different responses were measured from each fractured cone. These responses are the angle of failure (AF), part depth per unit time (PDT) and surface roughness (SR). Clearly, if AF is more, then the part depth is more which indicates a high formable SPIF condition. PDT is defined as the ratio of the height of the fractured cone to the total duration of the forming process. Clearly, a higher value of PDT indicates a higher dome height with comparatively less forming time, which is one of the objectives of the current optimization process. Also, lower surface roughness of the formed component is always desirable. A section was cut at a distance of 5 mm from the fracture location of the each SPIF truncated cone, and the areal surface roughness was measured using a 3D non-contact profiler.
Microhardness and microtexture
Microstructural analyses at different major strain levels of optimized SPIF truncated cone were done to correlate the mechanical responses with the metallurgical aspects. The samples from different locations of optimized SPIF truncated cone were cut along RD-TD plane and mounted using copper conductive powder. Furthermore, the mounted samples were polished mechanically using SiC papers of decreasing granulometry, and diamond paste (3 μm) was used prior to colloidal silica (1 μm) polishing. The specimens were then electrochemically etched using A2 electrolyte for 20 s at 31 V. The A2 electrolyte is a solution comprising of 78 mL perchloric acid, 90 mL distilled water, 730 mL ethanol and 100 mL of butoxyethanol. Furthermore, ultrasonic cleaning with ethanol was finally done on the electrochemically etched samples before placing them in the field emission scanning electron microscopy (FESEM). The electron back scattered diffraction (EBSD) technique was used to acquire the orientation imaging.
In order to comprehend the quality of the optimized SPIF component, the microhardness test was carried out. The tests were conducted using a Vickers indenter with 100 gf load for a dwell time of 15 s. After the tests, the integrated microscopic device was used to calculate the surface area of indentation by multiplying the diagonal length of the rectangular shaped impression, and Vickers hardness number (HV) was estimated. At each location, 15 repetitive measurements were carried out to obtain the average hardness value, and error bar along the Y axis at the respective location was evaluated.
Results and discussion
Analysis of variance
Output responses were measured from all the 15 experiments as shown in Table 2. All the 15 deformed SPIF hyperbolic truncated cones are shown in Figure 1(c). One-way and two-way interaction effects were plotted for AF response in Figure 3. From Figure 3(a), it can be inferred that AF was significantly influenced by the step size (B) and least affected by the tool diameter (A). It can also be observed that the AF reduced with the increase in the tool diameter (A), step size (B) and feed rate (C). In general, AF, which represents the formability of the sheet metal, reduces with the increase in the tool diameter. For larger tool diameter, the tool-workpiece contact zone becomes larger which increases the amount of contact force resulting in the early failure of the sheet metals. Similarly, with the increase in the step size (B), the equivalent plastic strain increases rapidly which is responsible for the quick failure of sheet. In similar fashion, increasing the feed rate (C) leads to a non-uniform deformation in the sheet material leading to sudden failure. Also, from the interaction plots (Figure 3(b)), it was evident that the interaction of tool diameter (A) with step size (B) and feed rate (C) had prominent effect on AF. Moreover, the formed component failed early with higher tool diameter, higher step size and higher feed rate which on contrary reduced the AF. A similar plot can also be constructed for PDT and SR responses as well. However, a detailed mathematical ANOVA analysis was conducted to quantify these variations.
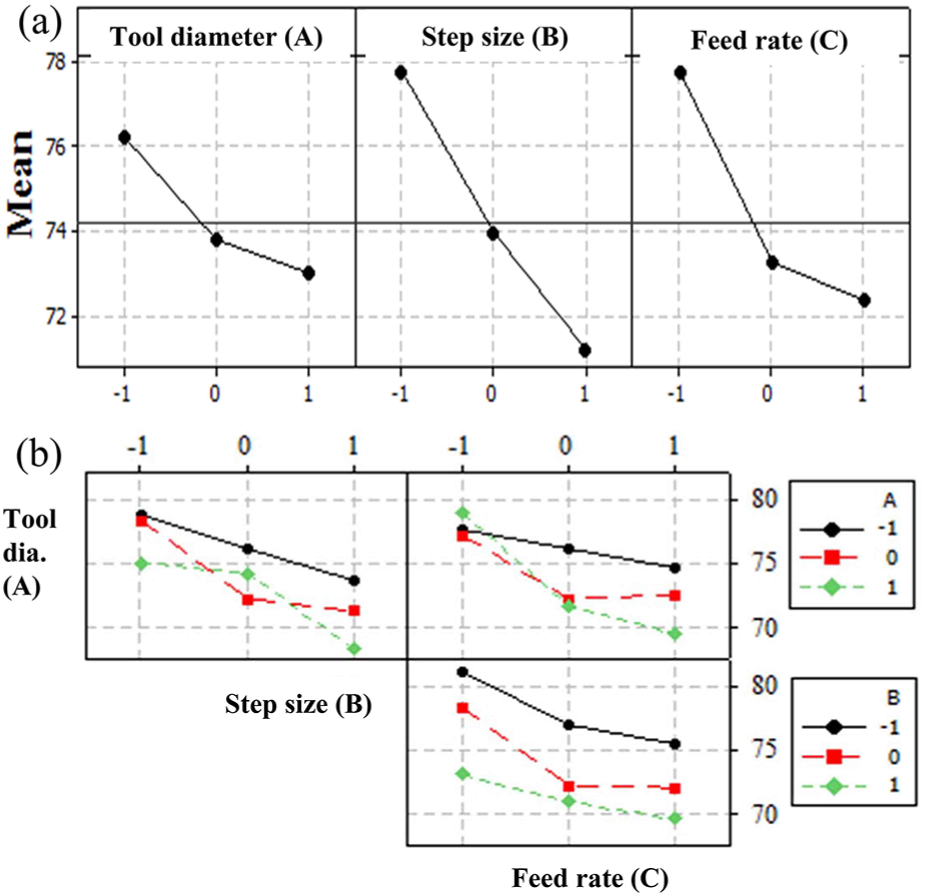
(a) One way and (b) two-way interaction effects of the input parameters on AF response.
ANOVA is a group of statistical tools used for estimation and comparison of the variation in the responses caused by the different levels of factors (k) and random errors in measurement of the output variables. The ANOVA table with degree of freedom (DOF), sum of square (SS) value of the variables, F value and p value for AF, PDT and SR responses are listed in Table 3. It was evident from the table that all the statistical models were significant with the experimental data. The variables corresponding to
Analysis of variance (ANOVA) for AF, PDT and SR responses.
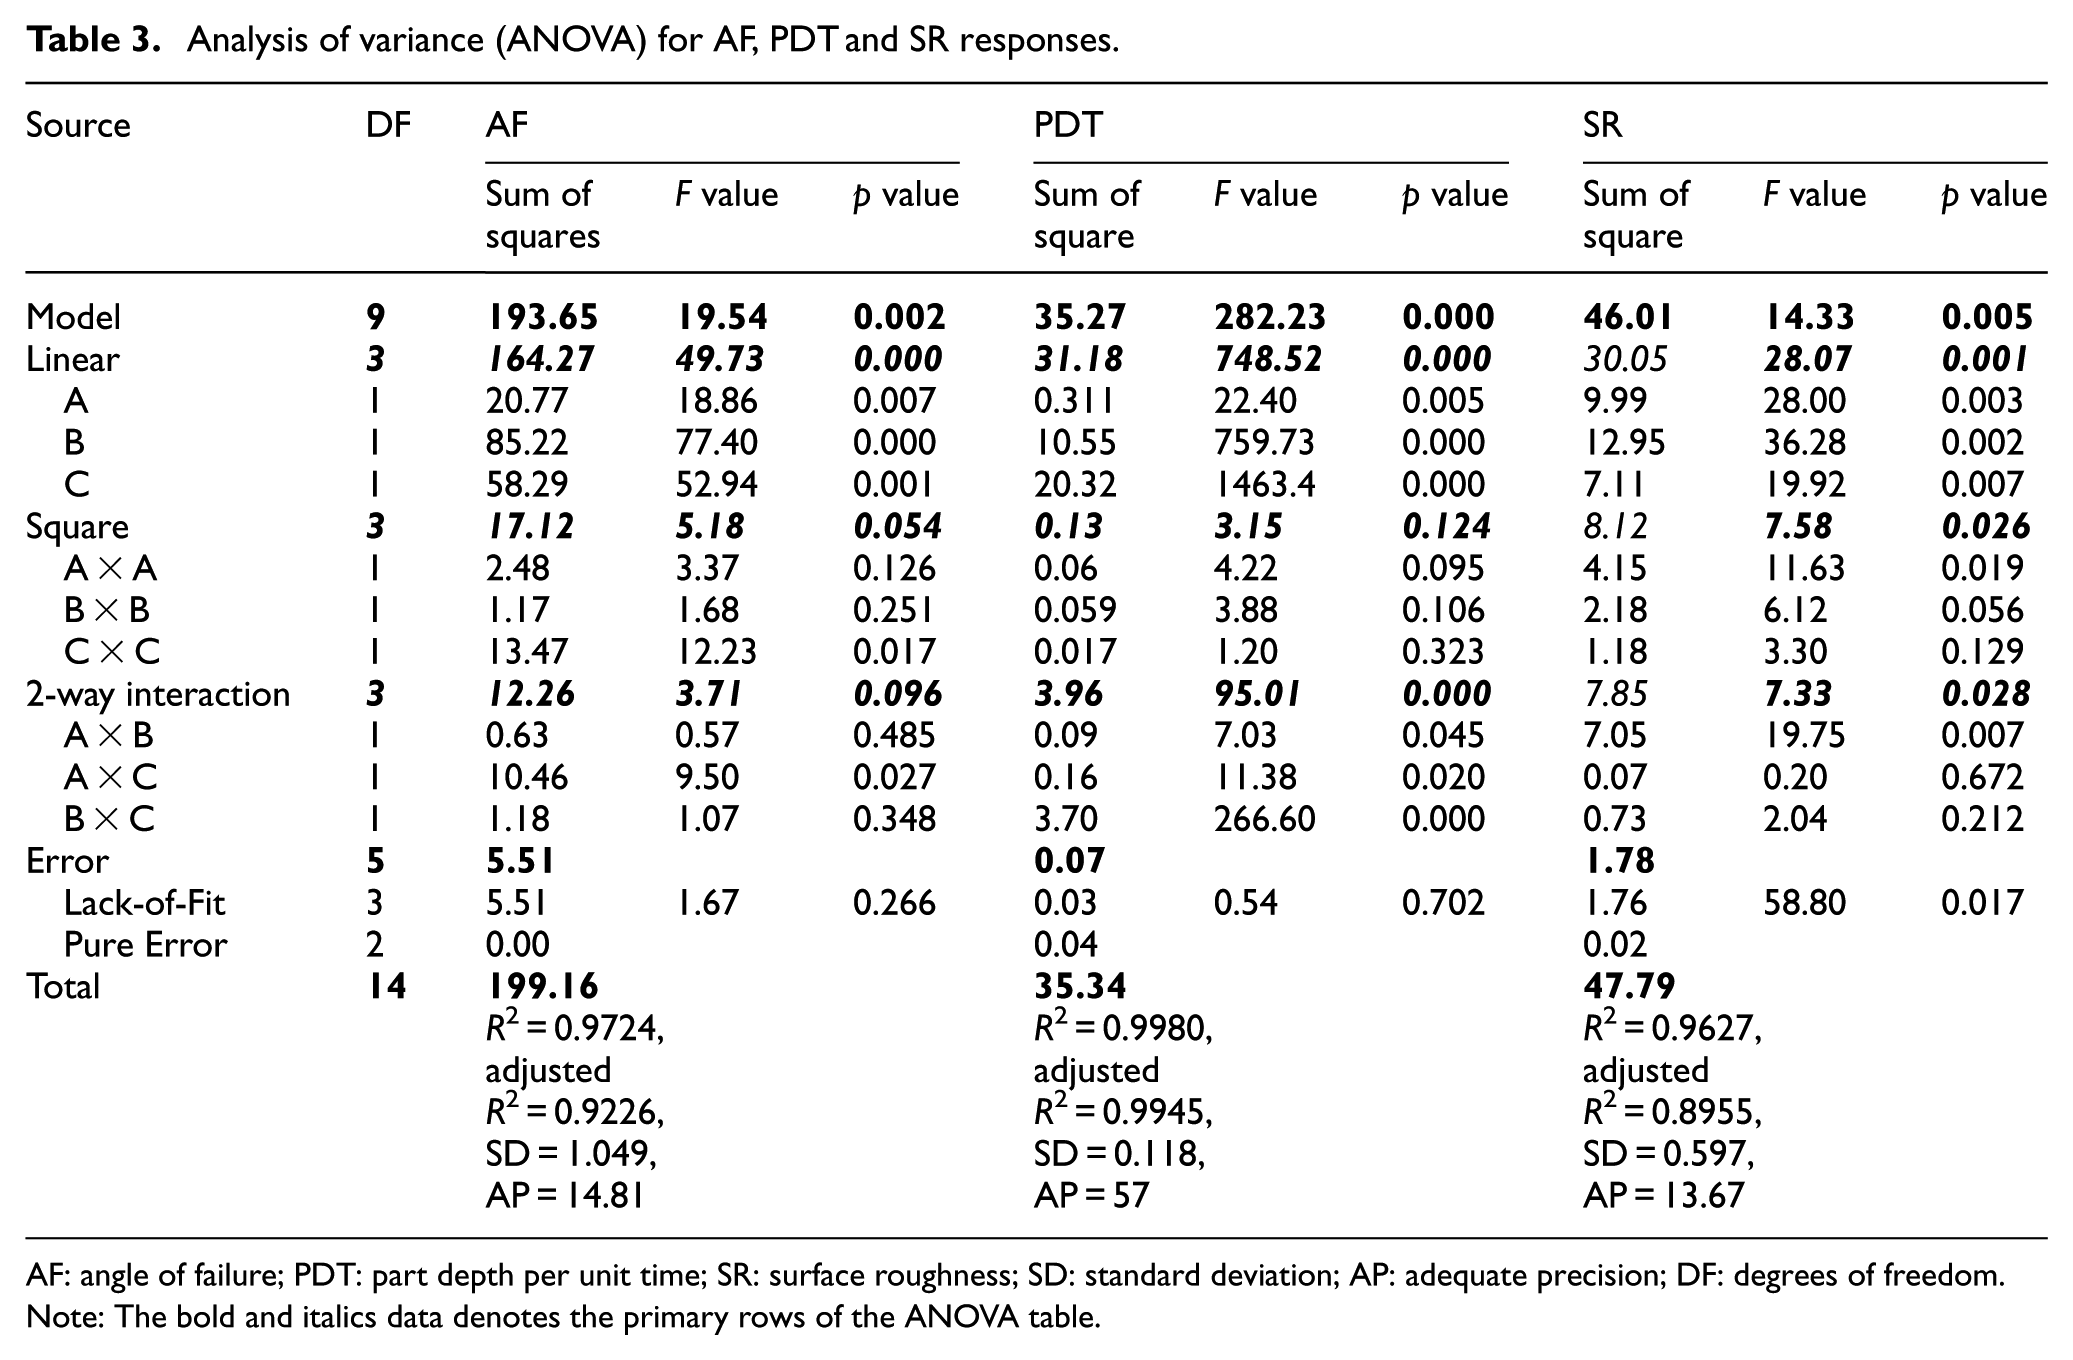
AF: angle of failure; PDT: part depth per unit time; SR: surface roughness; SD: standard deviation; AP: adequate precision; DF: degrees of freedom. Note: The bold and italics data denotes the primary rows of the ANOVA table.
Similarly, in PDT model, the primary effects
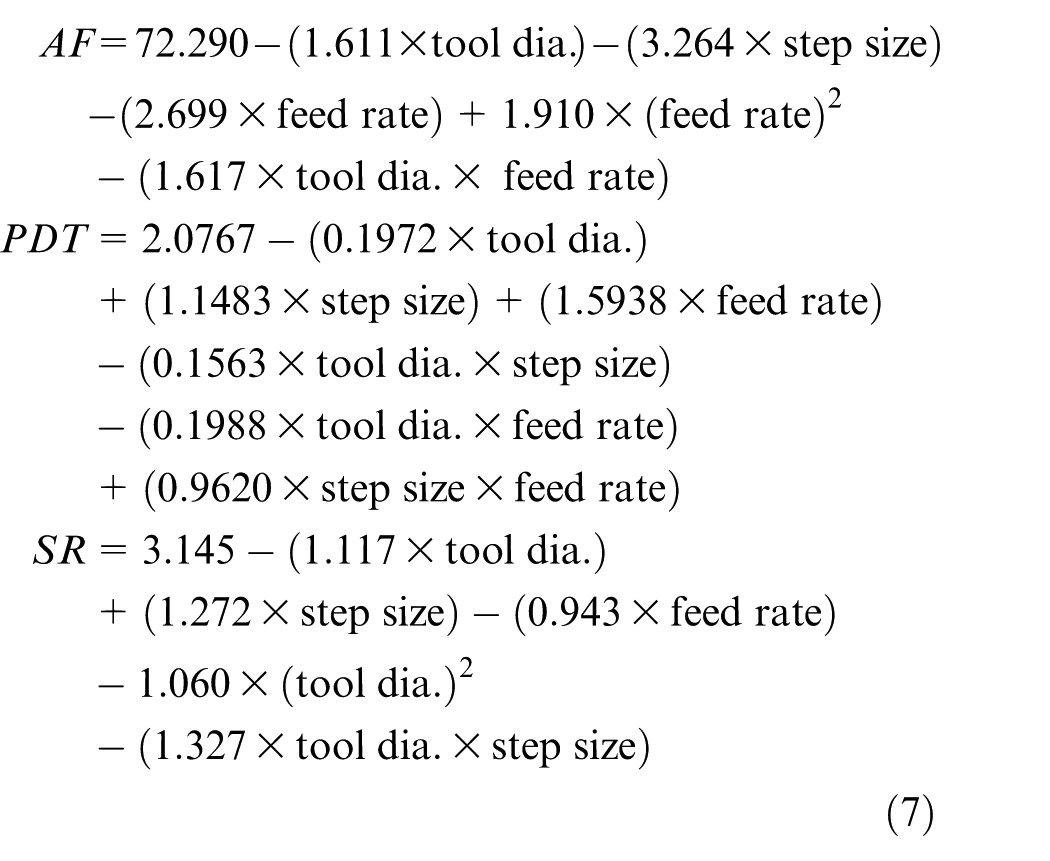
Graphical representations of the evaluated response surfaces are shown in Figure 4(a), 4(b) and 4(c) for AF, PDT and SR response, respectively. The 3D response surface is shown in top, and the corresponding 2D contour is shown just below of it for each response. Each contour of Figure 4 represents a combination of an infinite number of possible solutions of the two factors on the response. From Figure 4(a), it was observed that the AF was minimum with the highest tool diameter and feed rate. It is due to fact that the plastic deformation is rapid with higher tool diameter and feed rate, which leads to early fracture and reduces the AF of the formed truncated cone. However, the objective of SPIF test is to enhance formability of sheet metal, that is, to increase the AF. Similarly, part depth was always higher for a suitable process parameter combination. It required comparatively larger time to manufacture, and hence, the PDT was less for a good formable condition. From an industrial point of view, the PDT should be maximized for enhancing the productivity. From Figure 4(b), it can be concluded that the higher feed rate yielded a greater PDT. However, the higher step depth led to early fracture of the formed component and, hence, less forming time, which corresponds to high PDT. Figure 4(c) displays the variation of the SR with tool diameter and step size. At highest tool diameter, the SR also seemed to be within the tolerance limit, but an early fracture was observed on deformed truncated cone due to large plastic deformation which on contrary was not desirable. Also, it was evident that the lower tool diameter and lower step size was preferable for good surface finish of the formed product. The feed rate can be set on the higher side for increasing the productivity. Furthermore, optimization of SPIF test was carried out considering all these findings from response surfaces.
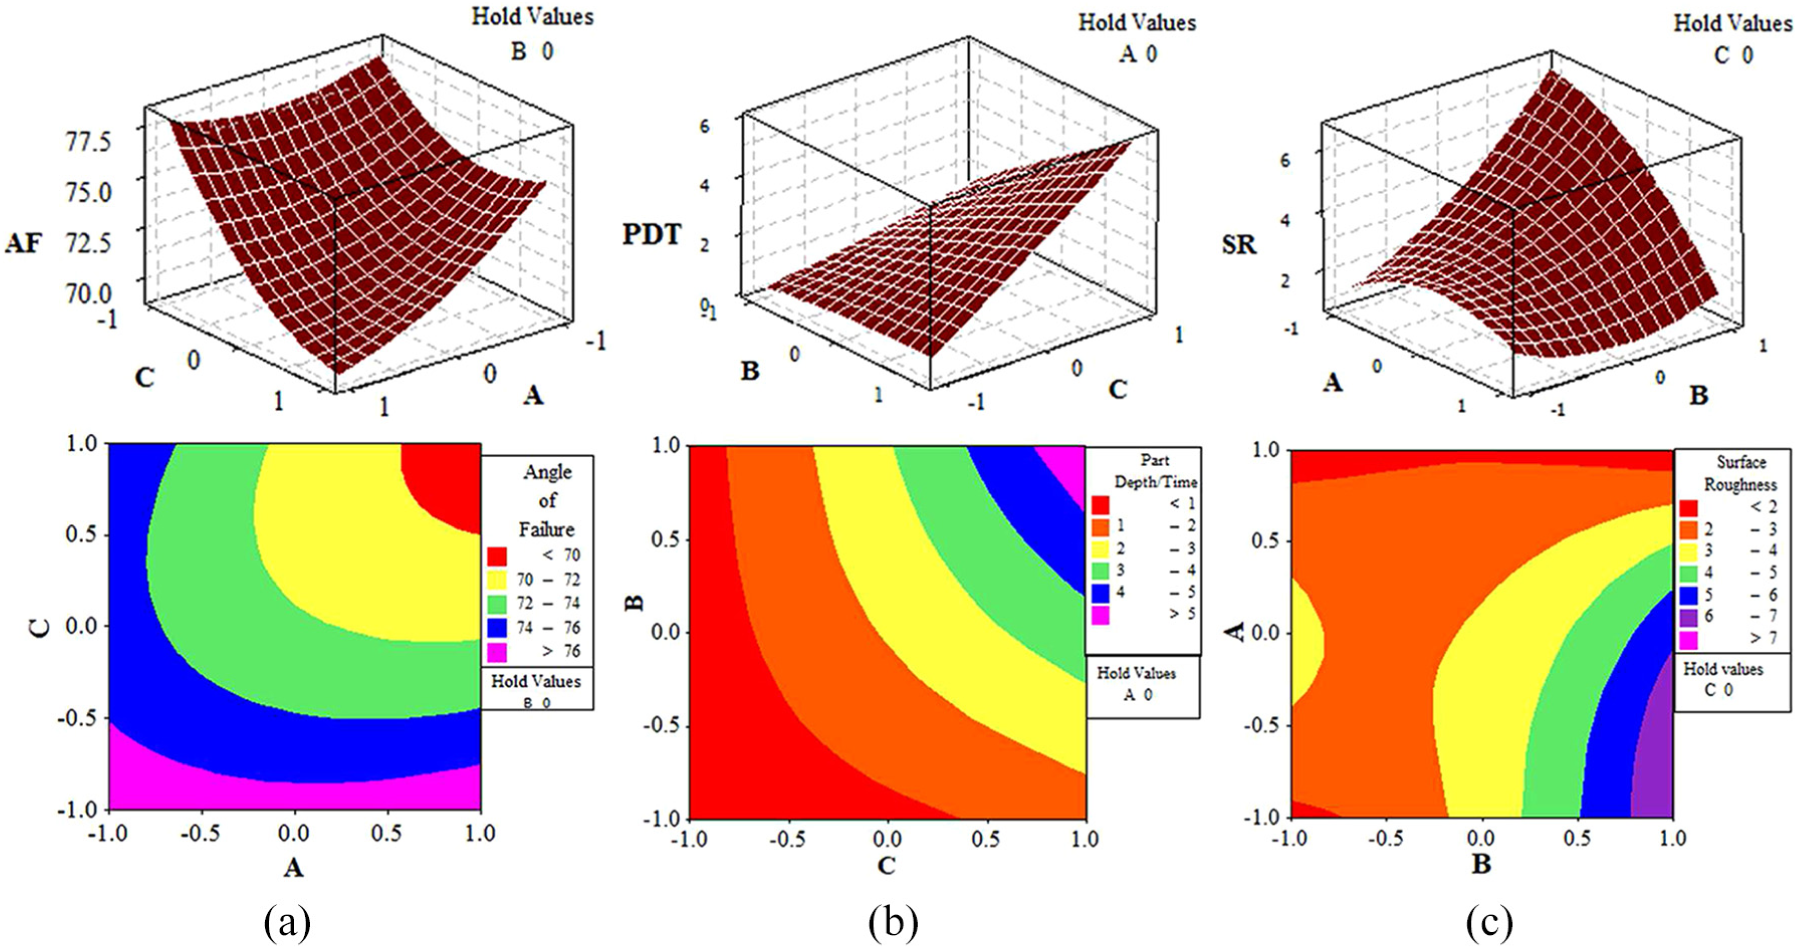
Three-dimensional response surface and corresponding contour plot for (a) AF, (b) PDT and (c) SR.
Optimization of SPIF process parameters
Before using these statistical models, adequacy checking of evaluated models was conducted using normality plots of the residuals and residual plots with the fitted value. The normal probability plot for AF response (Figure 5(a)) resembled a straight line, and this indicated that the errors followed normal distribution. No prominent outliner (residual greater than any other residual) was observed in the normality plot (Figure 5(b)) of the AF. Hence, residuals were absolutely structure less, that is, the residuals were not related to any other variable including the response predicted from the model. In the similar manner, response surface for other two responses was evaluated and adequacy checking was successfully performed. Consequently, these statistical models were further used to optimize the SPIF input process parameters.
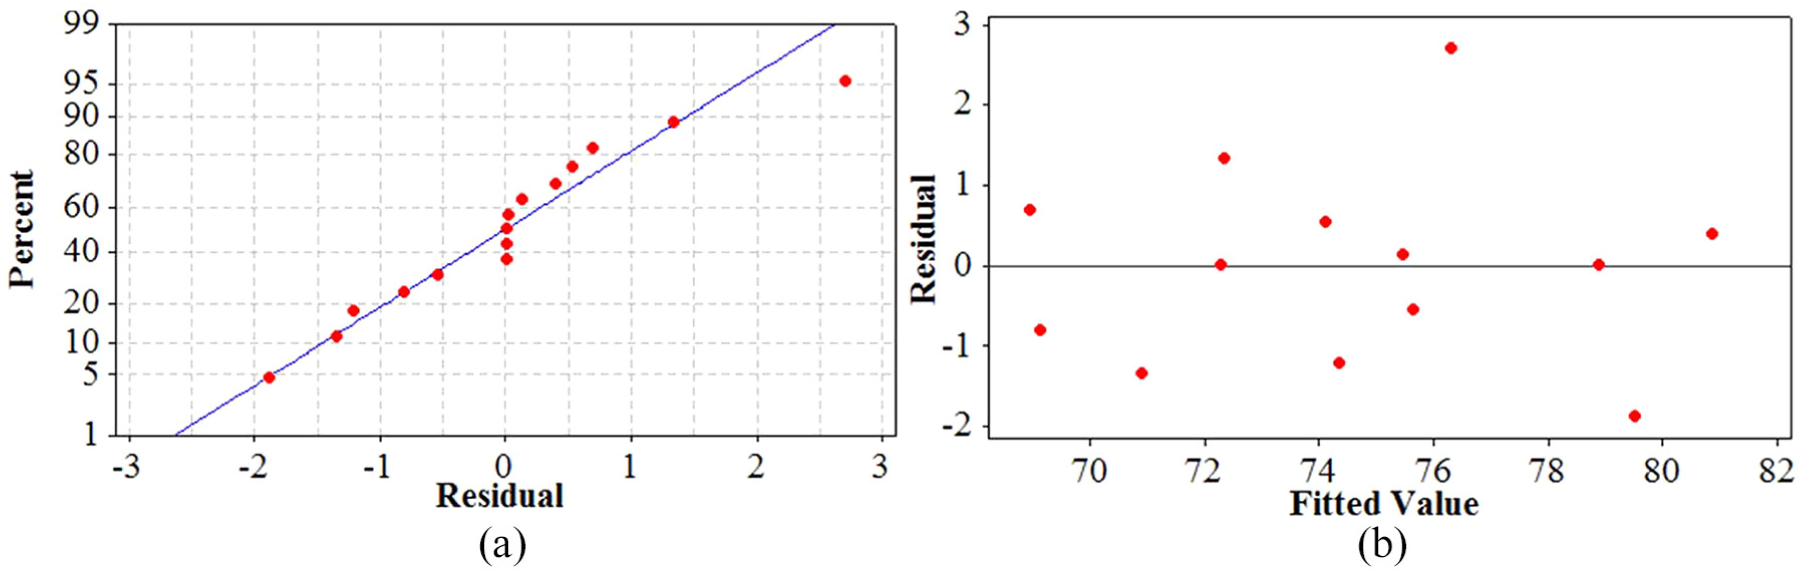
(a) Normal probability plot of the residuals and (b) variation of residual with fitted value for the AF response.
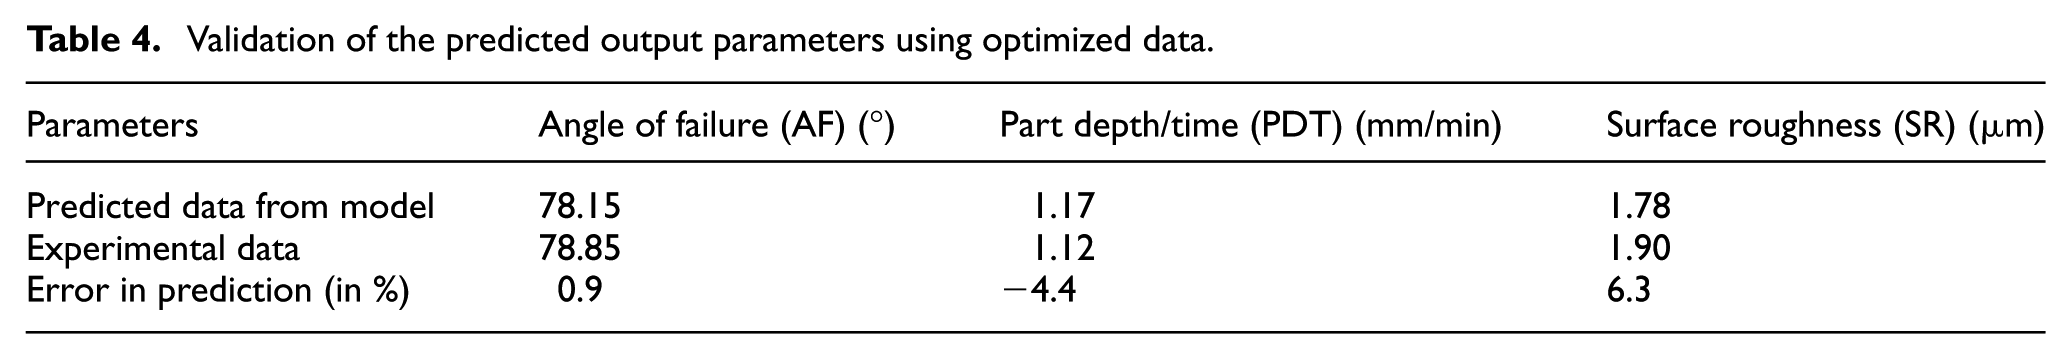
Furthermore, based upon the priority, different weightages were imposed to the responses SR, AF and PDT as 10, 1 and 0.1, respectively. After optimization, the most desirable SPIF process input parameters were found to be tool diameter 4 mm, step size 0.2 mm and feed rate 782 mm/min. The optimized responses were predicted with the evaluated regression model and, subsequently, validated with the experimental data. It was found that the SR had a comparatively smaller value of 1.9 µm with a high AF of 78.85° and moderate PDT of 1.12 mm/min. The error in prediction is listed in Table 4, and it was found that the regression model efficiently estimated the experimental data. Furthermore, post-deformation studies in terms of microhardness, strain distribution and areal surface roughness of optimized SPIF truncated cone were carried out.
Validation of the predicted output parameters using optimized data.
Surface strain distributions
To comprehend the thickness and surface strain distribution, four different locations were identified on the experimentally obtained SPIF truncated cone as represented in Figure 6(a). Also, the fracture morphology of deformed component was analyzed using scanning electron microscopy (SEM) as depicted in the inset of Figure 6(a). SEM fractographs revealed small and uniform dimples consistently evident throughout the fracture surface. This clearly showed that the fracture that took place was completely ductile in nature. However, it can be observed that fracture surface had some flat regions separated by distinct bright ridges claiming to be plane strain deformation mode.36,37
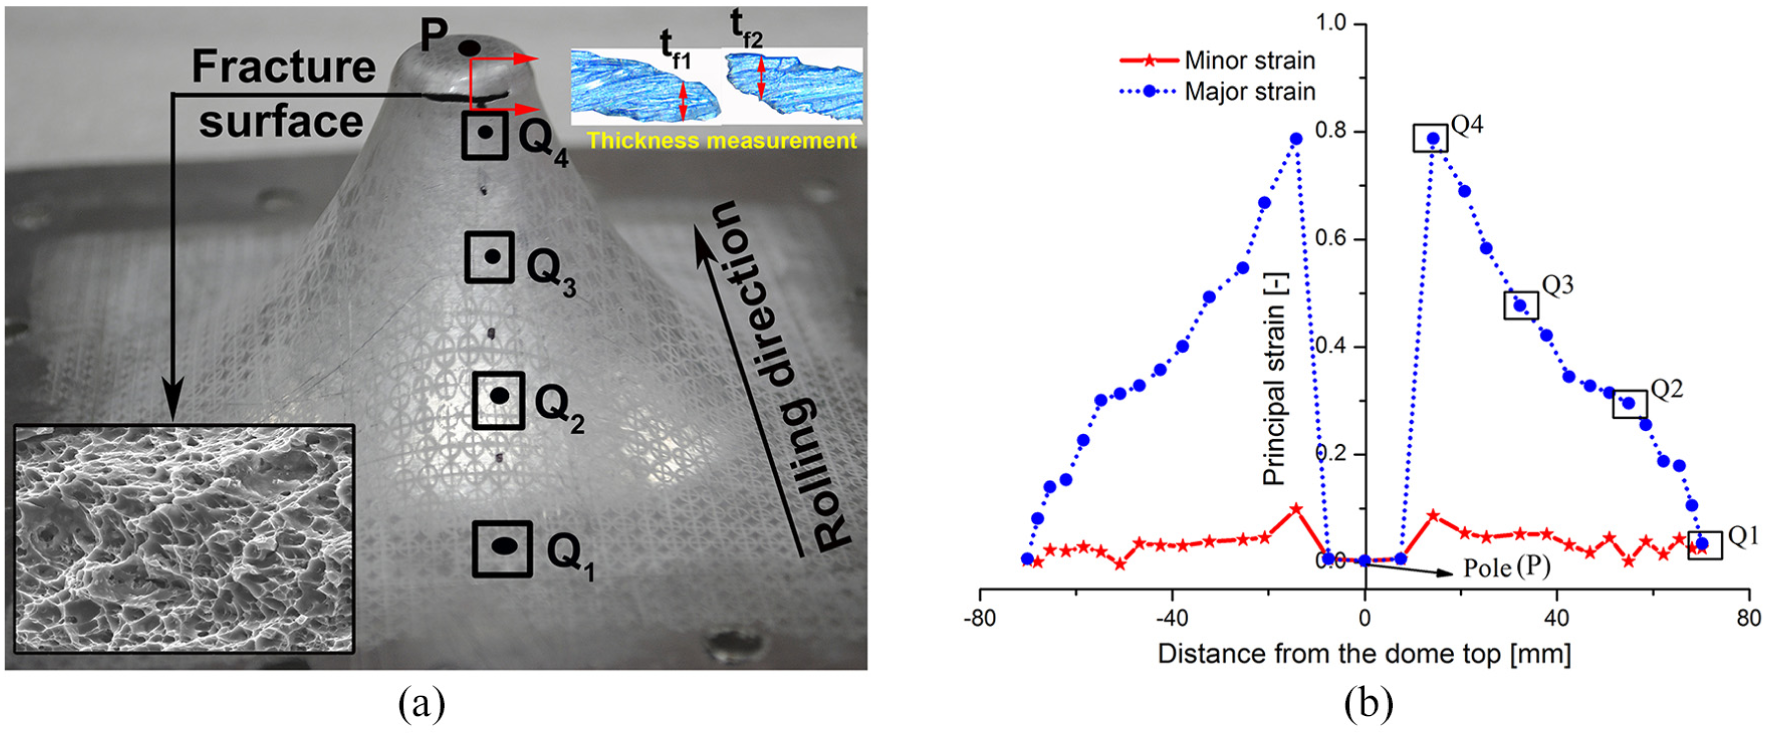
(a) Experimentally obtained optimized SPIF truncated cone showing different locations of post-deformation studies and the inset shows the fracture surface and thickness measurement technique and (b) surface strain plot at mentioned locations.
It was already discussed in previous studies that the major surface fracture strain (
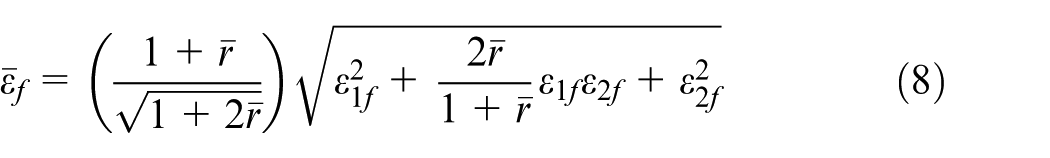
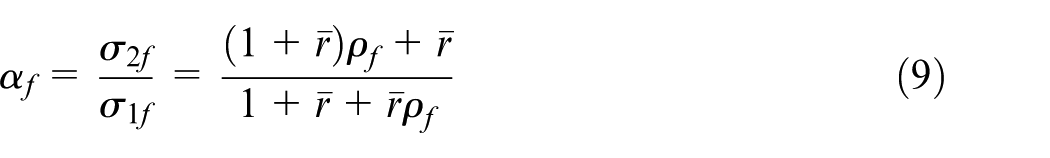
Fracture strain data also suggested that fracture was nearly in the plane strain deformation mode. The measured fracture strain provides a tentative estimation of fracture limit of AA6061 metal along plane strain condition. The fracture strain was converted into anisotropic triaxiality space (
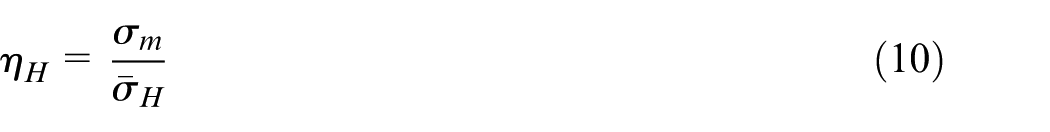
Here,
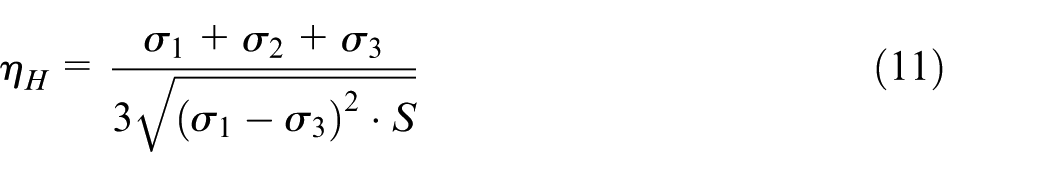
Where,
The major and minor diameters of deformed grids from pole location (P) were estimated along RD of the truncated cone. Subsequently, surface strains along two principal directions were calculated through CGA and were plotted in Figure 6(b). The strain distribution was symmetric across the pole. However, a strong non-uniform major strain distribution was observed on the deformed surface. The top flat portion of the cone remained undeformed, and hence, no strain was induced in that portion. The maximum major strain of 0.80 was induced in the wall (critical point) close to the top flat portion where the fracture was observed. Afterwards, a gradual decrease in major strain profile was recorded from the fracture location towards the base material along the inclined surface of the wall. This indicated a concentrated localized plastic deformation at the failure location compared to other portion of the blank.
Furthermore, the effect of plastic deformation on the microhardness at different location of the SPIF truncated cone was evaluated as shown in Figure 7. It was observed that hardness value had increased significantly with extent of deformation from Q1 to Q4. The microhardness profile exhibited a hardness peak at the critical location (Q4). This corresponded to the region of highest major true strain (0.80), and it was a consequence of increase in strain hardening. This clearly indicated that the material underwent microstructural change each time with the movement of the tool. Hence, the microtexture analyses at four pre-defined locations were carried out to comprehend the non-uniform strain distribution profile and hardness variation across the optimized SPIF truncated cone.
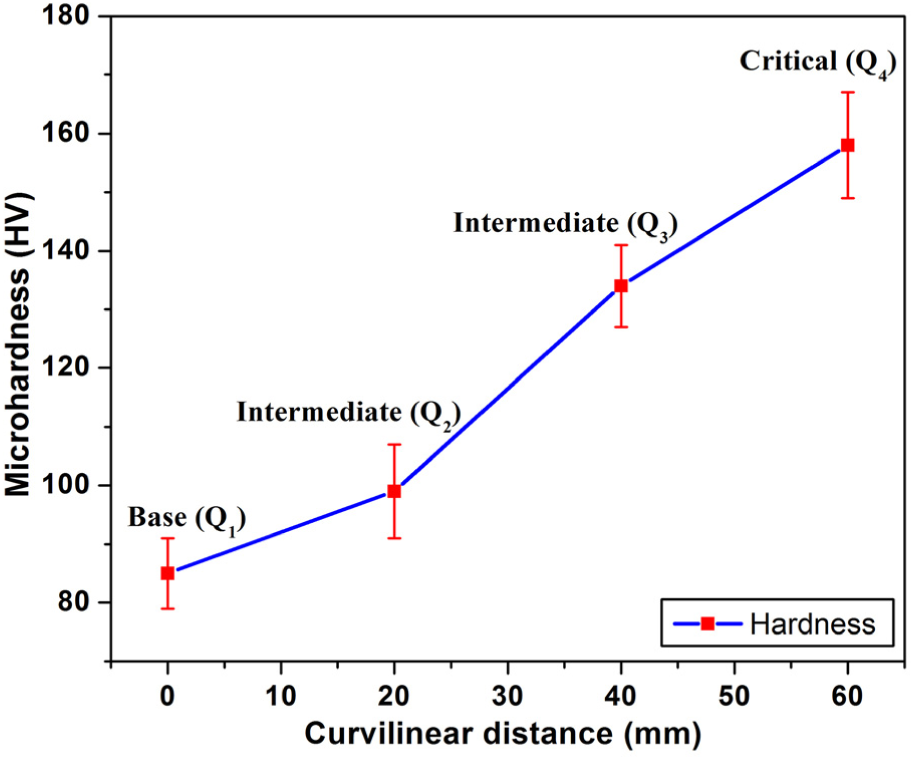
Microhardness plot with the location marked where microstructure analysis was carried out.
Microtexture evolution
EBSD allows assessing the grain boundary characteristic in the microstructure, that is, the angle of misorientation between the neighbouring grains. The measured grain boundary distribution map is presented in Figure 8. In general, misorientation angles less than 15° which are represented by both red and green lines signify the low angle grain boundaries (LAGBs), whereas the angle greater than 15° (blue coloured line) denotes the high angle grain boundaries (HAGBs). It is well known that with the increase in amount of deformation, the density of dislocations increases thereby reducing the spacing between the adjacent dislocations. Eventually, the dislocation cores (group of dislocations) will begin to overlap and break the ordered nature of the grain boundary. At this point, the boundary can be considered as high-angle and the original grain separates into two entirely different grains. At higher strain levels, the separation of grains increases which results in large volume fraction of HAGBs. The evaluated fractions at four predefined locations are quantified as presented in Figure 9(a). It was found that the HAGBs fraction increased drastically from Q1 to Q4 (approximately 250%), whereas the LAGBs showed the opposite trend. The critical point where high strain value (0.80 major strain) was experienced mostly had high HAGBs which might have caused severe disorder in the grain structure, and ultimately resulted in grain refinement. The occurrence of grain refinement was further plotted as average grain size at different major strain location as shown in Figure 9(a). It has been observed that the grain refinement through severe plastic flow is associated with high hardness value. A similar observation was found in the literature for aluminium alloy. 42
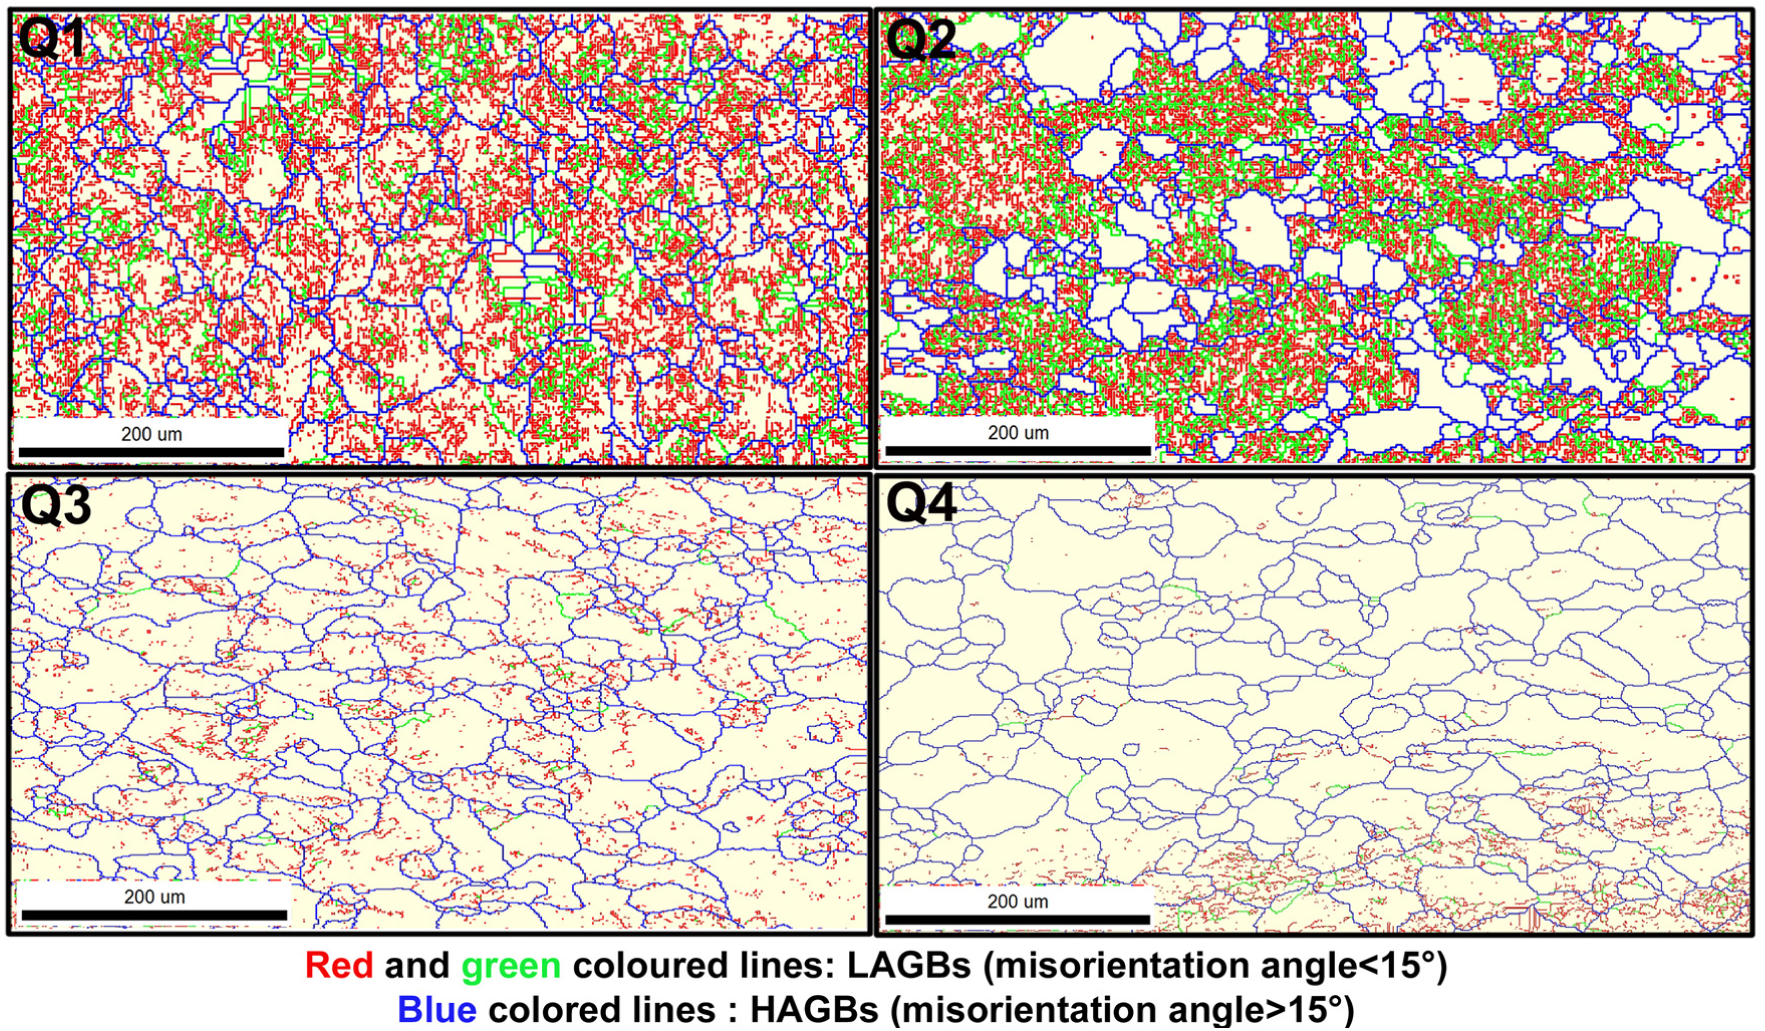
Grain boundaries maps at different location of optimized deformed truncated cone.
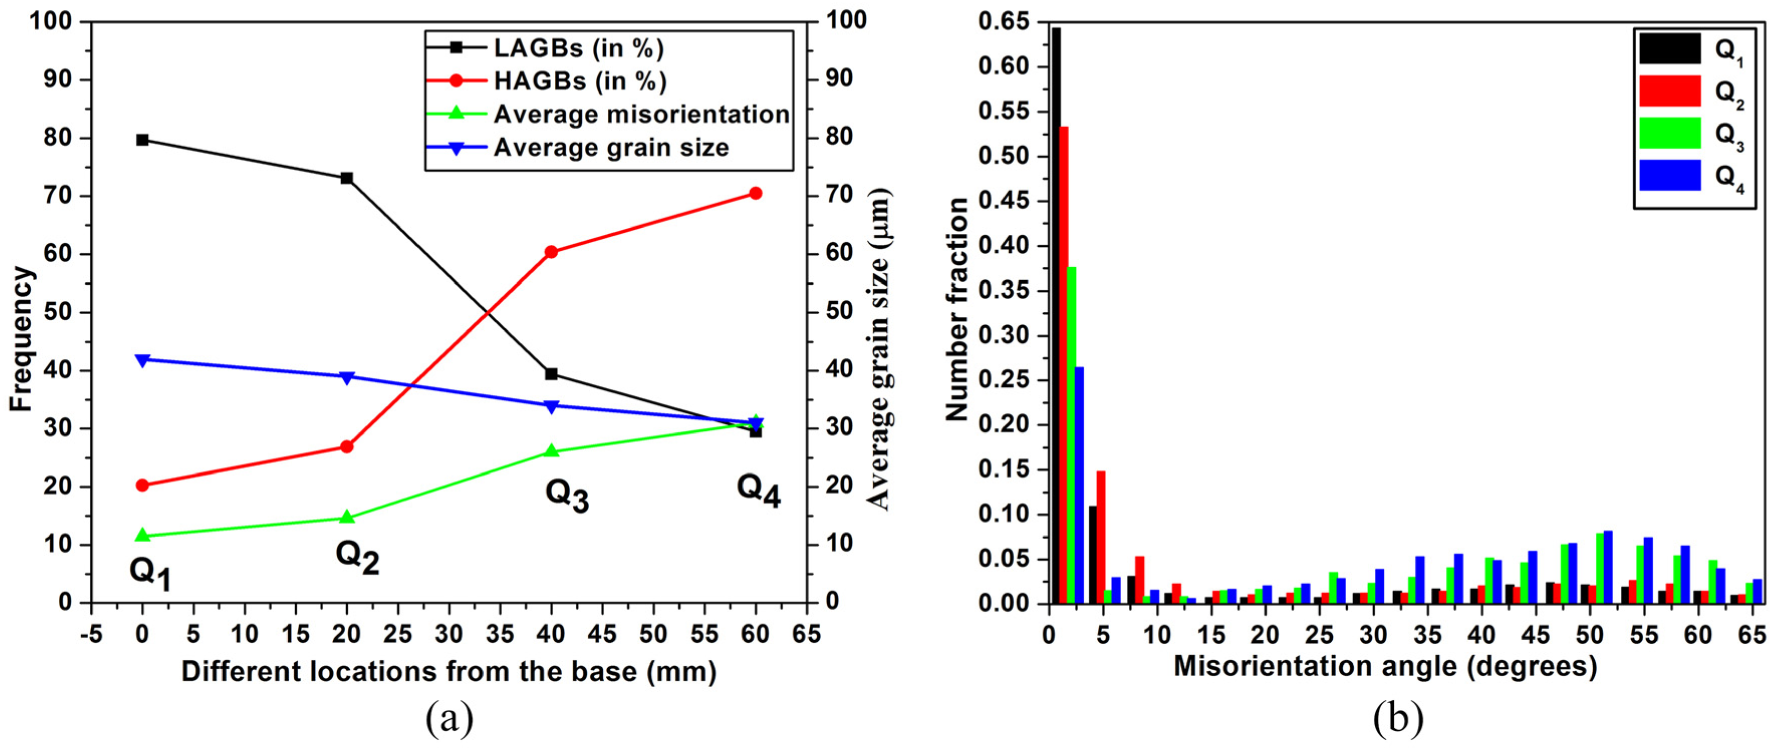
(a) Variation of microstructural parameters and (b) grain boundary misorientation angle distribution with the amount of deformation.
At lower strains, thick grain boundaries composed of a regular array of many partial dislocations (showed as LAGBs) contributed the unpleasant boundaries appearance whereas sharp and clear boundaries were formed at higher strain levels. The sharpness of the boundaries is highly dependent on the dislocation concentration and misorientation angle within the grain boundary.
43
The grain boundary misorientation histogram graph at predescribed locations is depicted in Figure 9(b). It was inferred from Figure 9(b) that the peak number fraction of misorientation angle diminished with the progression of plastic strain. The peak number fraction was found to be around 0.65 at the base (
Surface roughness
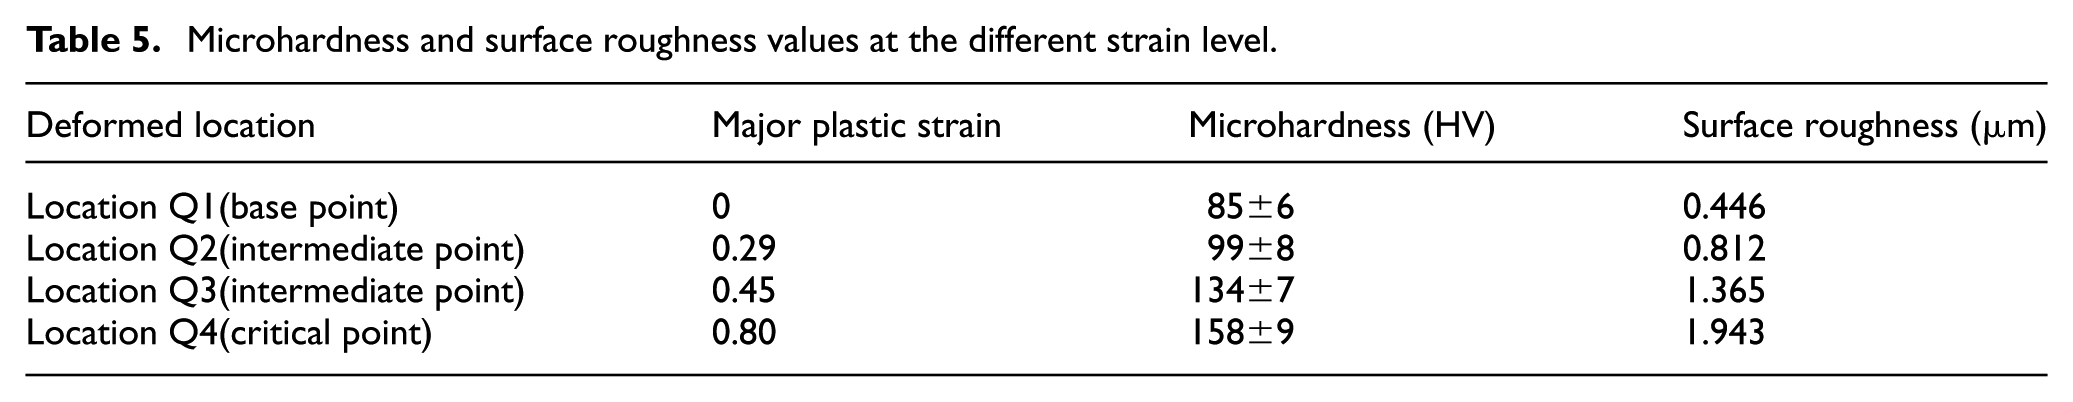
Furthermore, areal surface roughness was evaluated at the predefined location using Taylor Hobson 3D optical profilometer. The predefined locations Q1, Q2, Q3 and Q4 of the optimized truncated cone correspond to the major strain values of 0, 0.29, 0.45 and 0.80, respectively. Figure 10(a) shows the plot of areal surface roughness versus the surface major strain. The inset in figure represents the obtained 3D surface topography map at the predefined location of the truncated cone. It was observed that the Sa value increased significantly with progression of deformation from base condition (
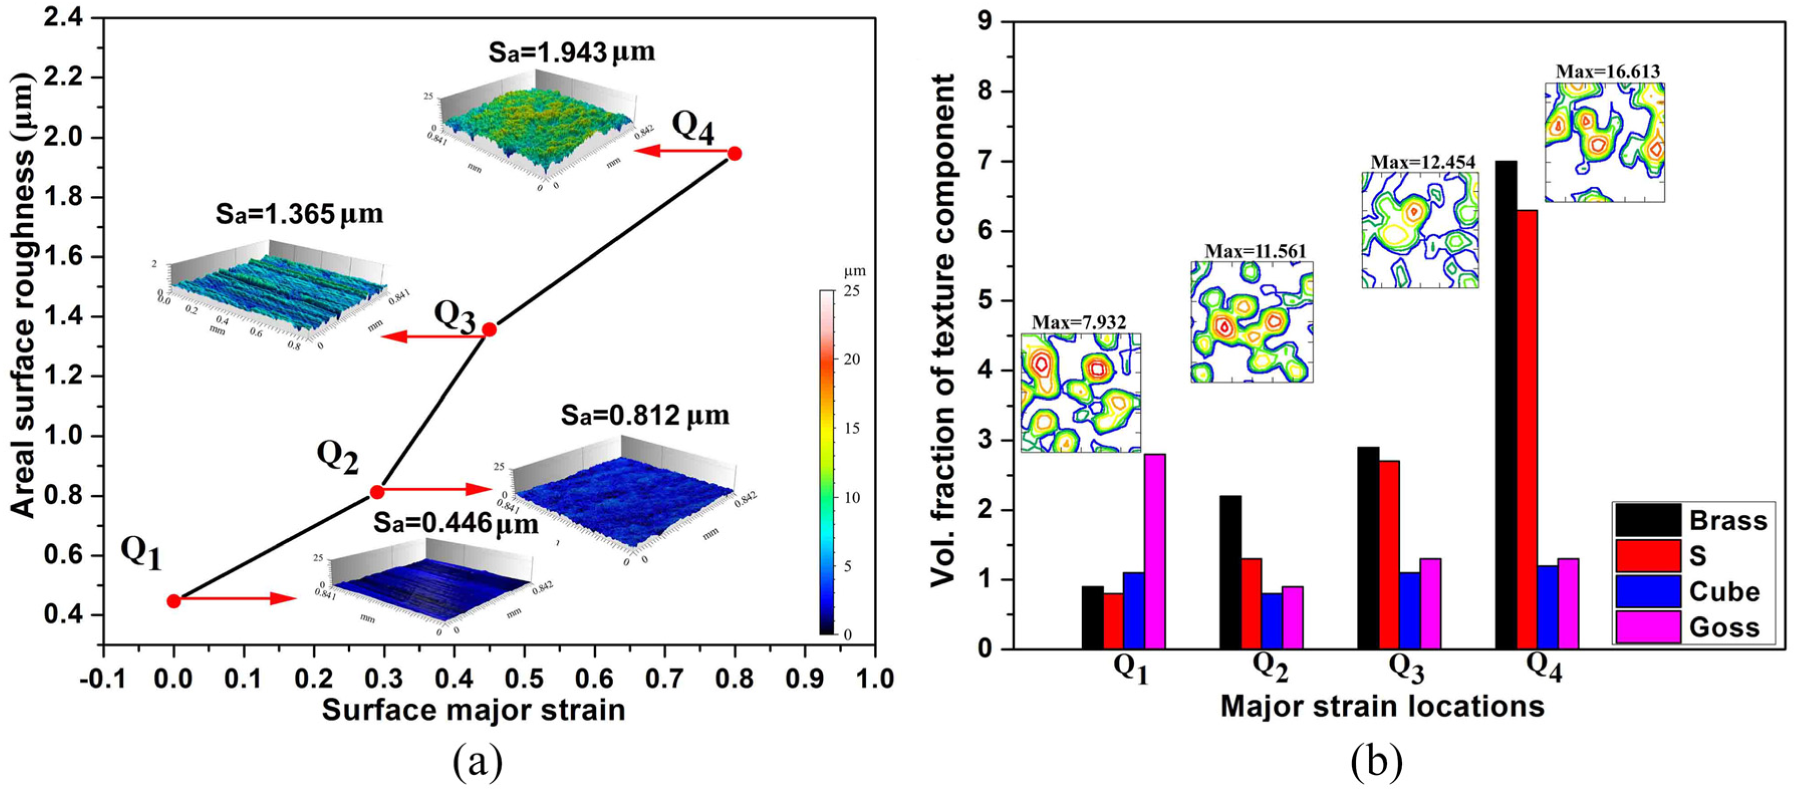
(a) Evolution of areal surface roughness with plastic strain and (b) evolution of main texture component with plastic strain and inset showing the ODF map at
Microhardness and surface roughness values at the different strain level.
To correlate the evolution of texture with surface roughness, ODF contours were generated and are depicted in Figure 10(b). The inset in Figure 10(b) represents ODF contour map at
Conclusions
In this work, a laboratory scale SPIF setup was designed and fabricated. Consequently, the design of experiment method was employed for optimizing SPIF process parameters. Also, an attempt was made to correlate the post-deformation properties with the microtexture evolution. The following conclusions are drawn:
Lower tool diameter was desirable for higher formability of SPIF product. Moreover, the formability was found to be reduced with the increase of the step size. The higher feed rate increased the productivity with an increase in surface roughness which is undesirable in practice. Hence, an optimal condition of factors was determined as tool diameter 4 mm, step size 0.2 mm and a feed rate of 782 mm/min.
Three separate regression models were developed for three responses (AF, PDT and SR) and, correspondingly, utilized the models to optimize the input parameters of SPIF process. Furthermore, the predicted responses from the evaluated regression model were validated at the optimal conditions, and it was observed that the absolute errors in the prediction of AF, PDT and SR responses were 0.9%, 4.4% and 6.3%, respectively.
The SPIF deformation exhibited an intense increase in microhardness and surface roughness value with an accumulation of plastic strain. The higher hardness and surface roughness value of 158±9 HV and 1.943 µm, respectively, were recorded in the region close to the fracture location where the highest major plastic strain of 0.80 was encountered. Also, the fracture study indicated that the fracture in SPIF truncated cone was in plane strain deformation mode. The same was further confirmed through the surface strain mapping with an effective fracture strain value of 0.96 and a triaxiality of 0.49.
A significant increase in hardness occurred due to grain refinement and depended on the amount of deformation imposed on the SPIF component per step. Furthermore, the evolution of texture with different levels of plastic strain generated a differential contribution of texture component. The substantial increase in the Brass and S texture component with deformation was responsible for the increase in the surface roughness. Thus, the amount of roughening is associated with the plastic flow and crystallographic texture.
Footnotes
Declaration of conflicting interests
The author(s) declared no potential conflicts of interest with respect to the research, authorship, and/or publication of this article.
Funding
The author(s) received no financial support for the research, authorship, and/or publication of this article.