
Abstract
In gas gathering pipeline system, 90° elbow suffers constant and severe collision of gas-carrying particles, which causes serious erosion on the inner wall. In this study, models of standard elbows (carbon steel with 210 GPa in elasticity modulus and 8300 kg/m3 in density) whose diameter varies from 65 to 200 mm with curvature ratio 1.5 are established to predict erosion rate causes by silica sand (100 μm in diameter, 1550 kg/m3 in bulk density) under gas gathering operating conditions (5.0 MPa, 10 m/s). Unlike most of the previous studies which only focus on erosion result on the wall, in this article, author extracts sample particles as research objects and studies the motion of every single particle. It has been found that there are three typical types of particle motion patterns in the elbow, and a part of sand particles released from lower area of incident plane will not even cause erosion.
Introduction
During the process of transporting natural gas in the pipeline, tiny solid particles entrained by gas will generate erosion and cause loss in thickness of pipeline, which invalidates common functions of pipeline and even brings failure, causing large economic losses and security risks. So, it has attracted a lot of attention; the accident investigation and statistics from EGIG 1 (from 1970 to 2004) show that there are totally 1123 accidents of 2,770,000 km natural gas pipeline within the jurisdiction of this organization, in which accident caused by the destruction of erosion and corrosion ranked third.
Elbow, as a weak and vulnerable link component in the overall pipeline, with respect to other parts, its inner wall is under the impact of direct collision of solid particles; as a result, erosion problem is more serious. According to the field experience data, 2 erosion rate of elbow is 50 times higher than that of the straight pipe.
Numerous experiments and computer simulation studies have been carried out on the erosion problem in elbow and bend where flow field undergoes abrupt transition. Since the 1990s, computational fluid dynamics (CFD) has been introduced into study of the prediction of erosion rate in the elbow, a large number of empirical or semi-empirical erosion rate prediction models have been put forward. In 1995, Meng and Ludema 3 analyzed and summarized main erosion prediction models, which covered various models from the first theoretical model proposed by Finnie 4 in 1960 to those developed and improved ones at a total number of 28. Chen et al. 5 refined grid before predicting erosion rate on the elbow and performed experiment finding good agreement of erosion trend with elbow geometry. In another study, Chen et al. 6 use both CFD and experiment methods and study the relative erosion severity between plugged tee and elbow. Zhang et al. 7 modify a CFD code in Fluent to account for particle size effects in the near-wall region, by comparing simulation and experimental results in 90° sharp bend, and found this modification can improve erosion modeling. Based on former studies, Tulsa model and operating parameters from gas field and actual pipe size are taken into consideration in this article. Numerical simulation is based on CFD method; meanwhile, the finite volume method is used to discretize space and time of fluid control equations and the additional equations. Pressure implicit split operator algorithm is used in pressure–velocity coupling iteration of the main flow field and eventually found the influence of incident position on erosion in the elbow.
The approach of numerical modeling
Before calculation process, basic modeling, namely, control equations that describe mainstream field, particle motion, erosion rate, and so on are presented below.
Basic equations
To establish the turbulent fluid flow modeling, basic equations used in simulation are given below:
Conservation equation of mass
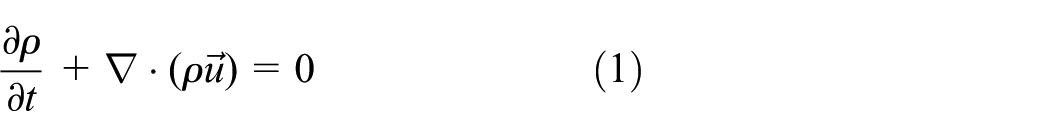
where
Conservation equation of momentum


where p is the pressure;
Conservation equation of energy

where cP is the specific heat capacity, J/(kg K); T is the temperature, K; ST is the viscous dissipative term, which refers to inner heat source of fluid and heat energy converted from mechanical energy due to viscous of fluid, J.
State equation
In this modeling, the compressibility of natural gas is considered, and the gas state equation (Peng–Robinson (PR)) is introduced

Turbulent flow equation
RNG k-ε turbulence model is used in simulation, which is slightly revised based on standard k-ε turbulence model


where
Discrete phase control equation
Due to the low Reynolds number, the effect near the inner wall of elbow pipe, that is the viscous force is larger, which cannot be ignored. Therefore, the flow field is divided into two parts, the boundary layer and the outflow layer, respectively. 8
1. Flow off the boundary layer
Force balance equation (X-direction) of particles under Descartes coordinate

where FX is the other forces (buoyancy, virtual mass force, pressure gradient force, Saffman force, and Magnus force) than a unit mass particle bears. FD (

where u is the gas phase velocity, up is the particle velocity, μ is the gas phase kinetic viscosity, ρ is the gas density, ρp is the particle density, dp is the particle diameter, and Re is the relative Reynolds number (also, particle Reynolds number)

2. Flow near the boundary layer
According to Newton’s second law, equation of motion (streamwise direction) of particles under the drag force is

where mp is the mass of particles, t is the time,
Model of erosion/erosion
At present, Tulsa University model is more commonly used. The model is mainly based on the experimental data of Tulsa University’s Center for corrosion and erosion research (E/CRC). Specific forms are as follows


where ER is the wall erosion rate, kg/kg; C is the wall material constant; HB is Brinell hardness of wall material, N/mm2; Fp is the particle shape factor CAS, for relatively sharp particles, semicircular particles, and rounded particles, whose values were 1, 0.53, and 0.2, respectively; n is the velocity index; Vp is the impact velocity of solid particles, m/s; f(θ) is a function of the impact angle; PR is the erosion rate of wall material, m/s;

where θ is the impact angle; θ0, a, b, x, y, and z are empirical constants determined by wall material.
Collision recovery equation
Collision between particles and the wall causes energy transformation and even loss so that the bounce velocity of the particle is lower than inlet velocity. Normal restitution coefficient determines the rate of change in momentum in the direction perpendicular to the wall after the collision.
By studying the velocity variation of AISI 4130 steel in the impact of solid particles, Forder et al. 9 obtained the equation of wall surface recovery


where α is the impact angle; εT and εN are the normal and tangential restitution coefficients, respectively. And Wallace’s 10 study proves good accuracy of this equation.
Simulation environment
Physical model
In this article, standard 90° elbows with curvature ratio 1.5 have been selected (note that the curvature ratio larger than 6 is usually referred to as “bend”), the reason for which is the large number of use of this specification in the field (natural gas gathering and transportation pipelines).
Pipelines on service in natural gas field range from DN65, DN80 to DN200, DN250 (in gathering system); therefore, to comprehensively study elbow as possible, the physical model of elbow by six kinds of nominal size is taken into consideration: 65, 80, 100, 125, 150, and 200 mm.
In this simulation, the inlet condition is pressure. And the pressure is 10 MPa, the temperature is 298.15 k, with 5% of turbulence and 10% of turbulence viscosity ratio. There is no liquid water in the fluid, the flow rate is 10 m/s, the mass flow rate of the solid particles is 0.02 kg/s, and density is 1550 kg/m3, which is uniformly distributed at the entrance.
Geometry model
In this study, inlet and outlet straight pipe section is set before and after the elbow, whose length should be equal to 20 times the radius of the elbow. The reasons for this are considered in the following two aspects:
In natural gas actual in-pipe flow, the flow condition should be fully developed in the inlet straight pipeline before entering the elbow, that is, in-pipe velocity distribution should meet some distribution rules, and turbulence parameters should also be compatible with the flow state. In computational numerical simulation, there are two methods to solve the above problem: to write the user-defined function of gas velocity, or use a relatively longer straight pipe to allow the full development of two-phase flow. On one hand, the UDF method has some limitations: the inlet boundary conditions are restricted to the velocity inlet only; on the other hand, this method is more difficult when setting turbulence parameters. Therefore, the use of a straight pipe section is a relatively simple method.
After the outlet of elbow, a section of straight pipe is also set. On one hand, it provides enough length for the outlet flow to a full development during simulation process and avoids no reflow phenomenon; on the other hand, how particles passed through the elbow can be more carefully studied.
The simulation modeling is established in ICEM and then been meshed. And five planes are abstracted from different central angles in elbow (Figure 1).

Geometric modeling: (a) close look at the elbow, (b) the integrated modeling, and (c) planes from different central angles.
Computational domain is modeled by preprocessor called ICEM, and the structured mesh is generated using O-BLOCK method. As the elbow is the focus of this study, the flow domain is closely meshed, and the wall region in the flow domain is also closely meshed for extracting high-velocity gradients near the boundary walls (Figure 2). The grid independence test has been done to check the quality of the mesh for solution convergence, and considering lower computational time desired, an optimum mesh geometry consisting of 2,000,000 grids has been adopted in this work.

A portion of the meshed domain of the elbow and the cross sectional.
For the reason that the wall region is treated by standard wall function, the near-wall grid unnecessary meshed too closed, but the first inner node should be located in the logarithmic region, and the dimensionless number y+ (11.63 < y+ < 500) to determine the rationality of the standard wall function. For the simulation results of the six kinds of nominal size, the results of y+ are shown in Table 1, and all the y+ are in a reasonable range, so the results of the simulation are reasonable.
The value of y+ of the simulation results of different diameter elbow.

Material parameters
Particles from natural gas field range in size from 10 to 200 μm, according to Liu et al.’s 11 observation, median size of 100 μm takes up a large proportion, which causes more frequent and constant collision. Hence, in this article, the particle size is chosen to be 100 μm. To investigate how particles from all incident positions influence erosion result, author used uniform jet source in Fluent and set incident velocity same as gas.
Results and discussion
Distribution characteristics of continuous-phase flow field
Distribution of mainstream (the continuous-phase flow) field in elbow plays an important role on erosion characteristics. Simulation results show that mainstream velocity and pressure distributions are quite similar in elbows of different geometric sizes. Throughout the flow process, gas is compressible; as a result, velocity and pressure vary in a large extent at different locations along the way in pipe section.
Taken 150 mm elbow for instance (Figure 3), it can be found that near the outer wall, velocity is significantly reduced (Figure 3, zone II), while near the inner region velocity sharply increases (Figure 3, zone I). The reason for this is that when outer gas is compressed, partial kinetic energy transforms into pressure energy, which decreases velocity rapidly; meanwhile, near the inner region, gas diffuses outward, a portion of pressure energy has been converted into kinetic energy, and velocity increases significantly.

Mainstream velocity.
When the above-described process continues, flow separation will occur within the elbow, and then vortices being generated near the outlet of the elbow. On one hand, the generation of vortices will cause energy dissipation; on the other hand, it will affect the motion of particles (their velocity will be changed after colliding to the inner wall surface of elbow, and the impact is particularly evident in radial velocity), thereby affecting the erosion situation. It is seen from Figure 3, near the outlet inner wall, there is a low-speed region (zone III). After coming out of the elbow, streamline flows inward (see velocity vectors in small black box in Figure 3), which indicates that gas in the central region is moving to the inner wall. Then, gas reaches the wall, a portion of radial velocity losses; while gas is compressed, part of the kinetic energy is converted into pressure energy. This low-speed zone has an important influence on the motion of the particles; since gas is compressed here, particles flowing inwardly in radial direction will be inhibited, which reduces the erosion rate on the inner wall surface. And the mainstream density is shown in Figure 4 correspondingly.

Mainstream density.
The overall collision situation within the elbow
The motion of particles is within the elbow and the inlet/outlet straight pipe segment consists of two parts: carried by gas flow and collision to the pipe wall. Erosion damage happens during the collision.
As shown in Figure 5, in the upstream of elbow, particles’ motion is stable following the gas. Particles do not collide with the upstream pipeline wall. After injecting into the elbow, particles’ trajectory bends due to centrifugal force, soon after which particles collide with the outer wall of the elbow. Outer sidewall suffers more serious collision by particles, as well as erosion, along 45°–90° region (Figure 6) collided. Specific location of the collision is related to spatial position of incident particles, the inlet velocity, gas velocity, and so on.

Particles trajectories in different elbows: (a) D = 65 mm, (b) D = 80 mm, (c) D = 100 mm, (d) D = 125 mm, (e) D = 150 mm, and (f) D = 200 mm.

Collision area in different elbows: (a) D = 65 mm, (b) D = 80 mm, (c) D = 100 mm, (d) D = 125 mm, (e) D = 150 mm, and (f) D = 200 mm.
With the increase in the diameter, the area of collision on both inner and outer sidewall in elbow presents the trend of expansion, wherein the outer wall is particularly evident.
After particles collide with the wall, kinetic energy losses a certain amount, and because particles and elbow are both compressed flexible, particles will reflect away from the wall. Part of the particles flow downstream close to the wall, and another portion collide again several times with the inner or outer arcuate surface in elbow, after which they join them in the similar path of one-crash particles.
Before analyzing single particle motion, we should pay attention to three points:
The relative velocity between particles and gas determines the change in particles velocity, exponentially. When velocity of particles is smaller than gas, the gas accelerates particles until they reach an equilibrium state, and this process is very fast. However, when adversative, gas gives a deceleration on particles. Thus, the variation of the particles velocity can be obtained by comparing the same time, in the same area of the gas flow rate and the size of the particle velocities obtained.
The velocity is reduced slightly after particles colliding with the surface. In the study, it is found that when impact angle is 1°, the tangential coefficient of restitution is 0.98444 and normal coefficient is 0.98664. It is shown in simulation result that most impact angle is less than 1°; to this extent, coefficients of restitution are approximate to 1.00, so changes in particles velocity are not obvious.
Currently, in Fluent seldom the parameter directly reflects wall collision, so in this article, the erosion rate of the wall can indirectly determine the degree of collision. When the erosion rate is 0, it is considered that particles do not collide with the wall.
The motion of single particle
For further analysis of particles motion and erosion characteristics within the elbow, four particles from different positions on the same inlet plane (shown in Figure 7) are extracted using Lagrangian approach. The color shades on behalf of different velocity of particle, and the path of trajectory indicates particles’ motion (Figure 8). As can be seen from Figure.7, four particles have similar trends, but trajectory in local position mainly within the elbow is distinct.

Incident positions of sample particles.

Velocity contour of plane z = 0 and abstract plane.
To study erosion in the elbow, the particles motion in inlet straight pipe must be taken into account (but it is not a key aspect); however, motion in the outlet straight pipe has negligible influence. Hence, discussion in this article focuses on particles motion before and within the elbow.
Particle motion before injecting the elbow
From in-jet surface until entering into the elbow, erosion did not occur between particles and straight pipe. And the velocity change is small (about 1 m/s), among four particles, velocity of #1 and #401 decreases, while #100 and #350 get speeded up. Changes in velocity closely relate to the incident position where mainstream field of the gas differs in pressure and velocity distribution.
Figure 7 shows that in-jet positions of particle #1 and #401 are close to the wall. On comparing velocity at several different cross sections in inlet straight pipe, it is not hard to find that, due to the influence of the viscous sublayer, the gas velocity near the wall (7–7.5 m/s) is less than turbulence of the core area (10–10.5 m/s), while the gas velocity is less than the velocity of the incident particles (10 m/s), which eventually causes particles near the wall deceleration. Meanwhile, the closer to the wall, the greater velocity of particles decreases.
However, it is interesting to find in Figure 7 that particles #100 and #350 incident locations are away from the wall, particularly, #350 is right in the core area of turbulence. Both particles are slower than gas; as a result, they got accelerated. In velocity contour (Figure 8), gas flow accelerates into the elbow; at the same time, it carries particles to accelerate. Particles near central axis get the largest acceleration, which explains the increase in velocity of #350 particles is much larger than #100.
Trajectory within the elbow
The velocity changes in particles after flowing into elbow can be divided into three types: first accelerated and then decelerated (#1), first decelerated and then accelerated (#100 and #350), or accelerated continuously (#401). It is worth noting that the magnitude rate of decline is apparent.
The above-described variation of each particle velocity can be explained from the velocity cloud sectional in different angles.
The motion of #1 particle
This particle’s velocity reduces in the upper outer arch part of elbow, see Figure 9(a), but the corresponding particle path (Figure 10) has shown that this deceleration is not the result of the collision. Until the minimum velocity is reached, intensive collision occurs. Hence, collision is not the reason for velocity decrease. Turn to the foregoing discussion, particles flow through the low-speed gas will give rise to velocity reduced. So it is suspected low gas velocity near the upper surface is the reason for particle #1 sharp decline in velocity. This can then be confirmed by the 22.5° and 45° velocity cloud chart (Figure 3). As can be seen in this region, particle velocity finally dropped down to 4.0 m/s, which matches the gas velocity (between 3.7 and 4.0 m/s). In addition, as shown in Figure 10, it found that when particles are slowed down to 4 m/s, although near the wall suffered more intensive collision, erosion rate is not high (less than 5.5 × 10⁻¹⁰ mg/g), which is due to the small impact velocity (about 4 m/s). Therefore, impact velocity plays a major role on erosion rate.

Trajectories of four sample particles. (a) ID: 1, (b) ID: 100, (c) ID: 350, and (d) ID: 401.

Motion parameters of #1 particle.
After completion of deceleration, the particle velocity began to rise along with the intensive collision, and gradually with the decline in the frequency of collision, the particle velocity reached the maximum (9.67 m/s) in the elbow. From 22.5° and 45°cross-sectional contours in Figure 3, it can be seen that gas near the inner wall accelerates to the axial direction. This mechanism validates high-speed gas (9.88–10.13 m/s) caused the acceleration of particle (up to 9.67 m/s).
The above process is extremely important to particle collisions and erosion behavior in the elbow. In conjunction with the impact angle of attack, particle #1’s motion (sliding or rolling) is revealed clear hereinafter. Although the trend on changes in impact angle is not clear and unpredictable, it stayed at a low value (less than 1), which indicates that almost particle moves downstream close to the inner wall.
To further identify the continuous effect of particles on the wall, author derived numerical results of particle #1 from the Fluent solver, then detected collision positions are several groups of discrete points corresponding with discrete steps so that the particle can be determined by sliding and rolling in the elbow.
The result of sliding and rolling is the serious erosion of the elbow. Figure 10 shows that in the above acceleration section, fewer particle collisions happened (referred to the former deceleration section), but a higher erosion rate appeared, up to 2.3 × 10⁻⁹ mg/g. Thus, increasing of speed is considered to have a vital impact on deterioration of the degree of erosion.
After the completion of accelerated motion, the velocity of the particle #1 once again decelerated sharply and the reduce amplitude exceeds its first velocity decline.
Interestingly, particle #1 is the only one among these four samples which decelerates twice within elbow. As discussed in section “Distribution characteristics of continuous-phase flow field,” there is low-speed area around elbow exit, combined with the trajectory of particles #1, it can be determined that this particle entered into the low-speed area at the outlet of the elbow, and this can be confirmed by the velocity of gas (2.52–3.26 m/s) and particle (3.21 m/s).
The motion of #100 particle
From the foregoing discussion, particle #100 as well as #350 first decelerated and then speeded up (at the exit velocity increased to the maximum) within the elbow. Although they are similar in trend, the rate of change and trajectories are remarkably different. Particle #100 trajectory in the elbow is closer to the outer surface, and its velocity decreases to a minimum 4 m/s; however, particle #350 trajectory is offset away from the outer side of the arch, and its velocity decreased from 11.2 to 6.3 m/s. Particle #100 soon collides with the wall after injecting into the elbow, but its collision velocity is low (4.3 m/s); to this extent, it exerted little effect on erosion rate (5.5 × 10⁻¹⁰ mg/g). With the continuously reduced velocity, more frequent collisions happened between particle #100 and elbow, but the erosion rate is further decreased (less than 3.0 × 10⁻¹⁰ mg/g). Over this velocity decreasing period, particle #100 trajectory is near the outer arch where gas is slow, which is similar to the reason why #1 decelerates in this region.
After deceleration, particle acceleration starts. Accompanied with increase in velocity collision with the wall has become increasingly frequent, and even erosion rate is also higher than other times, a maximum of 6.2 × 10⁻¹⁰ mg/g. But, impact angles of these collisions are small (less than 0.1°), and the cumulative erosion rate is small.
Particle #100 trajectory shows that it has not passed the inner region of elbow during the whole course of the motion (Figure 9(b)), where particles’ velocity (such as #1) increased due to gas pressure converted to kinetic energy and the emergence of local flow rate of gas is increased. So, there are other reasons for #100’s acceleration. After carefully analyzing the trajectory, it is found that #100 is almost close to the outer wall surface across the elbow. Additionally, observed contours of the velocity distribution (Figure 3) abstracted from central angle 22.5°, 45°, and 67.5°, it is shown that the gas velocity near the outer wall is gradually increased along the flow direction, eventually at the outlet reached 6.92 m/s, as well, particle #100 left elbow at a velocity of 6.87 m/s which is virtually close to gas. So, the above reason explains how particle #100 got acceleration in the elbow.
What is also found in Figure 11 is that collisions occurred with all impact angles below 1°, and angles show a downward trend along the trajectory, even after leaving the elbow the angle decreases to about 0°. Meanwhile, its trajectory gradually leveled off under the motion of gas, approaching the contour line of the pipe. Then, from output numerical results of particle #100 from Fluent solver, it can be found that the collision locations are discrete points corresponding to several groups of continuous steps which indicates, like #1, similar slide and roll phenomenon happened on #100 in the elbow.

Motion parameters of #100 particle.
The motion of #350 particle
With respect to particle #100, #350 does not collide more frequently. Sporadic collisions only occurred at the lowest velocity. Particle #350 traversed the elbow at a fairly high velocity (even minimum at 6.37 m/s), which has a close relationship with its injection position where it is close to the center axis.
By observing trajectory and velocity cloud-section from 22.5°, 45°, and 67.5° (Figure 3), collision positions corresponding to the minimum velocity of particle #350 are about 2 to 3 o’clock position in pipe cross section where gas flow rate is between 6 and 7 m/s.
Particle #350 in the rear half of the elbow was also accelerated the same as #100, accompanying a small amount of collisions. Therefore, namely the gas flow speeded up near outer wall along the elbow increased particle #350’s velocity gradually.
Easy to know from Figure 12, when collisions occurred between particle #350 and the wall, impact angles have similar manifestations to the #100, the value of most angles is less than the value of 1°, and showed a downward trend, what led #350 to this behavior is also thought the same as #100.

Motion parameters of #350 particle.
The motion of #401 particle
Particle #401 is obviously different from samples talked before, as can be seen from Figure 13, #401 does not collide with the wall and there being no erosion.

Motion parameters of #401 particle.
Looking at the trend of velocity change, we can find that, unlike other three samples which have more or less experienced deceleration, #401 continuously accelerated in the elbow. By trajectory of #401 (Figure 5(d)), it is shown that under the action of the gas drag force, #401 moved close to the lower region below the central axis, without collision with the wall in the elbow. Referring to velocity clouds corresponding to different angle (Figure 3), it shows that the whole area of mainstream where #401 flows, the gas is accelerating, which caused particle #401 accelerated together.
Based on the study and discussion of the single sample of particle #1, #100, #350, and #401, particles motion can be broadly divided into three categories:
Frequent collisions occurred between particles and the outer wall surface of elbow, such as #100 and #350. Trajectories are close to the outer wall contour in this type; during collisions, velocity of particles undergoes an upward trend, while the impact angle decreases. This type brings a significant impact on erosion damage to the elbow.
The particle collides with the wall as soon as injecting the elbow, and then rolls and slides downstream along the outer wall to the inner wall, such as #1. This type of particle motion is complex, of which there are several accelerations and decelerations, while no significant change in the impact angle. Particles of this part cause erosion damage in sidewall and inner wall surface, but the erosion rate is less than type 1.
There is no occurrence of collision, as well as, erosion in this type, such as #401. Under the gas drag force, trajectory has not intersected with elbow wall contour and particle keeps speeding up.
The influence of incident position on erosion
Research on the influence of the incident location on erosion within elbow has been approximately blank so far.
Most scholars use a jet plane boundary during the relevant numerical modeling while ignoring the effects of incident positions.
In section “The motion of single particle,” the authors analyzed four particles of different incident positions, whose motions in elbow differ greatly, which as a result, causes varying degrees of erosion (some even do not bring erosion damage). Thus, the incident position is a vital factor when studying erosion caused by a certain single particle, where it should be noted that there is a little difference from taking the elbow as the main object of the research in which the erosion is involved with a large number of particles.
For in-depth research and analysis, 450 million sets of data were output from Fluent solver, which includes trajectories from each incident position and erosion situation corresponding to every single particle. Then, maximum erosion rate and cumulative erosion rate were analyzed.
Features of the influence of particles incident position on erosion of elbow can be seen from figures above. A few points are of remarkable importance because they are apparently different from the former comprehension of erosion in elbow:
1. From previous section, it is known that not all particles will cause erosion; furthermore, observing the relation figure of position of every individual particle and the cumulative rate of the erosion, it is found that two areas in incident plane produce non-collision particles. Zone I is the lower region limited within central angle θ, wherein the width of zone I is approximately 0.25–0.3 times of the diameter of elbow, and the height h1 increases with diameter, it will never reach the central axis. On both sides of zone I, there is an area height h2, where zone II locates, h2 also increases as the diameter, but the width of the zone II is more fixed, it begins from the boundary of zone I and ends near the horizontal axis line. Figure 14(b) shows the particle emitted from zone I, it accelerates sustained in the elbow, which has a distinct similarity as particles from zone II. The difference is that the trajectory of the latter is closer to the outside wall.

Zone I and zone II: (a) sketch of inlet cross section and (b) sketch of moving track in elbow.
Overall, the motion of gas carrying combined effects of many other factors gives rise to particles from zone I and II reaching wall surface difficult, and thus no erosion. The total number of above particles share ratio is shown in Table 2.
Different inner diameters without causing erosion of the proportion of particles elbow.

Found in Table 2, with the increase in elbow diameter, the proportion of non-collision particles increases. This is because the larger the elbow, the larger the flow area of zones I and II; more particles can be injected within these zones, and gas drag force carries them downstream without intersecting with the contour of wall.
2. It is also apparent from Figures 13–18 and Table 3, the maximum accumulated erosion rate is caused by particles come from the upper portion of incident plane at the entrance, and close to the wall; as a result, particles collide with elbow more easily, and thus the accumulated erosion rate is large. However, particles that caused the maximum erosion rate are not from this area.
3. In different size elbows, particles cause the maximum erosion rate all come from the upper region close to the axis of symmetry, but specific position varies with diameter changes. This indicates the erosion behavior of particles in the elbow is an extremely complex process; when diameter is changed, the flow field inside also changes, thereby causing particle motion discrepancies, but, whether such changes have apparent regularity need further research in the future (Figures 19 and 20).

Relationship of incident position and erosion in 65 mm elbow.

Relationship of incident position and erosion in 80 mm elbow.

Relationship of incident position and erosion in 100 mm elbow.

Relationship of incident position and erosion in 125 mm elbow.
Particles cause the maximum erosion rate in different elbows.


Relationship of incident position and erosion in 150 mm elbow.

Relationship of incident position and erosion in 200 mm elbow.
Conclusion
Trajectory of single particle is studied in this article which former researchers seldom did. There are three different characteristics of the particle motion in the elbow: first deceleration and then acceleration, ultimately, deceleration again; acceleration after deceleration; sustained acceleration motion.
In this simulation, enough straight pipeline before and after the elbow is added for mainstream fluid for fully developing the turbulent flow. Under the premise, the influence of incident position on the erosion distribution characteristics of the elbow is found. Part of particles from the bottom of incident plane does not cause erosion to the elbow. And with the increase in the diameter of the elbow, the proportion of non-erosion particles is also increased, to which the percentage reached 45.5% in 200 mm elbow. This discovery has meaningful contribution to erosion rate computational prediction. The author suggests that enough straight pipe should be considered in the future study.
Footnotes
Academic Editor: Jun Ren
Declaration of conflicting interests
The author(s) declared no potential conflicts of interest with respect to the research, authorship, and/or publication of this article.
Funding
The author(s) disclosed receipt of the following financial support for the research, authorship, and/or publication of this article: This work was supported by National Natural Science Foundation of China (Project No. 51474183) and State Key Laboratory of Oil and Gas Reservoir Geology and Exploitation.