
Abstract
Cell voltage inconsistency of battery module is correlated with cell capacity fading inconsistency caused by uneven temperature or improper charge/discharge rate, so it is essential to study on cell voltage inconsistency when establishing a battery module capacity fade model. An accelerated life experiment is conducted on 12-series (12S) LiMn2O4 battery. The evaluation index of the voltage inconsistency is given, and the evolution of the voltage of the 12S battery module is obtained. Furthermore, a model of capacity fade of this 12S battery is established based on cell voltage inconsistency, which is extended to any-series battery by means of probability distribution. Based on this extended model, the relationship between the number of cells and the life of the battery is obtained.
Keywords
Introduction
Lithium-ion batteries are promising power sources for electric vehicles considering their high energy, power density, and long cycle life.1–3 However, the capacity of the battery fades with the increase in the mileage, which has great influence on the performance of electric vehicles. So, it is essential to study the capacity fade when designing the electric vehicle battery system.
When establishing a model for cell capacity fade, there are generally two methods: (1) one method is mainly based on chemical change inside cells, such as the loss of lithium-ion, 4 the growth of solid–electrolyte interface (SEI) layer, 5 and the variation law of the impedance of cells.6,7 However, the aging mechanism is unclear by now and the aging-related chemical kinetic parameters cannot be measured by experiments. And these models cannot directly reflect how external stresses, such as ambient temperature and charge/discharge rate, influence the capacity fade. (2) The other method called empirical life model is mainly based on accelerated life experiments,8–12 which directly reflects how external stresses influence the capacity fade, and is widely adopted in both academic researches and engineering use.
There have been substantial efforts focused on the development of models to predict capacity fade in lithium-ion batteries. Calendar life and cycle life were adopted to quantify the battery aging. The accelerated calendar and cycle life of lithium-ion cells were studied by Bloom et al., 11 and the experiment data were fitted by the Arrhenius kinetics

That area-specific impedance (ASI) increase and power fades following (time)1/2 rule in the calendar life experiments may be due to SEI growth. From the cycle life experiments, the ASI increase data follow (time)1/2 kinetics also, but there is an apparent change when going from 2% to 6%
Most of the results of the above focus on the (time)1/2 rule based on the data fitting. But this rule is not suitable for all external stresses, especially under high discharge rate, 19 and cell inconsistency is seldom considered when establishing the capacity fade model. In this article, the accelerated life test of battery was conducted, and temperature and discharge rate are used to establish 12-series battery capacity fade model. On this basis, the battery module capacity fade model is established considering the cell voltage inconsistency, which is extended to the life prediction model of multi-series battery modules by probability distribution. The relationship between battery module life and cell numbers is clarified.
Capacity fade model under accelerated stress
General directives for battery capacity fade model
Experiments on 12-series LiMn2O4 are conducted under conditions of high ambient temperature, normal temperature, high discharge rate, and normal discharge rate. And unknown parameters of capacity fade model can be fitted using the experimental results. Then, the model is established, which directly reflects how ambient temperature or discharge rate or both influence capacity fade.
How battery capacity will fade under external stress can be described by Gauss degradation, that is, given as equation (2)

where
In the accelerated life experiment, the experimental data can be used to fit the appropriate regression model, which describes the process of accelerated capacity loss under different external stresses. By method of likelihood estimation, the exact amount of capacity loss is calculated from experimental data. And the estimate of characteristic value of this model is
A curve-fitting and a regression analysis are performed on

where s is the external stress and it can be temperature T (
Capacity fade model under different ambient temperatures and discharge rates
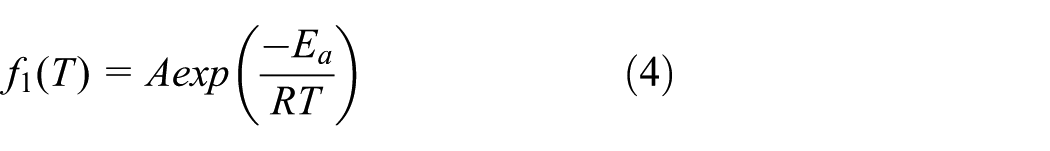
According to Arrhenius model, 20 the fade rate influenced by ambient temperature (stress T) is given as equation (4)
To make
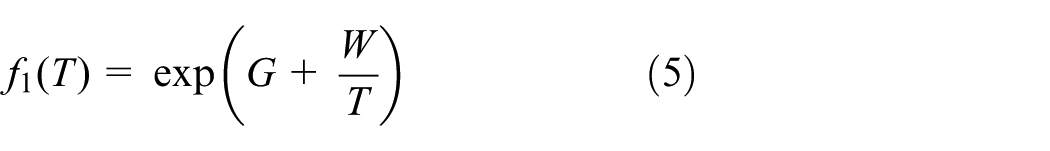
So, under the external stress of ambient temperature (stress T), the battery capacity fade model is given as equation (6)

The accelerated degradation factor of the stress T is given as equation (7). When temperature is external stress, SEI growth is the main cause of battery aging. It follows the Arrhenius law, however, under the external stress of discharge rate (stress


Experiment and model parameters identification
The 12-series 35-Ah LiMn2O4 battery is used in the accelerated life experiment, and the parameters of this battery are shown in Table 1.
Parameters of 35-Ah LiMn2O4 battery module.

As shown in Figure 1, other devices used in the experiment are Digatron EVT500-500 (for discharging or charging the battery), battery management system (BMS), and temperature chamber (to control the ambient temperature).
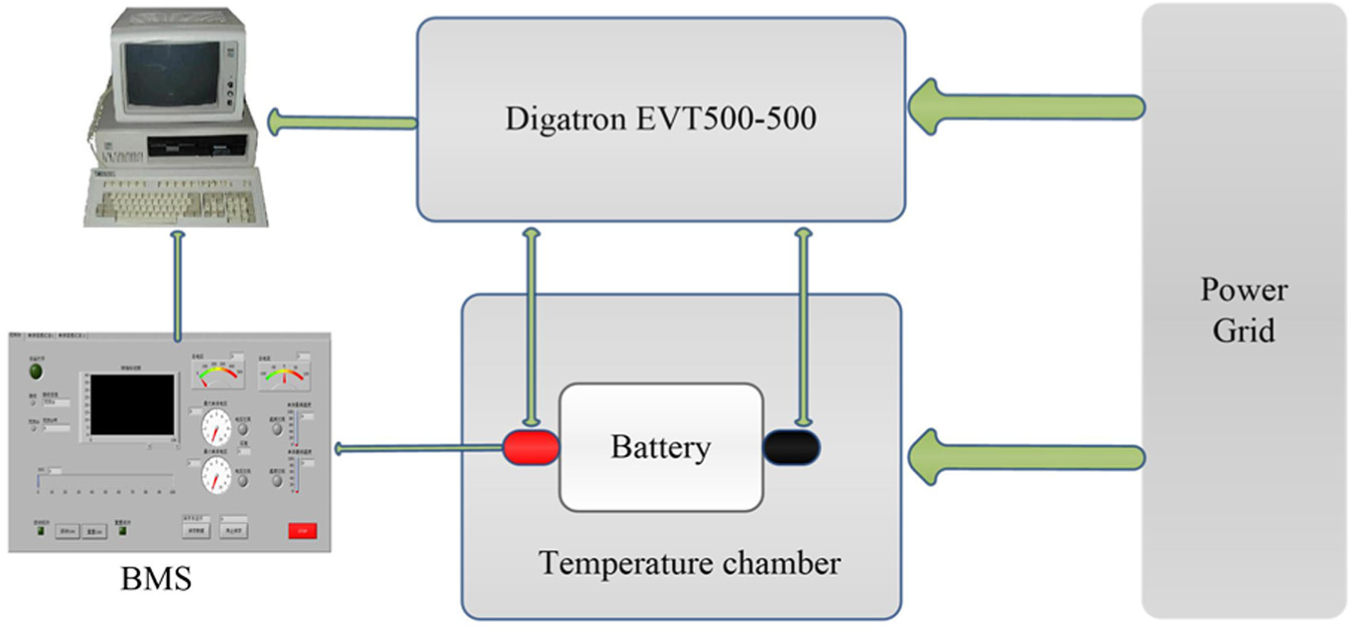
The structure of the experiment.
The two factors of ambient temperature and discharge rate are included in the design of the accelerated life experiment. Discharge rate is held constant when testing the effects of ambient temperature on capacity loss and this part of the experimental design is shown in Table 2. Correspondingly, ambient temperature is held constant to test the effects of discharge rate, and this part of the experimental design is shown in Table 3. The SOC range is 0.3–0.8 during the test, and 15 min rest between discharge and charge.
Experimental design on temperature.

Experimental design on discharge rate.

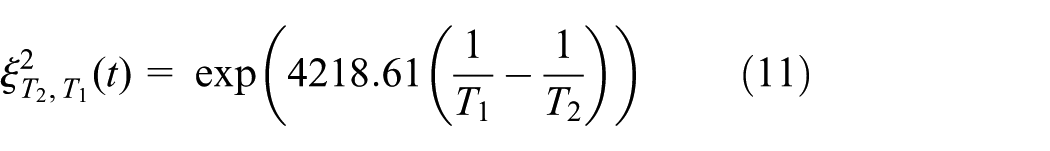
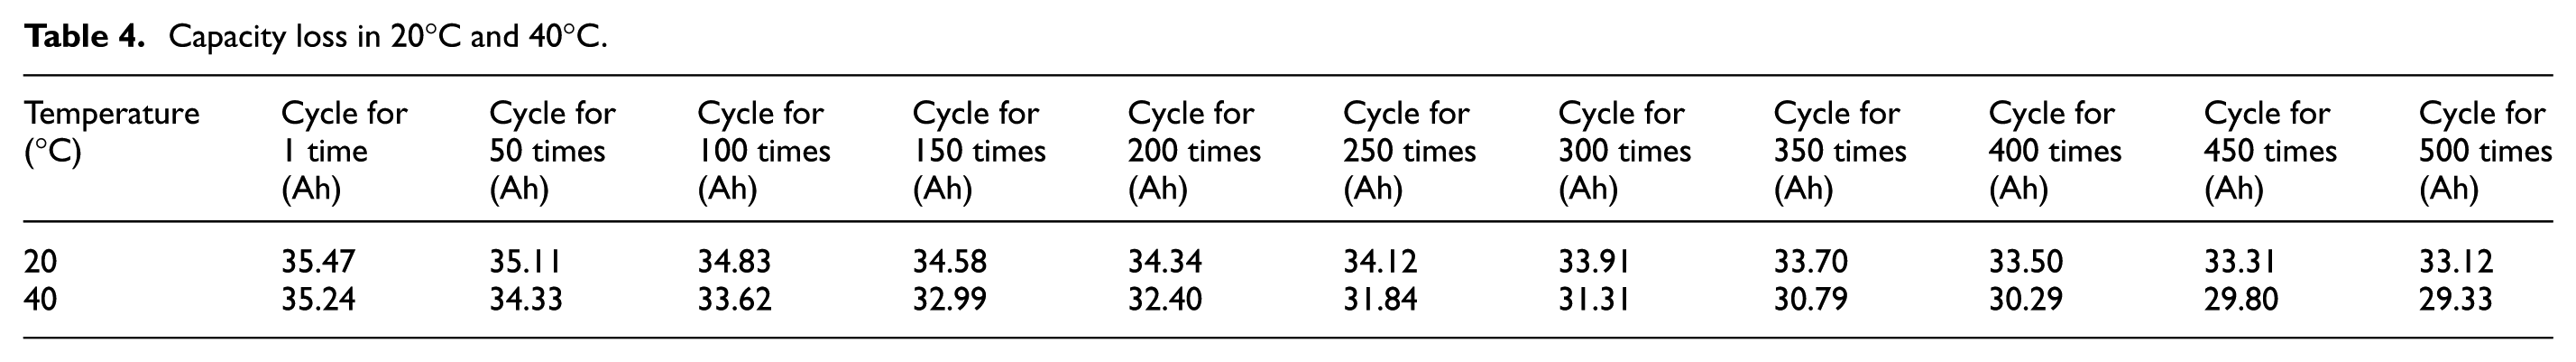
When the ambient temperature is 20°C and 40°C and the discharge rate is 1C, the experimental results of battery capacity degradation are shown in Table 4. And the battery capacity fade model based on ambient temperature is given as equation (10). Set T = 293 and 313 K, we can get the capacity fade model for the experiment results. And, the factor of capacity loss caused by ambient temperature is given as equation (11)

Capacity loss in 20°C and 40°C.
When the ambient temperature is 20°C and the discharge rates are 1C, 2C, and 3C, the experiments are conducted for 500 times for each discharge rate. The relation between discharge rate and the amount of capacity degradation is shown in Figure 2. The battery capacity fade model based on discharge rate is given as equation (12). From equations (5), (9), and (10), the capacity fade model based on temperature and discharge rate is equation (13)


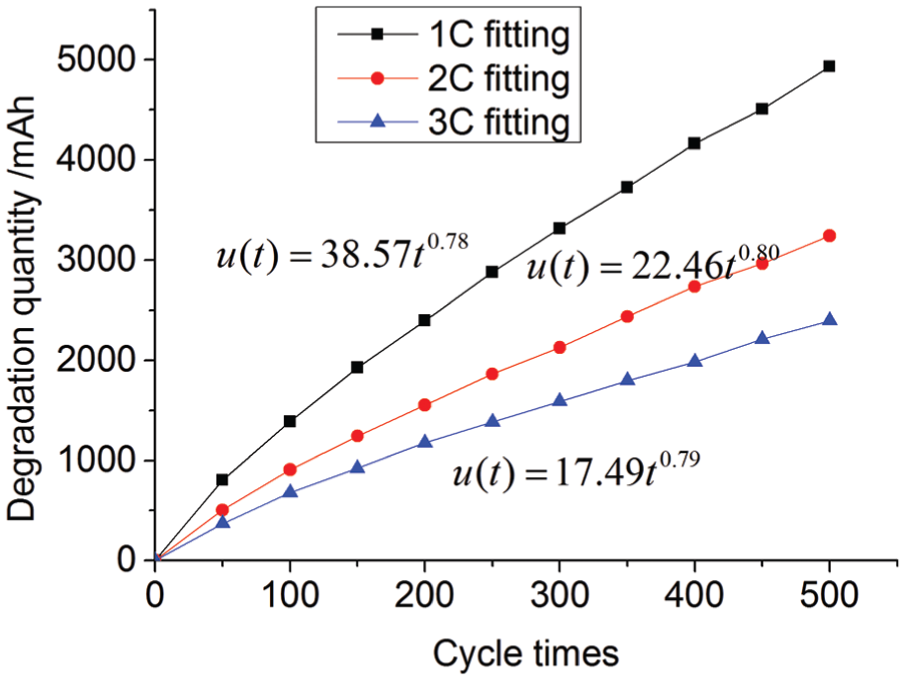
Degradation quantity curves of different discharge rates.
There is big difference in capacity when the discharge rate changes and the initial capacity of different discharge rate can be calculated according to Peukert function 21 as equation (14). The constants 35.01 and −0.038 are fitted results for Peukert function

If the battery life ends when 20% of its capacity is lost, the lost capacity should be

Furthermore, the number of cycles the battery can go through before its life ends under different conditions of varied ambient temperature and varied discharge rate is shown in Figure 3.
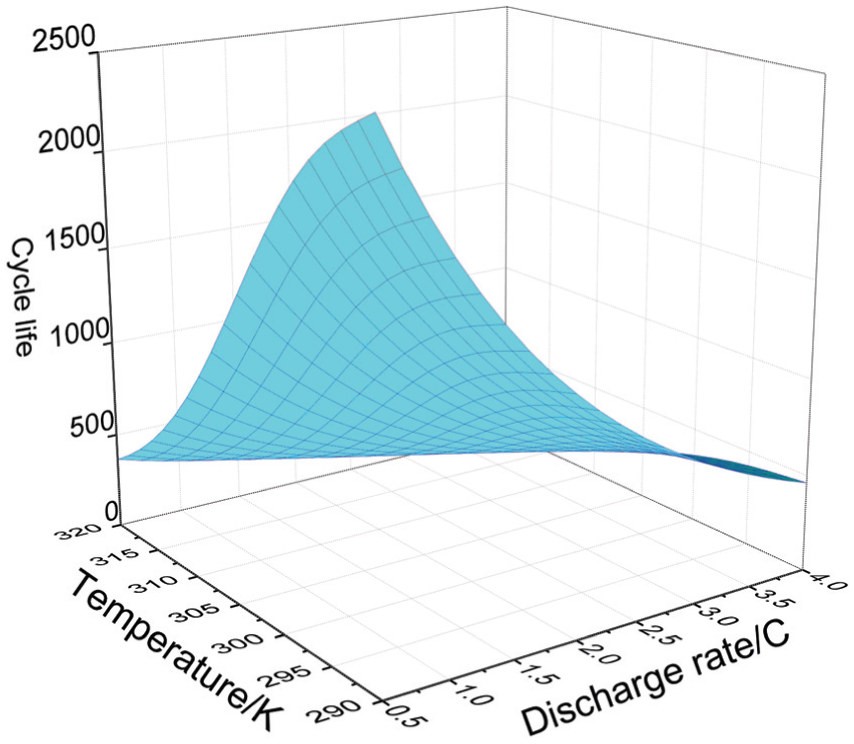
Battery life map influenced by temperature and discharge rate.
Battery capacity fade model considering cell voltage inconsistency
Analysis of influencing factors of voltage inconsistency
The battery system in electric vehicles is composed of cells in series–parallel connection. Because of cell voltage inconsistency, the battery capacity loss cannot be calculated by just adding all the cell capacity loss. Through the analysis of the evolution of cell voltage inconsistency combined with the analysis of external stress in the accelerated life experiment, a comprehensive model of battery capacity fade can be established.
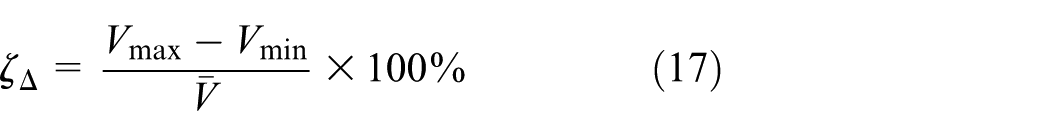
Two indexes are introduced to describe the degree of cell voltage inconsistency: (1) relative standard deviation of cell voltage and (2) relative range of cell voltage. The (1) index can be calculated in equation (16)

where n is the number of cells inside battery module, and
One of the factors causing cell voltage inconsistency is initial cell voltage inconsistency, which is due to the manufacturing process. Other factors causing cell voltage inconsistency include discharge rate, temperature, and SOC, which are shown in Figures 4–6, respectively.
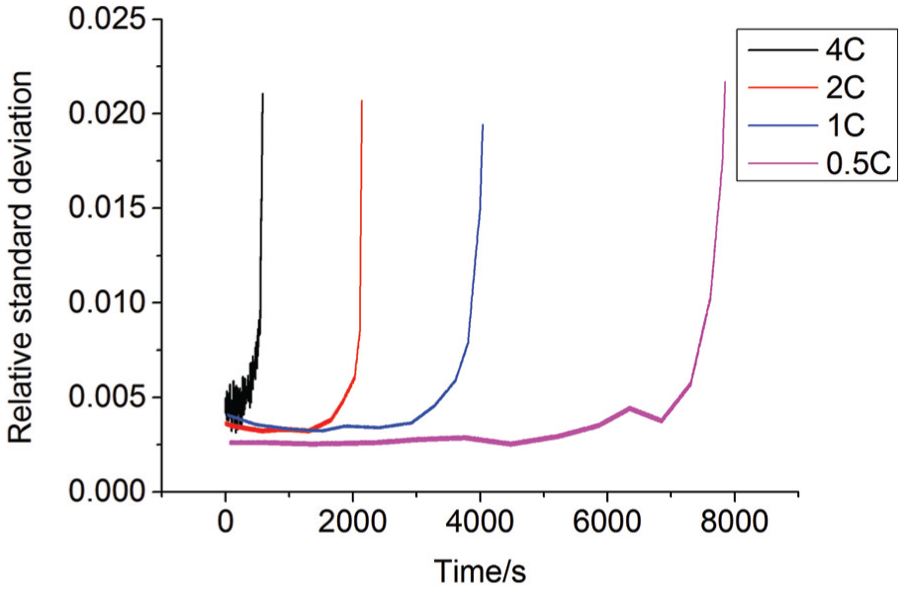
The change law of battery inconsistency in different discharge rates.

The change law of battery inconsistency in different temperatures.
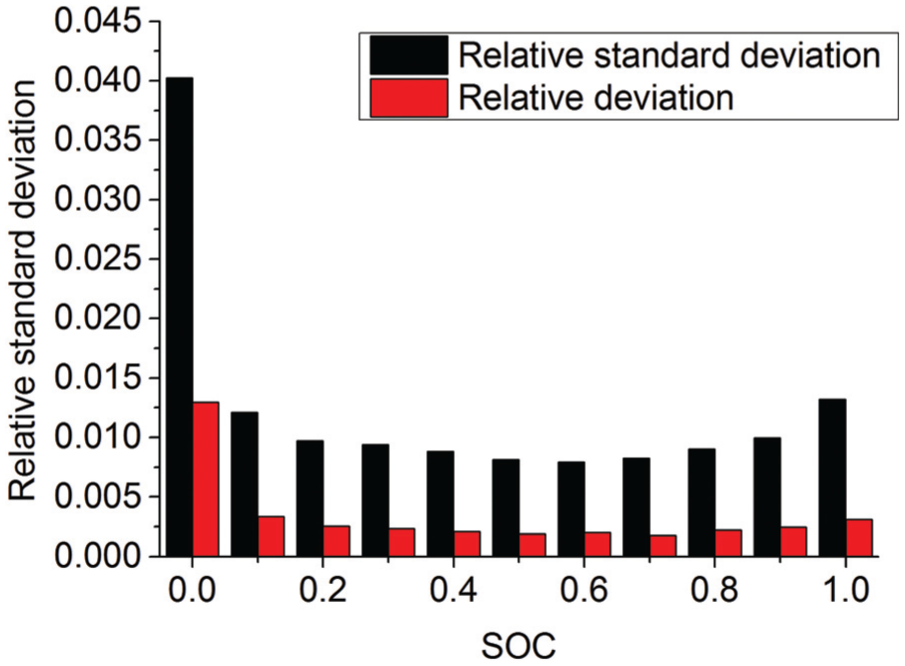
The change law of battery inconsistency in different SOC ranges.
From Figures 4–6, the consistency of the battery module is very poor at the later stage during discharge, and with the increase in the discharge rate, the consistency becomes worse. With the decrease in the temperature, the consistency of the battery pack becomes worse. Meanwhile, the consistency is better and more uniform when SOC is between 0.4 and 0.8.
In this article, when establishing the battery module capacity fade model based on the evolution of cell inconsistency, the effects of temperature and discharge rate on the battery capacity loss are analyzed with 50% DOD.
Battery capacity fade model based on cell voltage inconsistency
Based on the model established in the accelerated life experiment, battery capacity fade model based on cell voltage inconsistency is given as equation (18). In this model, the influence of inconsistency is considered as an aging factor, which is put in denominator

where t is the number of cycles and
According to the formula calculating the factor of capacity degradation caused by temperature in the accelerated life experiment, the formula calculating the factor of evolution of cell voltage inconsistency caused by temperature is deduced as equation (19)

The factor of cell voltage inconsistency caused by both temperature and discharge rate is calculated using the formula as equation (20)

Taking the cumulative effect of capacity loss into consideration, equation (21) is obtained

where
Factor of initial cell voltage inconsistency
When the discharge rate is 1C and the temperature values are 0°C, 20°C, and 40°C, the experiment based on 12-series battery is conducted to analyze how the temperature influences the initial relative standard deviation and initial relative range, and the results can be described in equation (22)

When the temperature is 20°C and the discharge rates are 1C, 2C, and 3C, the experiment based on 12-series battery is conducted to analyze how the discharge rate influence the initial relative standard deviation and initial relative range, and the results are described in equation (23)

So, the factor of initial cell voltage inconsistency caused by both temperature and discharge rate can be calculated using the relative standard deviation and relative range

Based on experiments of 12-series, 48-series, and 120-series battery pack when discharge rate is 1C, initial relative standard deviation is 0.0030, 0.0031, and 0.0030, respectively, and the initial relative range is 0.0096, 0.0095, and 0.0096, respectively, so the influence of series number on initial cell voltage inconsistency is very small.
Evolutionary factor of cell voltage inconsistency
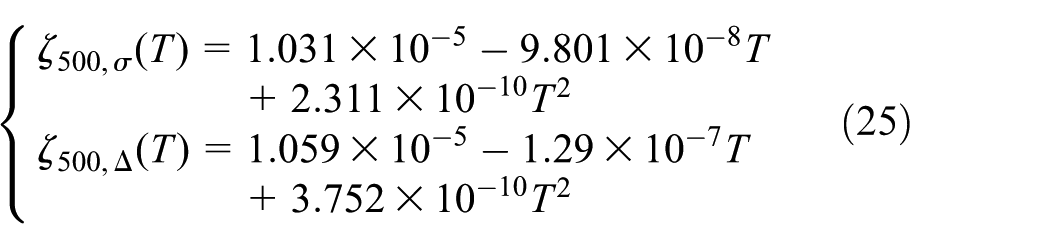
When discharge rate is 1C and the temperature values are 0°C, 20°C, and 40°C, the battery goes through 500 cycles to acquire the relation between temperature and relative range, which is described in equation (25)
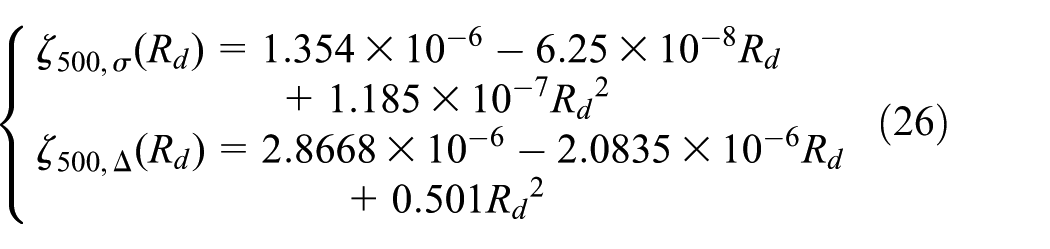
When temperature is 20°C and the discharge rates are 1C, 2C, and 3C, the battery also goes through 500 cycles to acquire the relation between discharge rate and relative standard deviation, which is described in equation (26)
According to the calculation method of factor of initial cell voltage inconsistency, the factor of cell voltage inconsistency based on standard deviation and relative range can be calculated using equation (24) with the experimental data of the 500 cycles which is described in equation (27)

Then, the evolution factor
Capacity fade model based on probability distribution
The capacity fade model based on the 12-series battery can be extended to any-series battery by means of probability theory. In this article, the probability statistics method is applied to the voltage of battery cell, and the normal distribution method is used to establish the capacity fade model of any-series battery on the basis of reliability.
Assume that the battery module is connected in series with n cells and the initial capacity of ith cell is
The theoretical capacity of the battery module is the minimum of all cell capacities. As the initial capacity of the cell capacity is very close, the rate of degradation of battery cell is only influenced by cycle parameters during test, which cannot be influenced by initial capacity, and that is to say,


According to the distribution of independent random variables, equation (30) is obtained

For the battery with cells in series connection, assuming that the battery life ends when 20% of its capacity is lost, the failure value is

where n is the number of cells and L is the cycle life. The reliability of this battery in series connection at moment t is

This model establishes the relation between life distribution and number of cells. When t is an integer, the probability of battery failure at k can be described in equation (33)

So, the average life of this battery in series connection is

The model of 12-series battery life is built based on the experimental data of accelerated life experiment using the probability theory. The calculation process is as follows


When the temperature is 20°C and the discharge rate is 0.5C and 1C, the distribution factor of battery capacity fade is


Assuming that battery life ends when it lost 20% of its capacity, the initial capacity is

And, the reliability of battery after t cycles is

When the battery is composed of 12, 48, 120, 204, and 240 cells in series connection, the relation between reliability and battery life is shown in Figure 7.

The relationship between series battery pack reliability and battery number, under the condition of 20°C and 1C discharge.
According to battery life model based on probability theory and capacity decline model based on cell voltage inconsistency, the model of capacity fade of any-series battery is established as follows
where
Result analysis from different models
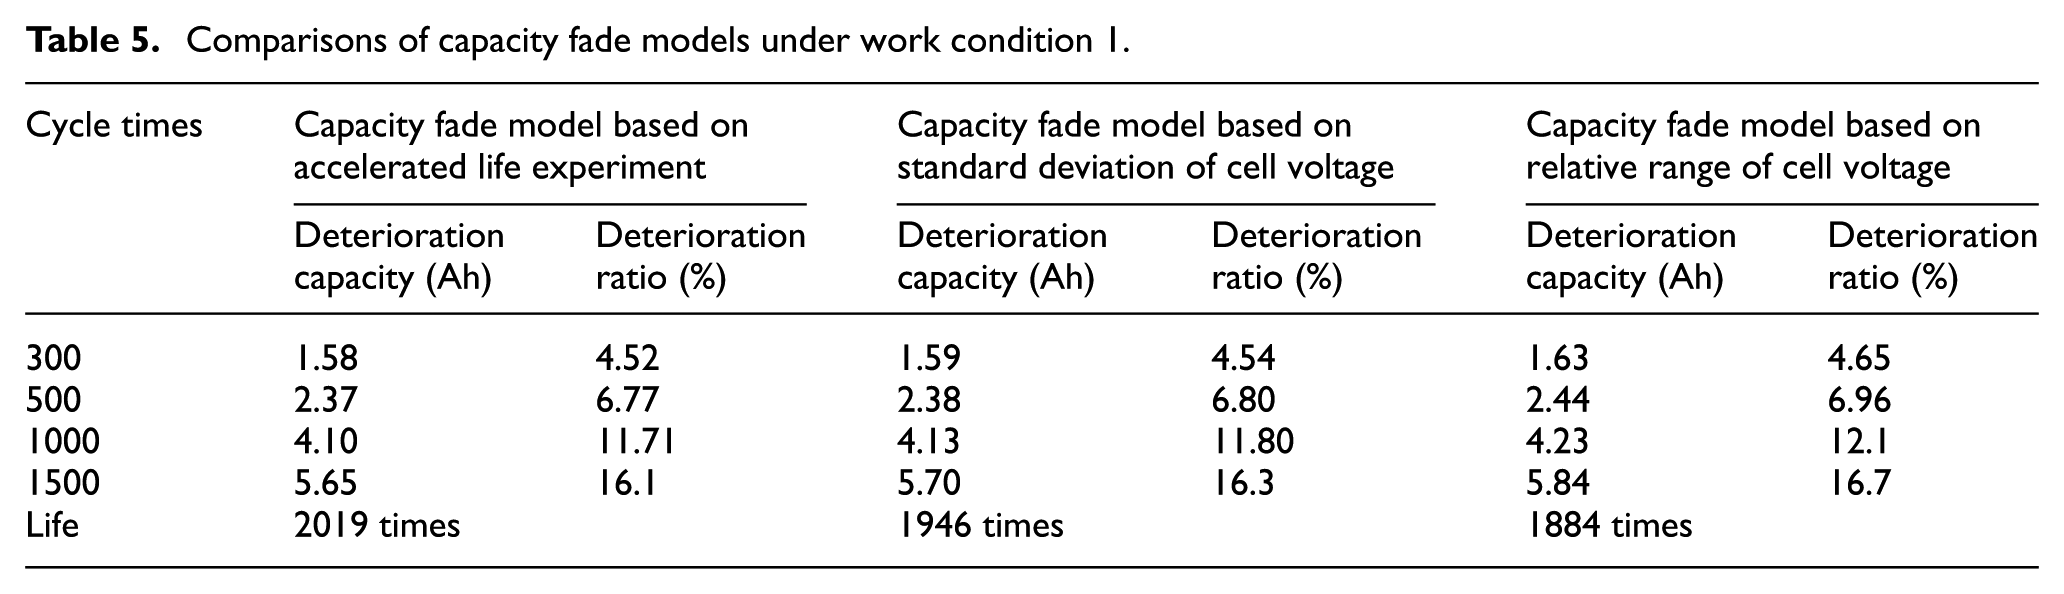
According to equation (13) of capacity fade model based on accelerated life experiments and equation (18) of capacity fade model based on cell voltage inconsistency (including two conditions of standard deviation and relative range), the characteristics of capacity fade are analyzed based on 12-series battery—see operating modes 1, 2, and 3:
Comparisons of capacity fade models under work condition 1.

The relationship between series battery pack reliability and battery number, under the condition of 20 °C and 2C discharge.
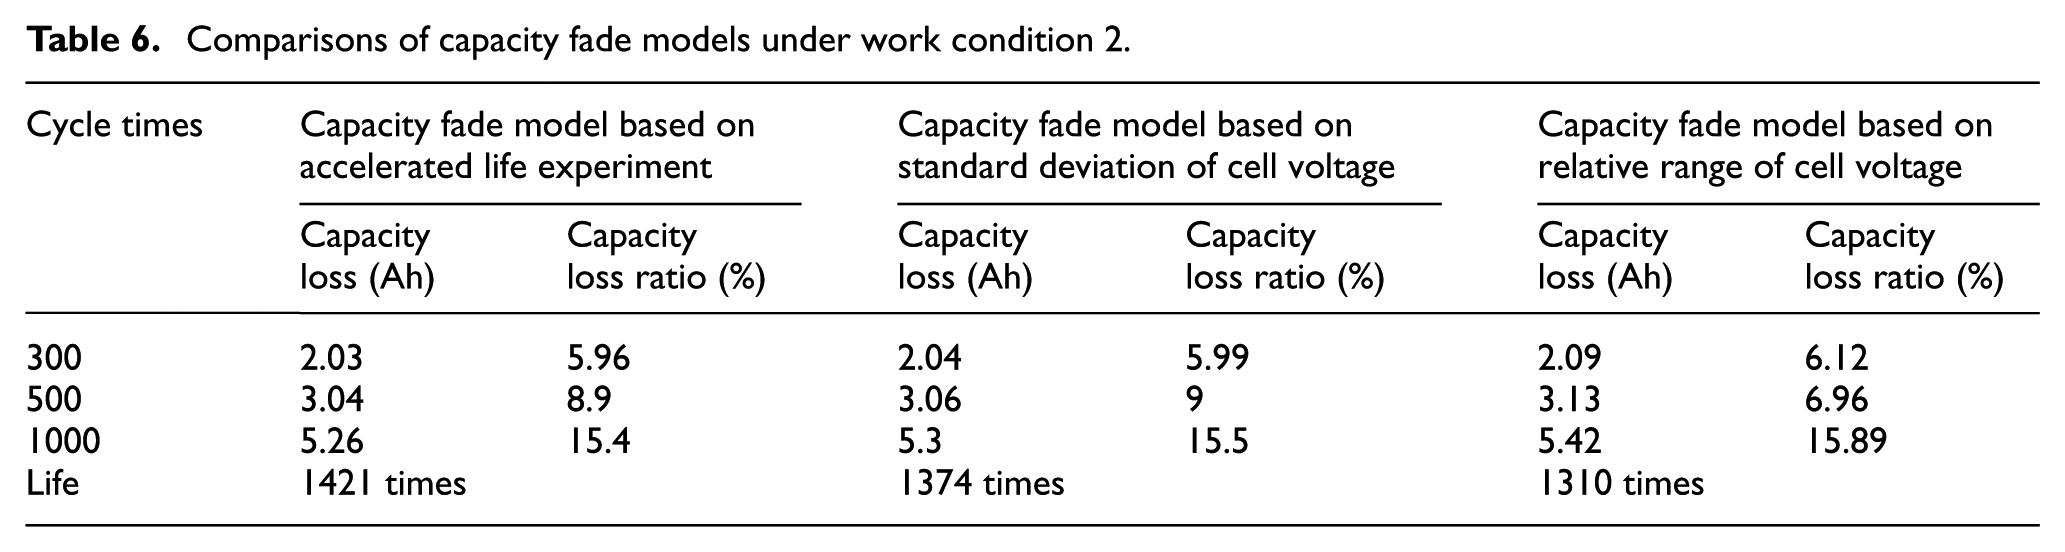
Comparisons of capacity fade models under work condition 2.

The relationship between series battery pack reliability and battery number, under the condition of 40°C and 1C discharge.
Comparisons of capacity fade models under work condition 3.

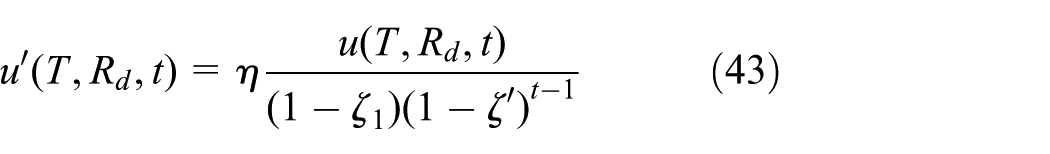
In the above models, the capacity degradation and life of 12-series battery can be acquired quantitatively, but these models do not apply to any-series battery. However, using equation (31), based on probability statistics, the life of any-series battery can be calculated, but it cannot analyze capacity degradation quantitatively. So, combine them to create equation (43) to acquire the characteristics of capacity degradation of any-number series battery.
Figure 10 shows the life of any-series battery under the above three operating modes calculated by model based on probability distribution. It can be seen that 240S battery goes through 320 less cycles than 48S battery in operating mode 1, indicating a 17.8% decrease, and 110 less cycles in operating mode 3, indicating a 17% decrease.

Life of series battery modules calculated by probability statistical model.
Table 8 shows the characteristics of capacity loss based on a combined model consisting of model based on standard deviation and model based on probability distribution. It can be seen that cycle number of 240S battery is 1457 times, indicating a 25.1% decrease when compared with 12S battery. So, the number of cells in series connection is also an important factor in determining the battery life. This may due to consistency become worse when the battery cell number increase. So, the discharge rate, temperature, and number of cells in series should be in a proper range when designing a battery pack.
Comparisons of battery modules capacity fade.

Conclusion
Based on the experiment of 12S LiMn2O4 battery, life-predicting models of battery are established taking temperature or discharging rate or both of them into consideration. Relative standard deviation of cell voltage and relative range of cell voltage are introduced to describe cell voltage inconsistency. Another two models, one based on relative range of cell voltage and the other based on standard deviation of cell voltage, are established to analyze the capacity fade of battery. The results of models are compared with each other through experiments, which show that maximum battery life is acquired using model based on accelerated life experiment and the minimum life acquired using the model based on relative range. The relative difference is less than 0.6%.With the increase in the discharge rate or temperature, the battery life shortens. Furthermore, a life-predicting model based on probability distribution is established to explain the relation between number of cells in series connection and the life of battery, which shows that the more the number of cell in series, the shorter the battery life. 240S battery life decreases 25.1% compared with 12S battery. It is clear that battery life is influenced by both number of cells in series connection and cell voltage inconsistency, so a model incorporating the two is good at predicting the life of battery.
Footnotes
Appendix 1
Academic Editor: Jose Antonio Tenreiro Machado
Declaration of conflicting interests
The author(s) declared no potential conflicts of interest with respect to the research, authorship, and/or publication of this article.
Funding
The author(s) disclosed receipt of the following financial support for the research, authorship, and/or publication of this article: This work was funded by the National Key R&D Program of China under the contract of No. 2016YFB0100305.