
Abstract
Inertial vibrations are one of the crucial problems in the chip sorting process. High acceleration excites the sorting machine structure up to high frequencies so that the multimode vibration appears. The multiple-input nature of operational excitation depends on the varying machine configurations and running accelerations. In this article, the strain gauges are used to study the dynamic behavior of a light-emitting diode chip sorting arm which runs in high speed with varying configurations. This analysis is done in three stages. In the first step, the structure dynamic characteristics are compared between the static and operation states. It points out that some high frequency may display different characteristics in the states. The second step aims to find the effects of different configurations on the sorting arm dynamic vibration during operation. In the last step, the sorting arm is sorted at different levels of running excitation, and the effects of the multimode vibration on chip accurate position are discussed. This study provides an approach to study the dynamic behavior of high-speed running structure within true boundary conditions and actual force and vibration levels.
Introduction
Dynamic errors of machine tools such as vibration are one of the crucial problems in high-precision machining. The rigid growth of technology in semiconductor has increasing demands in terms of productivity. For the light-emitting diode (LED) chip sorting and packaging equipment, the size of the wafer is increased to carry more chips. Then the sorting arm is lengthened to be able to collect more chips. The more so as expected accelerations excite the structure even more strongly. The structural modes, which one could reasonably neglect before, sometimes become very sensitive. 1 Consequently, the effects of the dominating flexibilities influence the dynamic response of the system seriously. From the structural design point of view, the structure shape and topology optimization method is the direct way to improve the vibration resistance of the structure.2,3 It is expensive and not always completely satisfactory. From the controller point of view, the vibration reduction functions in modern computer numerical controls (CNCs) can only deal with vibrations that are observable by the drive measuring systems, while they are insufficient in cases such as inertial vibrations. With a standard regulator (cascaded proportional–integral (PI) control loops), the speed loop bandwidth is limited to half the pulsation of the first mode. 1 Usually, it is the fundamental mode (at low frequency) that predominates. 4 In practice, the jerk control method proves to be a suboptimal solution to vibration reduction.
The methods mentioned above are focused on the low-frequency structure vibration. In many cases, the modal frequencies evolve with the various configurations of the axes, and several deformation modes jointly contribute to the vibratory character of the system. 5 So the structure characteristics that affect productivity and quality have to be evaluated within true boundary conditions and actual force and vibration levels. 6 But the vibration of the structure is complicated under actual operating conditions. 7 Generally, there are two types of methods to estimate the dynamics of the structure. One method is based on the computer-aided engineering. However, it is difficult to calculate the dynamic parameters with high accuracy using this method because the dynamics of the joints are complex and abstruse. 8 Another method is experiment modal analysis (EMA), which has been widely and successfully utilized to obtain multimode frequencies of a structure. It is usually performed by artificial excitation of a structure and measuring input forces and output responses of a mechanical system. 9
Compared with EMA, operational modal analysis (OMA) is a powerful tool for estimating a structure’s dynamics during operation conditions. 10 But for the flexible structure in high-frequency running state, the mass of a typical accelerometer used in these measurements can have a significant effect on the identified result. 11 Then the strain gauge does not have this limitation, and it is generally used in the structure failure detection. There is a lack of literature discussing the structure dynamical behavior on varying configurations based on the strain gauge–sensed vibration signals during high-frequency operation.
This article provides an approach to study the dynamic behavior of flexible structure in high-frequency operation based on the strain gauge–sensed vibration signals. The analysis is done in three stages: the first step compares structure dynamical behavior between the static and operation states. Through spectrum analysis of the processed signals, peak frequency shift and the magnitude variation in its peak frequency are used to point out that some high frequency may display different characteristics in different states. The second step aims to analyze the dynamical vibration of the sorting arm under different configurations. The different configurations have effects only in the operation state on the structure frequency and no effects in the static state. In the last step, the sorting arm is performed in operational conditions at different levels of running excitation. The effects of the multimode vibration and operational sources of vibration on chip accurate position are discussed.
Principle of experimental setup
The working step of the LED chip sorting and packaging equipment shown in Figure 1 is as follows: (1) rotating to position, (2) waiting for the vibration weakened, and (3) pick up the chip.

Experimental device.
The length of the sorting arm is 275 mm and its weight is 18 g. The sorting arm rotating frequency is set as 10 Hz. During rotation, the cam is lifted and pressed about 5 mm twice. If the amplitude of the vibration is bigger than 30 µm, the operation fails. Six strain gauges are located on the different points according to X- and Y-directions to detect the vibration frequency and vibration vector, as shown in Figure 2. Samples were recorded at 25 kHz. The strain mode and displacement mode are both intrinsic dynamic characteristics of a structure and they correspond to each other.

The strain gauge layout on the arm.
The relation between the nodal displacement and the strain can be expressed in a compact form as follows 12

where
The equations of motion for a finite element model can be written down as

Since the matrix
The multiple-input nature of operational excitation depends on the varying machine configuration and running accelerations. It is important to keep in mind that not all modes of machine tool structure in an analyzed frequency range affect machine quality. Only the modes, which are excited during operation, should be taken into account.
The analysis is done in three stages. To invest the dynamical behavior of the sorting arm during operation, the test in the static state is performed at first. Then the second step aims to analyze the effect of the different configurations. Finally, the effect of the different levels of running excitation on the structure frequency is analyzed. Then the chip accurate position is discussed within true boundary conditions and actual force and vibration levels.
The structure dynamic behavior on operation excitation
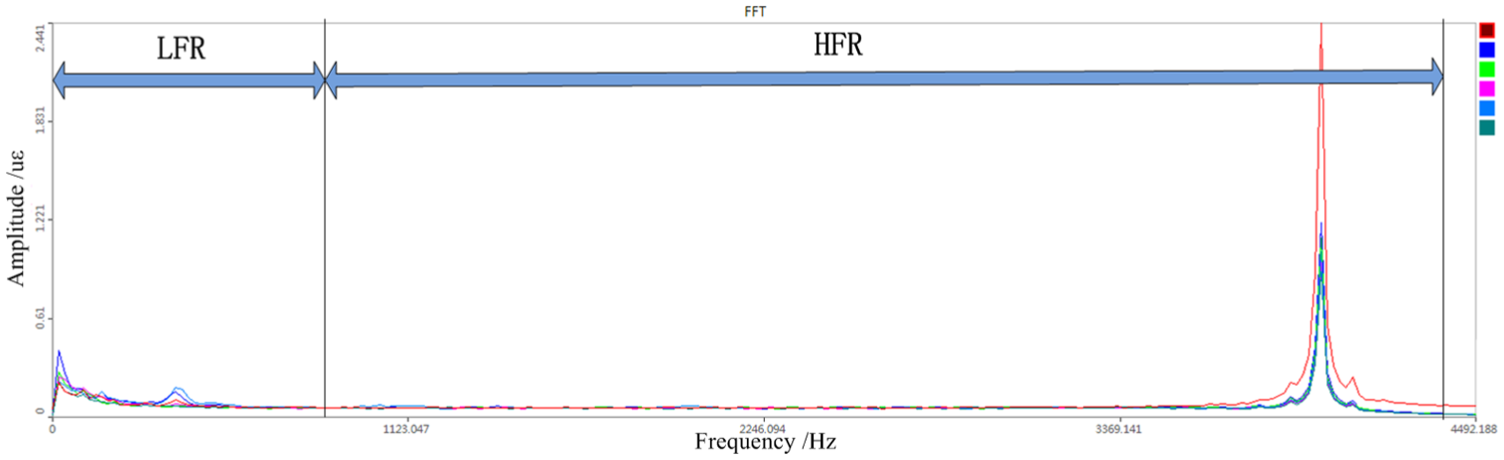
The impact tests are performed to detect the dynamical behavior in the static state. The impact hammer is executed in random sequences. From the measured response, the random decrement technique (RDT) method is used to get the impulse response signal. 13 Then the natural frequencies of the sorting arm in the static state can be identified. The spectrum of vibration in static is presented in Figure 3.

The spectrum of vibration in static.
Depending on the complexity of the structure to be tested, the hammer is impacted in three directions for the excitation of the system to excite all the modes of the system equally.
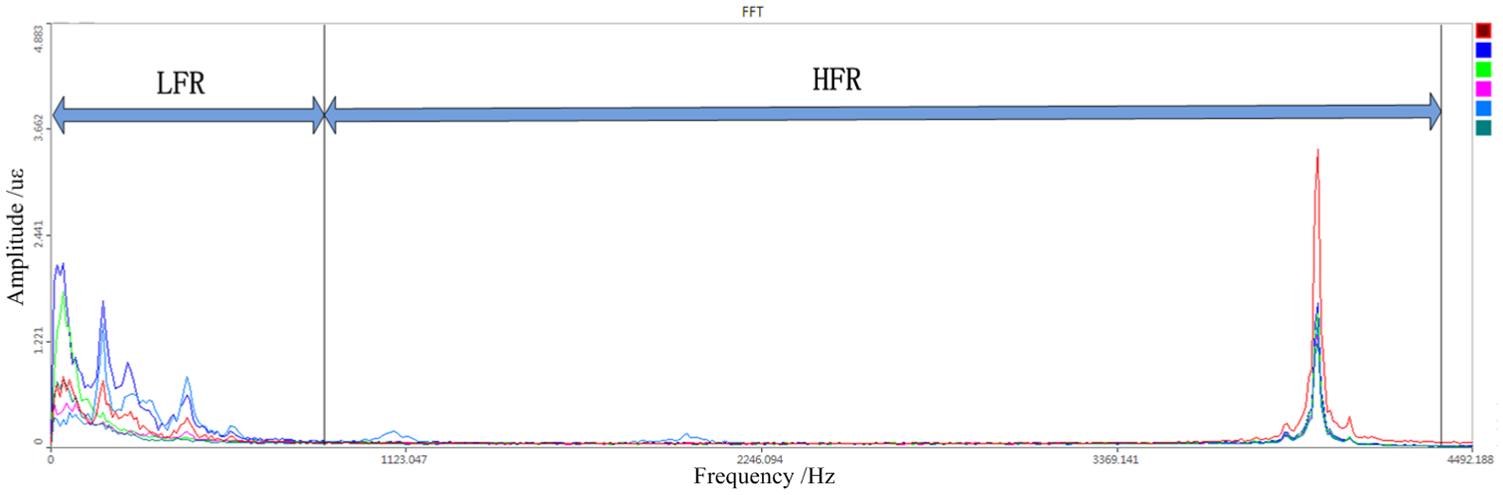
Figure 3 shows that there are two main frequency ranges: low-frequency range (LFR), with a frequency range between 0 and 800 Hz, and high-frequency range (HFR), with a frequency range between 800 and 4000 Hz. Generally, we are interested in LFR, where the basic rigidity of the sorting arm is emphasized. Figure 4 presents the spectrum of the sorting arm system response during operation.

The spectrum of vibration during operation.
Based on the spectrum analysis of the vibration response during operation, the peak frequency shift and the magnitude variation in its peak frequency are used to display different dynamic characteristics of the sorting arm in the static and operation states.
Figure 4 shows two obvious changes from Figure 3: (1) in LFR, a slight shift in the peak frequency shift and the magnitude variation in its peak frequency is observed. Increasing the frequency variation between the static and operation states shows an increase in stiffness. (2) In HFR, the magnitude variation in the fundamental higher frequency (4000 Hz) is totally different.
For the operation state, operational excitation may not have the ability to adequately excite every mode to a sufficient degree. This is especially true when the structure exhibits directional global modes or when the structure has an abundance of local modes due to appendage or subcomponent modal energy.
The fundamental higher frequency (4000 Hz) belongs to these modes that are excited during operation. The modes have direct impact on working performance which should be analyzed and should not be excluded.
The effects of the varying structure configuration on the dynamic behavior
During the operation, the sorting arm should be lifted and pressed about 5 mm. The dynamical behavior of the machine depends on the varying machine configuration during operation. Such time-varying behavior cannot be controlled by classical linear control methods, as these methods require a linear time invariant (LTI) model of the system. 14
To study this effect of the varying structure configuration on the dynamic behavior, the impact tests are performed, as follows: position 1 configuration, the sorting arm is lifted in the up position closest to the base, followed by position P2 which is pressed by the cam to a down position, as presented in Figure 5. The impact vibration experimental result is similar to that observed for these two test positions. The finite element method (FEM) model calculation results draw the same conclusion.
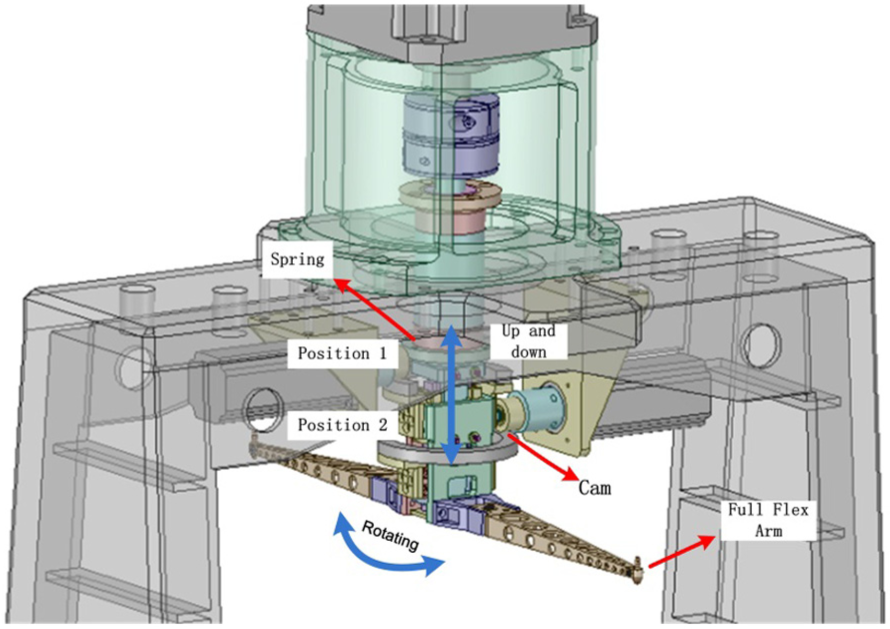
The varying configurations for the experiment.
Although the distance, 5 mm, is tiny, the up and down progresses are different. The up progress is lifted by the spring and the down progress is pressed by the cam. Because the contact stiffness of the spring and cam is different, this may cause the variant dynamical behavior of the sorting arm in operation.
The operational vibration experiments use the strain gauge to measure the response of the sorting arm. The sorting arm rotating frequency is set as 10 Hz.
Figures 6 and 7 show the strain gauge measured signal of sorting arm in the up and down progresses, respectively. We can find that the magnitudes of the detected signals from the pressing progress are much greater than those from the lifting progress.

Response signal of arm in the up progress.

Response signal of arm in the down progress.
To study the effect of the varying configurations, the time range is processed in a few overlapped frames. The frame size is 1500–2000 time points and, depending on the duration of time range, 20–25 frames are processed with an overlap of more than 50%.
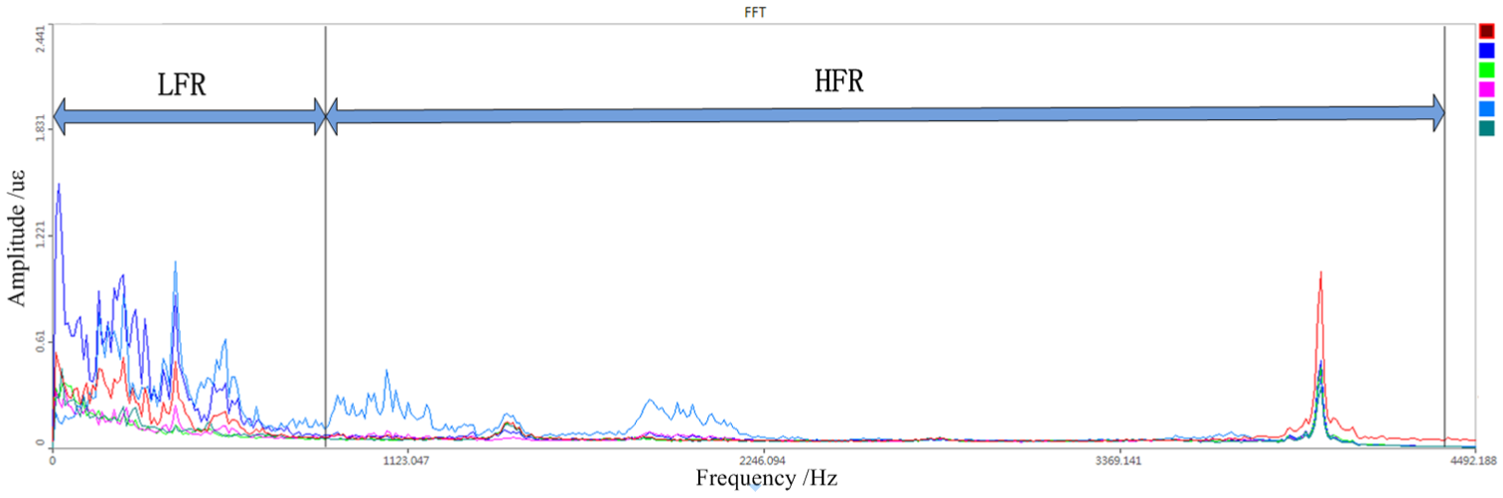
Based on the control time series of the sorting arm, the responses can be related to the corresponding structure configuration. Figures 8 and 9 present the spectrum of the arm response during the up and the down progresses, respectively. The difference between Figures 8 and 9 can be explained as follows.

The spectrum of vibration response signal in the up progress.

The spectrum of vibration response signal in the down progress.
In the experiment, it could be more realistic to consider the spring, the cam, and the sorting arm formed structure as a continuum body. During the up progress, the spring lifts the sorting arm and the vibration of the sorting arm transmits to the continuum body through the spring. Therefore, the spring absorbs the vibrations. During the down progress, the cam has greater contact stiffness than the spring. Then stronger vibration signals can be detected when the cam pressed the sorting arm. So the varying structure configuration experimental survey clearly highlights that
The varying machine configuration and running accelerations serve as the operation excitation.
The contact stiffness between the different parts determines structure vibration response during the operation.
The effects of the multimode frequency on the position accuracy
Generally, we are interested in LFR, where the basic rigidity of the sorting arm is emphasized. It is well known that a linear and time invariant system does not exhibit changes in natural frequencies and mode shapes as the amplitude of service loads increases.
Hence, important information on the structural condition might be obtained by checking the invariance of the dynamic characteristics under dynamic loads of increasing amplitude. More specifically, the time variance of modal parameters could provide the evidence of non-linear behavior.
The tests at different levels of excitation are performed. The response of the sorting arm is measured in six selected points according to the sensor layout shown in Figure 2. The rotating frequency of the sorting arm is set as 5, 8, and 12 Hz. Figures 10–12 present the spectrum of the arm response at these three excitation levels, respectively.
The spectrum of the arm response at rotating frequency of 5 Hz.
The spectrum of the arm response at rotating frequency of 8 Hz.
The spectrum of the arm response at rotating frequency of 12 Hz.
The availability of the sorting arm response at different levels of operation excitation confirms that the natural frequencies of both LFR and HFR are similar. So from the experimental result, we can conclude that this system can be considered a linear and time invariant system under different levels of operation excitation.
But the natural frequency in LFR and HFR has different characteristics under different levels of operation excitation. The magnitude variation in the peak frequency in LFR will increase as the amplitude of operation excitation loads increases. The magnitude variation in the peak frequency in HFR will decrease as the amplitude of operation excitation loads increases.
When the rotating frequency is set as 5 Hz, the vibration response of the sorting arm should be caused by the natural frequency in HFR, as shown in Figure 10. When the rotating frequency is set as 8 Hz, the vibration response of the sorting arm should be caused by the natural frequency in both LFR and HFR, as shown in Figure 11. When the rotating frequency is set as 12 Hz, the vibration response of the sorting arm should be caused by the natural frequency in LFR, as shown in Figure 12.
During the operation, the sorting arm’s multimode frequency vibrations are natural mechanism influencing position accuracy of LED chips. Then the frequency vibration in LFR may have been overemphasized on the position accuracy of LED chips.
To study the effect of the sorting arm’s multimode frequency vibrations on the position accuracy of LED chips, the chip location errors are detected, as shown in Figure 13(a). The sorting arm orientation can be captured by the high-speed camera, as shown in Figure 13(b). Then the chip locating errors are detected by the scanning camera, as shown in Figure 13(c). The location errors include X-direction error, Y-direction error, and angle error.
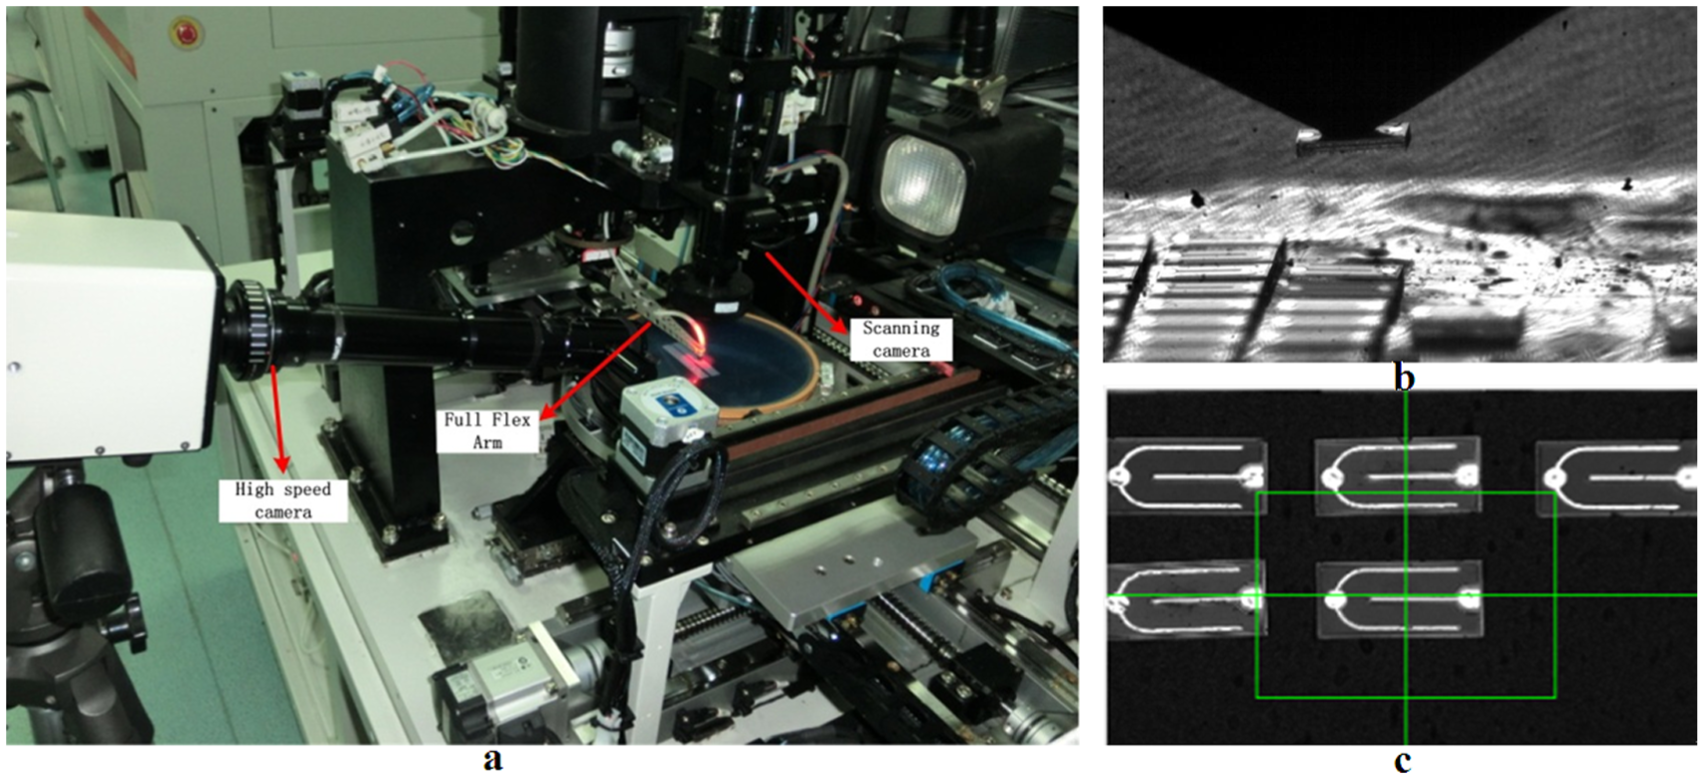
(a) The chip location detection experimental setup. (b) The high-speed camera. (c) The scanning camera.
The frequency histogram is used to plot the location errors. From the experimental result, the magnitude variations in the peak frequency in LFR and HFR have no effects on the X-direction error and the Y-direction error. But it does on the angle errors. Figures 14 and 15 show the frequency histogram of the X-direction and the Y-direction errors at the rotation frequency of 5 Hz. Then Figure 10 shows that the peak frequency in HFR determines the operation vibration response at the rotation frequency of 5 Hz.

The X-direction error at the rotation frequency of 5 Hz.

The Y-direction error at the rotation frequency of 5 Hz.
Figures 16 and 17 show the angle error at the rotation frequencies of 5 and 12 Hz, respectively. Then Figures 11 and 12 show that the peak frequencies in LHR and HFR determine the operation vibration response at the rotation frequencies of 8 and 12 Hz. So the effect of the multimode frequency on the positioning mechanism has the following features:
The peak frequency in HFR causes the bifurcation in the frequency histogram figure and determines the error distributing property.
The peak frequencies in LFR expand the error distributing range in the frequency histogram figure and influence the position accuracy.

The angle error at the rotation frequency of 5 Hz.

The angle error at the rotation frequency of 12 Hz.
Conclusion
The multimode frequency analysis and its effect on the position accuracy of flexible structure during operation have been discussed. This study provides an approach to study the high-frequency running structure dynamic behavior within true boundary conditions and actual force and vibration levels. The strain gauges are used to study the dynamic behavior of an LED sorting arm which runs in high speed with varying configurations. From this study, the following conclusions can be obtained:
In LFR, the peak frequency shift and the magnitude variation in its peak frequency take place during operation compared with the static state. In HFR, the magnitude variation in the fundamental higher frequency during operation is totally different with that in the static state.
The varying machine configuration and running accelerations serve as the operation excitation. The contact stiffness between the different parts determines structure vibration response during the operation.
The frequency in LFR and HFR has different positioning mechanisms. They determine the error distributing property and affect the position accuracy, respectively.
Footnotes
Acknowledgements
The authors are grateful to other participants of the project for their cooperation.
Handling Editor: Chenguang Yang
Declaration of conflicting interests
The author(s) declared no potential conflicts of interest with respect to the research, authorship, and/or publication of this article.
Funding
The author(s) disclosed receipt of the following financial support for the research, authorship, and/or publication of this article: The research was supported by the National Natural Science Foundation of China under grant nos 51375193 and 51405176 and the Key Projects in the National Science & Technology Pillar Program of China under grant no. 2015ZX04005001.