
Abstract
To study the effect of en-route information on driver’s route choice behavior, a dynamic route choice modeling approach is proposed, which takes the driver’s knowledge updating process into consideration. A Bayesian network is developed to describe the en-route travel time updating process. Within the framework of the cumulative prospect theory, a choice model is conducted to analyze the driver’s route choice behavior at each decision node. A numerical example is carried out to illustrate the application of the dynamic route choice modeling approach. The result demonstrates that the route choice behavior considering en-route information is a dynamic process. The traditional route choice model based on cumulative prospect theory without considering en-route information is also employed as a reference in the experiment. From the comparison, the dynamic route choice modeling approach in which a driver’s knowledge of making en-route decisions is taken into account has a better goodness of fit. A stated preference survey is carried out to investigate drivers’ route choice behaviors under different traffic scenario. The result indicates that the proposed approach could provide a more accurate description to driver’s route choice behavior under the conditions of uncertainty.
Keywords
Introduction
Driver’s travel decision could be influenced by information about the traffic conditions. Traffic information is disseminated via advanced traveler information system (ATIS) which utilizes display devices such as variable message sign (VMS), radio, navigation, or website. Traffic information notifies driver about legal speed limits, time headway, warnings in local events and is updated in a regular manner. The issue of driver’s response to traffic information attracts widespread attentions. Studies have shown that drivers are likely to respond to traffic information by changing their departure time, destination, mode, or divert to alternative routes.1–3 Such understanding has enabled the traffic management department deliver real-time traffic information to influence drivers’ travel choice to reduce traffic congestion.
For several decades, the modeling of route choice behavior has received an increasing amount of attention. A variety of theories and modeling approaches have been applied to study individual and household choice and decision-making process.4–6 In the early 1970s, the methods based on theory of social physics dominated the field of route choice analysis. Later, random utility theory (RUT) and psychological choice theory were completely developed, resulting in the wide application of discrete choice models in route choice analysis.7–9 The probit model and logit model drew much attention to its strong applicability. From the mid-1980s, the discrete choice models generalized from multinomial logit model, such as the nested logit model and the mixed logit model, which avoided the independence of irrelevant alternative (IIA) assumption underlying the multinomial logit model, became the main research approaches.10–12
Most research related to the route choice decision-making process based on expected utility theory (EUT) or RUT.13,14 These models have in common the assumption that decision makers have perfect knowledge about the attributes of their choice options. In reality, the assumption leads to many paradoxes. Simon 15 proposed that people are boundedly rational in their decision-making processes, and they tend to seek a satisfactory choice solution instead. Traveler evaluates the routes by individual experience, cognition, and attitudes which do not be considered in the EUT and RUT models. Hence, many alternative theories are proposed, for example, prospect theory (PT),16,17 cumulative prospect theory (CPT),18,19 rank-dependent expected theory,20,21 regret theory,22,23 behavioral portfolio theory24,25 and so on. Due to the prevalence in choice behavior, bounded rationality has been studied extensively in economics and psychology.
Introduction of bounded rationality into transportation originated from the need to explain experimental findings of travel behavior which cannot be captured by the traditional route choice model. 26 Mahmassani and Chang 27 first employed bounded rationality in an idealized commuting system with a single bottleneck to model pre-trip departure time choice. Since then, there are much research on incorporation bounded rationality into various travel choices, such as transportation forecasting, 28 transportation planning and designing, 29 day-to-day traffic evolution, 30 travel choice behavior,31–33 traffic assignment, 34 user equilibrium, 35 traffic mode split, 36 and traffic policy making. 37 All these studies indicate that the bounded rationality assumption plays an important role in transportation modeling.
Recently, several advanced statistical techniques have been exploded to more appropriately represent the nature of driver’s route choice behavior from investigation data. Bayesian network (BN) models have been utilized to predict travel behavior in recent years and have been demonstrated worked well. Castillo et al. 38 proposed two BN models for traffic estimation of link flow and route flow. The BN makes it possible to update the prediction from a small subset of real data to get an idea of the associated uncertainties. Li et al. 39 proposed a BN-based approach to model traveler’s travel time perception for dynamic route choice behavior analysis. The dynamic travel time perception process was described as the inference problem of BN. They found that the historical experiences, external information providing, and travelers’ current perception of travel time during the trips can be considered explicitly and simultaneously using the approach. AM Khan 40 proposed a predictive travel time methodology that featured a Bayesian approach to fusing and updating information for use in advanced traveler information system. Chen et al. 41 developed a BN-based approach to discover travelers’ opinions and preferences for toll road utilization supported by network-wide traffic information provisions. The probabilistic interdependencies among various attributes, including routing choice, departure time, traffic information dissemination mode, content, coverage, commuter demographic information, and travel patterns, were identified, and their impacts on toll road usage were quantified. The results indicated that the BN model performed reasonably well in travelers’ preference classifications for toll road utilization and knowledge extraction.
Nowadays, BN models have been constituted a widely accepted formalism for representing uncertain knowledge and for efficiently reasoning to it. A BN model is a graphical representation of a joint probability distribution, which consists of a directed acyclic graph (DAG) defined on a set of variables and a set of n conditional probability densities (CPD). The DAG contains all the qualitative information about the relationships among the variables no matter which probability values are assigned to them. The probabilities in CPD contain the quantitative information. The conditional independence relations among variables can be inferred directly from the DAG. This allows determining which information is relevant to give variables when the knowledge of other variables becomes available, and in particular, which variables contain redundant information and which ones add new information with respect to the already existing one. Besides, the updating of probabilities when having some evidence of some variables can be very easily done. 38 The main advantages of BN make the BN models be used frequently to solve a wide variety of practical problems.
The remainder of the article is organized as follows. Section “Modeling traveler’s en-route learning” first discusses the dynamic en-route knowledge updating process and then proposes a dynamic travel time updating approach by BNs. Section “Specification of bounded rationality–based route choice model” takes the travel time updating process into consideration and establishes a dynamic route choice model with the framework of bounded rationality. A numerical example is carried out to illustrate the application of the proposed method in section “Numerical example.” Limitations of the proposed method and the further research directions are discussed in conclusion.
Modeling traveler’s en-route learning
Dynamic en-route knowledge updating process
During a trip, driver keeps on updating the knowledge about the traffic system through direct observation or external information. Driver deals with the information in light of their knowledge and experiences and translates the information into the criteria that affect their choice decision-making. The detailed dynamic knowledge updating process is shown in Figure 1.

Flowchart of driver’s dynamic knowledge updating process.
A driver starts a trip from node n. The first step is to determine whether node n is a decision node. The decision nodes are defined as the set of intersections at which the driver can change the route choice plan. If node n is not a decision node, the driver keeps going and moves to the next node n = n + 1 until the node n is a decision node. Then, the driver continues to determine whether node n is the last decision node. If it is, then the dynamic updating process is finished; if not, the driver’s criteria affecting the route choice decision is updated based on the information including external traffic information and travel experience, which are denoted by
Background about BNs
A BN, which is also known as belief network or Bayesian belief network, is a probabilistic graphical model that represents a set of random variables and their conditional dependencies via a DAG. The nodes in a BN represent a set of random variables,
Learning the structure of BNs
The aim of structure learning is to search for the optimal topological structure that presents the associations among the variables. There are two broad approaches for learning the structure of BNs. One is constraint-based approach. Structural learning starts with a fully connected graph and removes edges if certain conditional independencies are measured in the data. This has the disadvantage that the repeated independence tests lose statistical power. The alternative approach is search-and-score approach. Structure learning performs a search through the space of possible DAGs, scores a BN based on how well it fits the data, and attempts to produce one that optimizes that score. This approach either returns the best BN structure or returns a sample of the models found. Since the amount of DAGs is super-exponential as the number of nodes in BNs increases, exhaustively searching the space is hard to achieve; therefore, instead heuristic search algorithms are employed in practice. One popular choice is hill-climbing algorithm which is started from either an empty, full, or possibly random network. The algorithm’s main loop consists of attempting every possible single-edge addition, removal, or reversal, making the network that increases the score the most the current candidate, and iterating. The process stops when there is no single-edge change that increases the score. 43
The K2 algorithm is the most prevalent approach for BN structure learning. It is a greedy searching algorithm and works as follows. Initially, each node has no parents; it then adds the parent incrementally whose addition most increases the score of the resulting structure. When the addition of no single parent can increase the score, it stops adding parents to the node.
Learning the parameters of BNs
Learning the parameters given a fixed network structure is a well-known problem in statistics. Maximum-likelihood estimation (MLE) is the most-used method of parameter learning when the data set is complete. Given a BN structure G on a set of variables X and a data set D of cases. Πi is the set of parents of node xi; the associated joint distribution is written as

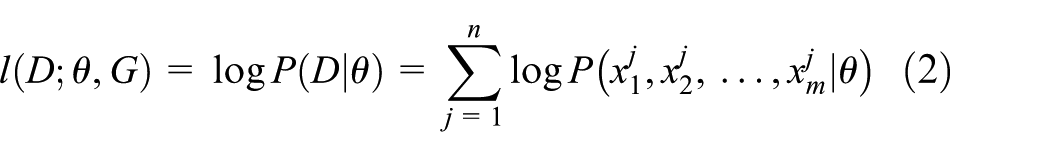
Given the complete data D, the log-likelihood function is
Let

where n(xi, πi) is the number of observed instances with a particular setting of the variable and its parents.
Inference from BN as travel time perception
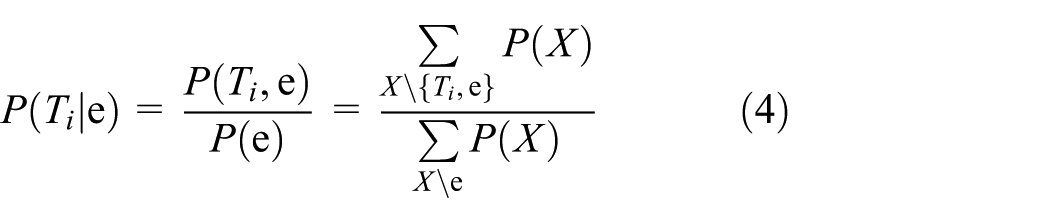
The basic task for any probabilistic inference is to compute the posterior probability distribution for a set of query nodes, given values for some evidence node.
44
In our problem, the probabilistic inference is to compute the posterior marginal of travel time given
Specification of bounded rationality–based route choice model
PT and CPT
PT was put forward to describe decision-making behavior under uncertainty. PT assumes that a choice process is composed of two phases: framing and evaluation. In the phase of framing, a preliminary analysis of the offered prospects is conducted, which yields gains or losses with probabilities of these prospects. The function of the frame phase is to organize and reformulate the options so as to simplify subsequent evaluation and choice. The major operations of the frame phase are summarized as coding, combination, segregation, and cancelation. In the evaluation phase, the edited prospects are evaluated, and the prospect with the highest value is selected.
CPT is an extension of PT. It can be applied to uncertainty as well as risky choice situations, and it can always satisfy stochastic dominance. The most prominent difference between CPT and PT is that the former applies the cumulative rather than single decision weights separately to gains and to losses.
Route choice model framework
In this section, we will specify the bounded rationality–based route choice model within the framework of CPT.
Many previous researches have demonstrated that people normally perceive outcomes as gains and losses, rather than as final states of wealth or welfare. Gains and losses are determined relative to some neutral reference point. When we respond to the travel time of alternate routes, the past and present experience is regarded as the reference point, and stimuli are perceived in relation to this reference point. 45
The overall value of an edited prospect is expressed in terms of π and ν. Kahneman and Tversky named ν as value function, which assigns to each outcome x a value to reflect the subjective value of the outcome. The value function is defined as

where x is defined as the deviation from the reference point. α and β are risk attitude coefficients and are 0.88 for both gains and losses. λ is the coefficient determining the shape of the value function and is 2.25. 18
π is defined as the cumulative weighting function, which associates with the probability p of each outcome x. The weighting function reflects the impact of p on the overall value of the prospect. The cumulative weighting function is applied separately to gains and to losses. It is defined as
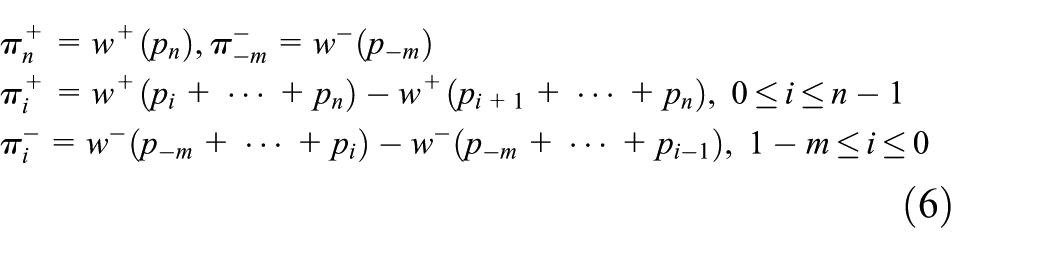
The decision weighting π, associated with a positive/negative outcome, is interpreted as the marginal contribution of the respective event and defined in terms of the capacities w+ and w−. 18 The capacities w+ and w− are expressed as follows

where w+ and w− are strictly increasing function satisfying w+(0) = w+(0) = 0 and w+(1) = w+(1) = 1. γ and δ indicate the level of distortion in probability judgment and are 0.61 and 0.69, respectively.
Route choice behavior is described by the multinomial logit model in our study. The probability of choosing route k can be represented as

where

where kn is a symbol for various interactions of CPT model coefficients with traveler’s characteristics. The other coefficients are defined above.
Numerical example
Data description
The data used in this example are collected by a field investigation. Since the quantity of the field investigation data is not sufficient, we expanded the sample size by a simulated experiment using VISSIM. A field survey was conducted to collect the traffic flow data (contains traffic state data and travel time data) and the geometric properties data of each link on the network before the simulation experiment. The traffic state and travel time data of each link were collected at interval of two minutes by the simulation experiment. The network is shown in Figure 2, which is a topological structure of the main links from Xinjiekou to SiPailou of Nanjing. There are 10 nodes and 12 links in this network. All the decision nodes are equipped with VMS which is used for traffic information publishing. The input variables of the simulation experiment contain link length, number of lanes, lane width, and traffic volume.
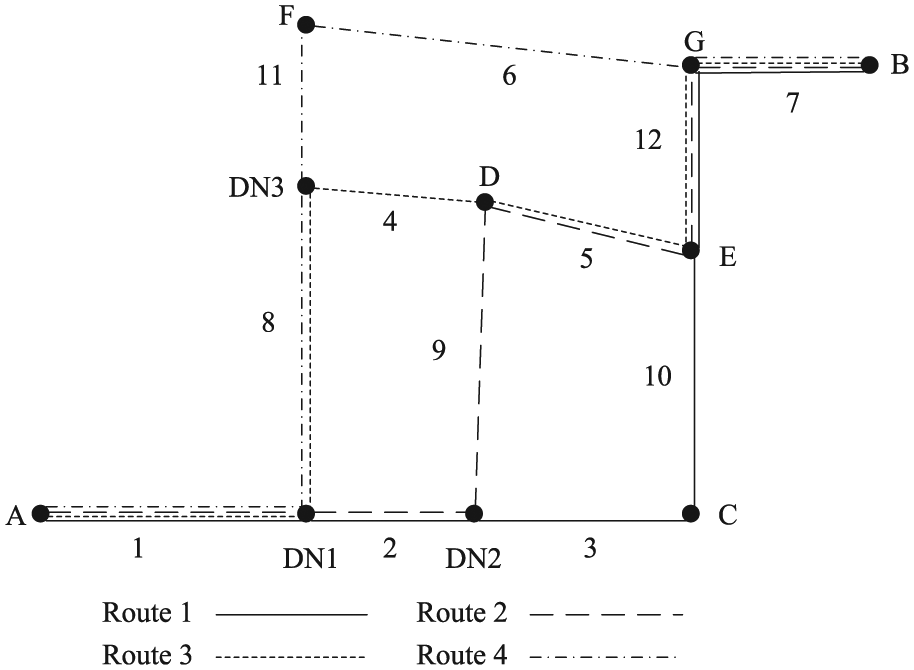
Network used for study.
There are three origin and destination pairs in the network {(A, B), (C, B), (F, B)}. We only consider the trip from node A to node B with the following routes: {1+, 2+, 3+, 10+, 12+, 7+}, {1+, 2+, 9+, 5+, 12+, 7+}, {1+, 8+, 4+, 5+, 12+, 7+},{1+, 8+, 11+, 6+, 7+}. The sign given for each link denotes the direction. We consider that the link from left to right and down to up is with positive sign. There are 278 observations during the simulation period. All of these observations share the four routes shown in Figure 2. The VMS shows green, yellow, and red, respectively, to represent the link traffic state of uncongested, slow, and congested.
Dynamic en-route knowledge updating
The BN structure developed for this network is displayed in Figure 3. The method of structure learning is K2 algorithm which was explained in section “Background about BNs.” The BN is composed of 13 nodal variables. Variable U, which indicates the level of total traffic demand in the traffic network, depends on the time of day. In this example, variable U has three states—state 1: peak hours (7:00–9:00, 16:30–19:00), state 2: flat hours (9:00–16:30), and state 3: valley hours (19:00–7:00). Variable Si represents the traffic state of link i. The traffic state is determined according to the link speed estimated using the simulation data. Variable Si has three categories—state 1: uncongested (speed > 40 km/h), state 2: slow (20 km/h < speed < 40 km/h), and state 3: congested (speed < 20 km/h).

The travel time BN structure of the network.
We now use the proposed method to discuss the driver’s route choice behavior considering the en-route knowledge updating. The reference point of each link is set to the mean of travel time under the three traffic states.
The parameters of the BN in Figure 3 are obtained by importing the collected data into the Bayes Net Toolbox (BNT), which is an open source MATLAB package. 21
Driver’s knowledge about updating of travel time perception for each link can be inferred by the developed BN. At each decision node, the driver’s knowledge about the link traffic state is updated by experiences and VMS information. The experiences and VMS information are described by the evidence entered into the BN. In the illustrative network, when a driver arrives at node A, the information known is the current time period. For example, assuming the traveler arrives at node A is 8:30, then the evidence is
The updated perceptive travel time distribution at node A.

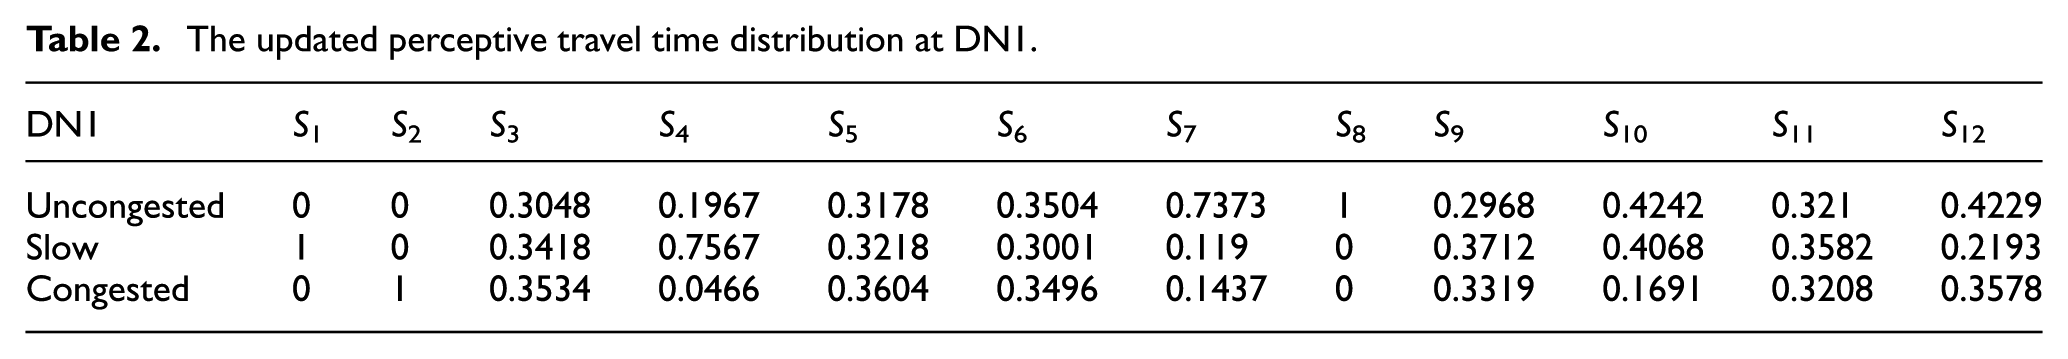
A VMS is installed at DN1 and shows the traffic states of downstream links. Because the driver has passed link 1, the traffic state of link 1 is known. During the peak hour, the VMS shows that link 2 is red and link 8 is green. Then, the evidence is
The updated perceptive travel time distribution at DN1.
The driver then continues the trip and arrives at DN3. The VMS installed at DN3 shows that link 4 is green and link 11 is yellow. Then, the evidence is
The updated perceptive travel time distribution at DN3.

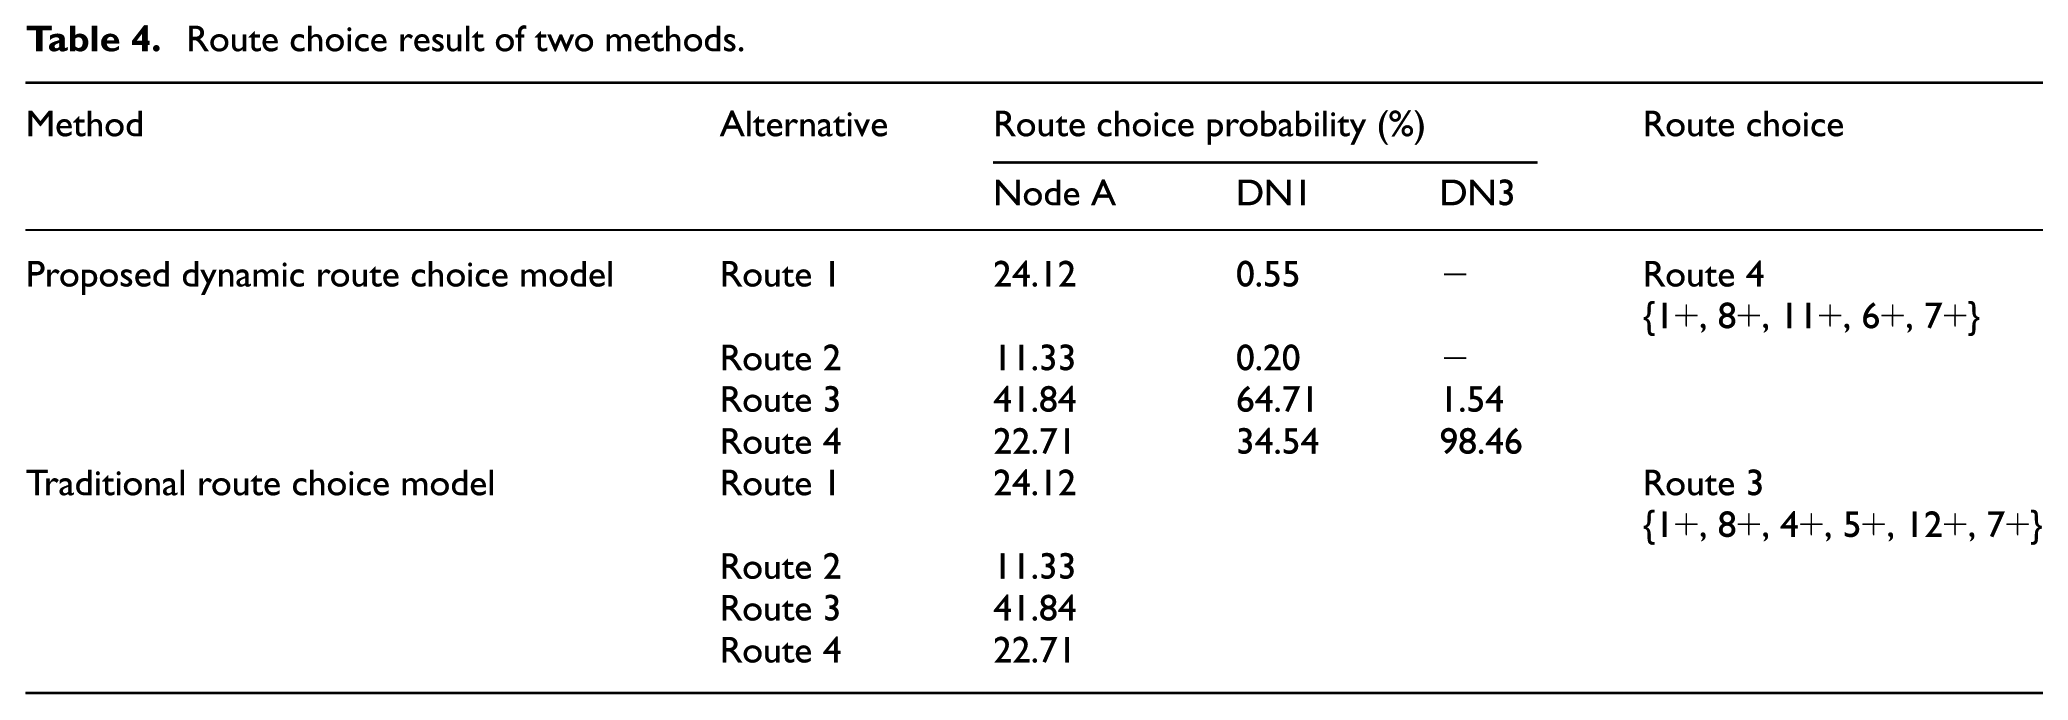
If there is no VMS to release traffic information, how does driver make route choice? The traditional route choice model based on CPT is carried out to discuss the route choice behavior without considering traffic information. In this example, it equals to the situation that a driver makes route choice decision at node A and cannot get any information about the traffic network during the trip. The cumulative prospect values of the four routes are −8.5245, −9.2800, −7.9737, and −8.5844, respectively. The selected probabilities of the four routes are 0.2412, 0.1133, 0.4184, and 0.2271, respectively. It means that the driver chooses Route 3 before the trip and insists on this route until he/she reaches the destination. Table 4 is the route choice results of the traditional route choice model and the proposed dynamic route choice model. We can see that the proposed dynamic route choice model taking knowledge updating into account treats driver’s route choice behavior as a dynamic process. Drivers constantly get experience and traffic information, and their knowledge to the traffic network keep on updating during the trip. So, drivers adjust their route choice decision at every decision node. The traditional route choice model treats driver’s route choice behavior as a static process. Drivers only make route choice decision once at the original node and do not change their decision throughout the trip.
Route choice result of two methods.
Analysis of route choice behavior
From the analysis of section “Dynamic en-route knowledge updating,” we can see that the driver makes a route choice decision at the original node and will not change the route during the trip without considering the effect of traffic information. With the real-time traffic information released by VMS, driver will update the knowledge of the traffic network at every decision node and make a new route choice decision based on the updated knowledge. It is obvious that the traffic information has important influence on route choice behavior.
A stated preference (SP) survey was developed targeting Nanjing drivers to verify the effectiveness of the proposed method. The survey was designed to measure drivers’ attitudes toward traffic information and to determine how existing traffic information affects their route choice behaviors. The survey targeted a random sample of adult drivers in Xinjiekou area was conducted from 20 May 2013 to 27 May 2013, which contained the weekday and weekend. A total of 303 respondents were interviewed, and 254 questionnaires were returned. The effective rate of the questionnaires is 83.7%.
In this survey, respondents had to indicate how they chose their route when they faced with different traffic information issued by VMS. The questionnaire consists of three parts as follows:
Socioeconomic characteristics, including gender, age, education, driving career, and monthly personal income;
Travel characteristics, including the most frequent purpose of travel, travel time period, the traffic conditions most often encountered, familiarity with local road network, the attitude toward the external traffic information, the external traffic information sources most often used, and the error tolerance of the travel time prediction;
Experimental scenario: respondent was provided with experimental scenario and had to choose a route among four routes. Only when the driver arrives at the decision node, he/she can get the information shown on the VMS which is installed at the decision to show the traffic state of link. The experimental scenario is explained as follows: driver starts a trip at 8:30. The VMS installed at DN1 shows that the traffic state of link 2 is yellow and of link 8 is green. The VMS installed at DN2 shows that the traffic state of link 3 is red and of link 9 is green. The VMS installed at DN3 shows that the traffic state of link 4 is red and of link 11 is yellow. The choice was multinomial. Route 1 was customized according to each respondent’s primary route as to make the survey as realistic as possible, while Route 2, Route 3 and Route 4 were hypothetical.
In our survey, approximately, 52.4% of the respondents were male, and the majority fell between 30 and 40 years old (82.8%). A large proportion of the respondents (60.9%) had bachelor or above degrees, and most were skilled drivers having 5–10 driving years (48.6%).
The most common trip purpose was commuting; it indicated that the driver’s route was relatively fixed and was hardly affected by traffic information. Most respondents thought that the accuracy of the traffic information shown on VMS was imprecise, and this may be the reason that the frequency of VMS usage was low in this survey. In addition, 48.4% of the respondents perceived the error tolerance of the travel time prediction to be between 5% and 15%, which indicated that most drivers accepted a certain range of travel time prediction error. More than 40% of the respondents were familiar with the local road network. This finding implied that more traffic information should be offered to change the drivers’ routes to favor the use of alternate routes. Otherwise, a driver who had already driven on a definite route would not generally be inclined to choose another route.
Table 5 shows the comparison results of driver’s route choice behavior by tree methods. The proportion of each route by SP survey reflects the true will of driver’s route choice behavior. The result obtained by the proposed model is closer to the results of SP survey than that of the traditional route choice model. It indicates that the proposed method is better than the traditional method in studying route choice problem. Using the proposed method to analyze route choice behavior with consideration of dynamic knowledge updating is feasible in both theoretical and practical significances.
The results of the selected probability of three methods.
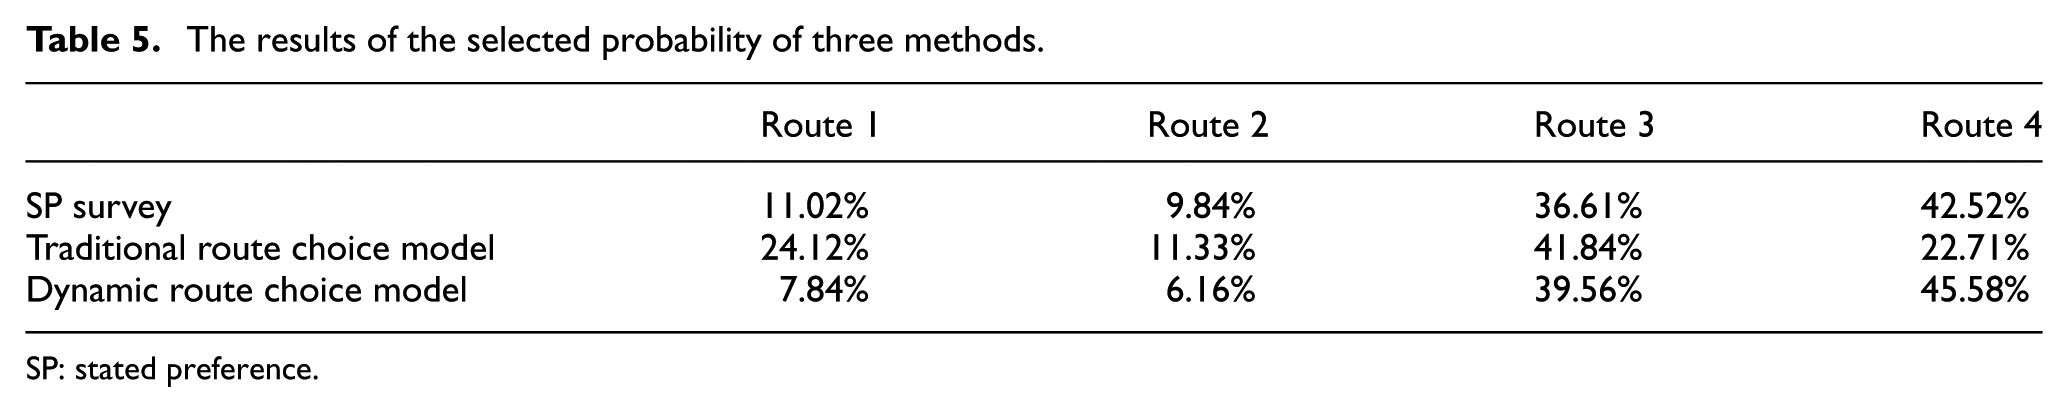
SP: stated preference.
Conclusion and future research
The primary objective of this article is to develop an effective route choice behavior analysis approach to provide accurate and reliable route choice forecasts. In contrast to most existing methods that analyze route choice behavior by EUT-based discrete choice model, the proposed method views the route choice behavior as a dynamic process because the travel time of each alternate route keeps on updating throughout the entire trip, and driver makes route choice decision at every decision node. Based on the above cognitive, a dynamic route choice model embedding BN within the framework of CPT is proposed, which considers driver’s en-route knowledge updating process because of driver’s experience and external traffic information. The Bayesian inference–based method is suitable for travel time prediction because it fully utilizes historical travel information and is computationally efficient in updating travel time prediction. The bounded rationality–based route choice model reflects driver’s behavior under the conditions of uncertainty more realistic. The proposed method can also solve the problem of driver heterogeneity by identifying different reference points.
Using the proposed dynamic route choice model, a case study over a small network is performed. The different scenarios demonstrate that the travel time updating process represented by BN is appropriate. In particular, the case study results show that the proposed method considering dynamic knowledge updating outperforms the bounded rationality method on the prediction accuracy of driver’s route choice behavior.
The proposed method is appropriate for exploring driver’s dynamic studying behavior and decision-making behavior under the bounded rational framework. Some directions for the further study can be suggested. We have only verified the viability of the proposed method on a small network. More empirical studies on a larger network are needed to verify the effectiveness and to improve the accuracy of the proposed method in the next phase.
Footnotes
Acknowledgements
The authors thank Dr Muqing Du who has provided essential suggestions and critically revision to our research.
Academic Editor: Xiaobei Jiang
Declaration of conflicting interests
The author(s) declared no potential conflicts of interest with respect to the research, authorship, and/or publication of this article.
Funding
The author(s) disclosed receipt of the following financial support for the research, authorship, and/or publication of this article: The key National Natural Science Foundation of China (No. 51338003), the financial support from the National Key Basic Research Program of China (No. 2012CB725402), the National Natural Science Foundation of China (No. 51508122, 51508094), and the Natural Science Foundation of Jiangsu Province (No. BK20150817) are gratefully acknowledged.