
Abstract
Understanding how evacuees use real-time traffic information is crucial for developing effective emergency evacuation response plans for hurricane-prone areas. This paper investigates how such data were used during past hurricane evacuations and post-evacuation returns in Texas with a survey dataset collected between August 2022 and February 2023. We examined the usage patterns of various platforms, including navigation apps, social media, TV, radio, and information provided by public agencies. We found that a larger household size, longer distance to evacuation destinations, and past experience with hurricane evacuations are associated with greater use of real-time information platforms. Experienced evacuees tend to rely on navigation apps and social media, and those with experience before 2010 are more inclined to use the TV and radio as their primary sources of information. Motivation for using these platforms varies among users of different platforms. Although both navigation app users and social media users value their familiarity with the platform, the former also prioritize the convenience of using it. It was also found that TV users prioritize service accessibility, radio users emphasize service availability, and users of official agency information sources place a high value on data accuracy. These findings have implications for policymakers, emergency planners, and traffic engineers involved with disaster response operations to improve the resilience of transportation systems.
Keywords
Hurricanes are severe natural disasters that occur in the North Atlantic Ocean (1–3). The Texas coast along the Gulf of Mexico is frequently exposed to tropical storms and hurricane events (4–6). Hurricanes pose a threat to life, property, and public infrastructure as a result of inundation caused by heavy rainfall or storm surge, and flying debris caused by high wind speeds. To protect human life against these hazards, mass evacuations are used to relocate large populations away from exposed locations to areas of safety. As these emergency evacuations involve many vehicles and operational challenges, it is necessary for public agencies to ensure that evacuations are as safe and efficient as possible. To assist evacuees better, state transportation departments and other public agencies have developed emergency evacuation plans and disaster response strategies. These include issuing mandatory evacuation orders and providing evacuation resources to the public such as designated evacuation route maps, zones for staged evacuation departure timing, dynamic message signs (DMSs) to disseminate information, and more ( 3 , 7 ). Members of the public prefer to collect information from multiple sources, the number of which is continually growing with the advancement of technology ( 8 , 9 ). Real-time traffic information gathered from platforms such as mobile phone navigation apps, social media websites, TV, radio, and official government or agency platforms is very important for households planning their evacuation, adjusting their routes during it, and in their return home post-hurricane (10–12).
Travel behavior during evacuations is markedly different than that under normal conditions. Therefore, understanding the adoption and utilization of real-time traffic monitoring system data is important for policymakers, traffic engineers, and emergency management staff so they can plan and manage evacuations effectively. Whereas many papers have discussed evacuee and non-evacuee behavior in hurricane-prone areas of the U.S.A. ( 1 , 4 , 13 , 14 ), only a limited number of studies have investigated the adoption of real-time traffic information, the motivations for its use, and the challenges encountered ( 15 , 16 ). This study focuses on understanding the utilization of real-time traffic data platforms during hurricane evacuations and residents’ subsequent return in past hurricane events in Texas, based on a survey conducted between August 2022 and February 2023. We investigate households relying on real-time traffic information platforms further by incorporating socioeconomic data and the evacuation behavior of evacuees.
The remainder of this paper is organized as follows. First, we discuss the relevant literature. We then describe the survey design and data collection. Next, we introduce our models and discuss our findings. We conclude by summarizing our results, outlining the limitations of the study, and describing the implications of the findings.
Literature Review
Real-Time Traffic Information during Evacuations
Dow and Cutter ( 7 ) analyzed longitudinal survey data from South Carolina in 2000 and found that information on traffic conditions was very or extremely important to over 90% of the 536 survey respondents, who thought it was very important to provide evacuation route information over the radio. Ye et al. ( 3 ) examined rural transportation infrastructure during evacuations by surveying government officials in the northern Gulf of Mexico (Florida to Louisiana). Data were limited, but they concluded that DMSs were best way of controlling traffic, followed by channelization devices and traffic signs, and that the TV was the most efficient emergency communications tool. Robinson and Khattak ( 17 ) surveyed over 800 evacuees from Hampton Roads, Virginia, and found that commercial radio reports and DMSs were the most common source of traffic information during evacuations, and that a third of drivers used mobile phones, in-car global positioning systems, or the internet.
Stated choice studies generally suggest that more information is better ( 7 , 11 , 17 ), but Stephens et al. ( 12 ) considered “overload perception,” a situation in which evacuees are frustrated by too many messages. The authors found that sending messages through different channels and using at least one synchronous communication source increased perceived urgency. Similarly, Luo et al. ( 11 ) found that additional information sources increased the odds of participants taking protective actions during tornados, corroborating Stephens and Rains ( 9 ) and Westerman et al. ( 18 ).
DeYoung et al. ( 16 ) found women were more likely to seek information from multiple sources, most participants preferring the radio and TV as information sources, and non-White respondents preferring information from the community or local governments. Bian et al. ( 13 ) constructed multinomial logit models using evacuation data from Hampton Roads, and found that real-time travel information influenced evacuation, departure time, and route choice decisions. They suggested that the provision of information on hotel and shelter availability might be important, because families were often less confident about their destinations.
This paper complements existing literature by specifically considering navigation apps and social media, which have been gaining popularity in recent years.
Broader Issues
Given the limited empirical studies when understanding the usage of real-time traffic information platforms during evacuations, it is imperative to incorporate additional factors related to evacuation decision-making. Notably, those who consider using real-time traffic information during an evacuation typically belong to the group that decides to evacuate, and such information may significantly influence their ultimate decision as to whether to evacuate. Wong ( 19 ) identified three critical evacuation challenges: persistent noncompliance with mandatory evacuation orders; inefficient transportation responses; and insufficient attention to vulnerable groups. To address these issues, he suggested implementing a sharing economy strategy during evacuations, and he also recommended using low-tech communication and matching methods to improve compliance, leveraging community-based networks to distribute information, and deploying transportation responses during the night. Refueling is an important factor during evacuations, and Bian et al. ( 20 ) analyzed data from SafeGraph, revealing a surge in gas station visits during the two days preceding a storm landfall. Their findings indicated that zones characterized by higher vehicle ownership, more daily commuters, lower residential stability, and a higher number of mobile homes would be more prone to experiencing elevated fuel demand. Departure time is also crucial. Pham et al. ( 21 ) and Alawadi et al. ( 22 ) examined factors affecting departure time in the context of the Hurricane Matthew evacuation. Relevant determinants included past evacuation experience, receiving an evacuation order, evacuation destination, and social influences. A mandatory evacuation announcement, housing structure type (e.g., mobile home), perceived individual risk exposure, and observed storm intensity are all leading indicators when predicting evacuation likelihood ( 23 , 24 ). There is also an interesting discovery that households with previous evacuation experience were less likely to evacuate ( 1 ). Possible underlying reasons for this could be the challenges or exposure risks associated with evacuating individuals who have undergone the process before. These findings underscore the significance of the variables selected according to the purpose and motivations for using these real-time traffic information platforms in the Survey Design and Data Collection section. Although there is a dearth of previous studies, we think socioeconomic and demographic variables also play a pivotal role in the selection of real-time traffic monitoring platforms. Notably, Jiang’s study ( 4 ) reveals that individuals under 54, those with a larger household size, a household income greater than $50,000, females, White people, and homeowners are more inclined to evacuate during evacuations.
After examining these issues, we have taken them into account during our variable selection process in the Data Collection and Methodology section.
Data Collection and Methodology
Survey Design and Data Collection
We developed a web-based survey and distributed it to residents in Texas from August 30, 2022 to February 22, 2023, resulting in 1,510 valid responses. The survey was advertised on the social media platform Nextdoor with assistance from the Texas Department of Transportation (TxDOT), and distributed to individuals with a Texas driver’s license through emails obtained from the Texas Department of Public Safety database. Of the 1,510 observations, 889 (58.9%) respondents reported having previous hurricane evacuation experience, which serves as the main focus of our study. The remaining 41.1% indicated no previous evacuation experience either because they chose not to evacuate based on personal decisions or they never received any evacuation orders (e.g., reside in hurricane-free areas).
The survey had two main sections: the first collected respondents’ socioeconomic and demographic information; and the second covered hurricane evacuation behavior and real-time data platform preferences, including platforms used, challenges encountered, and suggestions for improvement. The survey could be tailored to different respondents to reduce fatigue while answering questions; in addition, respondents indicating they had participated in a past hurricane evacuation were provided with different questions from those who had not. Therefore, the total number of questions in the survey varied according to user, with a maximum of 32 questions.
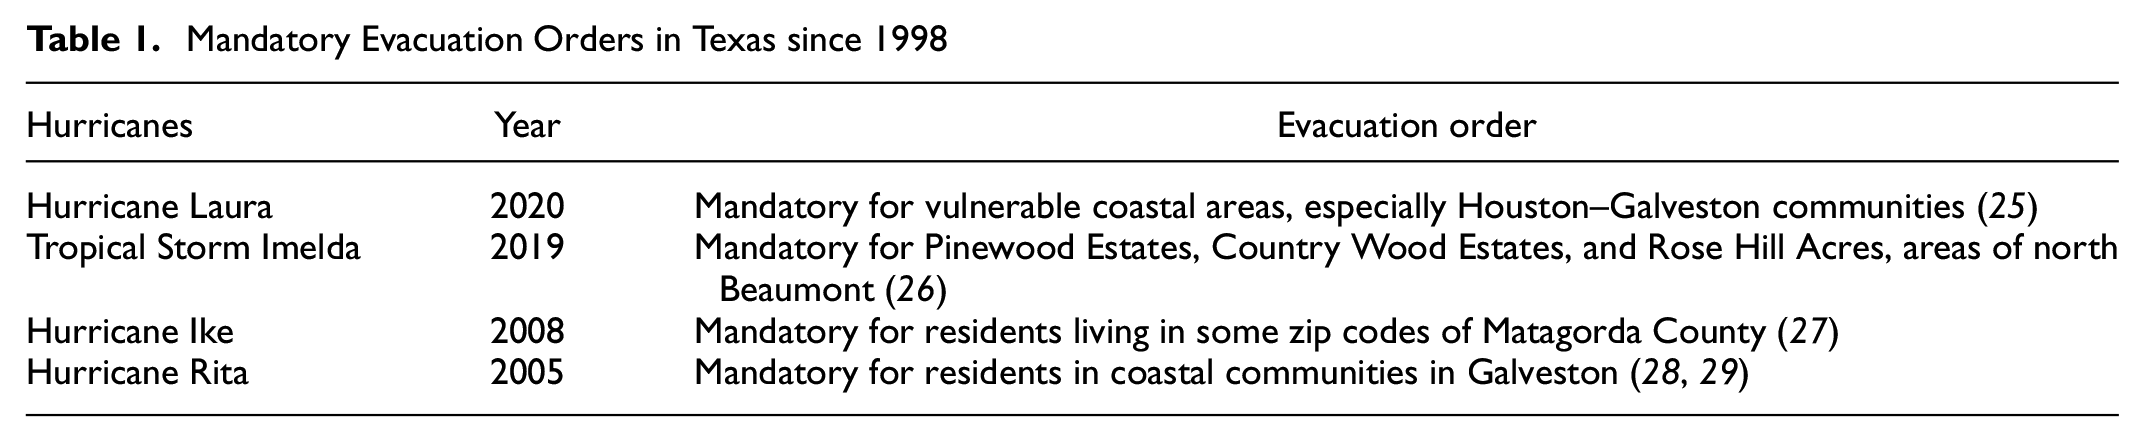
Figures 1 and 2 show respondent locations and evacuation rates by county. The seven counties with the most responses have been presented separately: Harris County; Galveston County; Fort Bend County; Brazoria County; Jefferson County; Montgomery County; and Nueces County. Notably, Harris County, where Houston is located, has the highest percentage of respondents at around 40%, and an evacuation rate exceeding 70%. In the Houston metro area, Galveston, Fort Bend, Brazoria, and Montgomery Counties display an evacuation rate of over 55%. Moving beyond the Houston area, Jefferson County and Nueces County contain the cities of Beaumont and Corpus Christi, and have evacuation rates of 94.3% and 75.6%, respectively. With regard to other coastal counties, the overall evacuation rate averages around 62.1%. In addition, the evacuation rate is 14.3% for non-coastal counties because residents may move or visit the coastal area during the hurricane season. We also summarized the mandatory evacuation orders in Texas since 1998, and these are shown in Table 1.
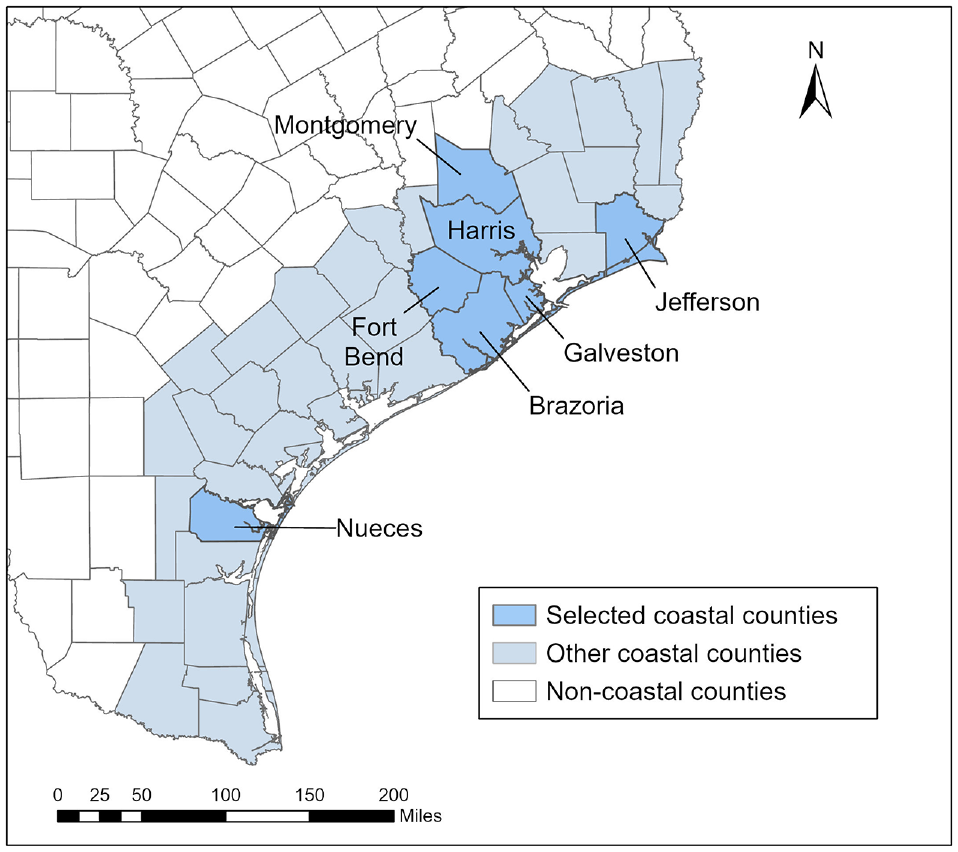
Geographic distribution of respondents across Texas counties.
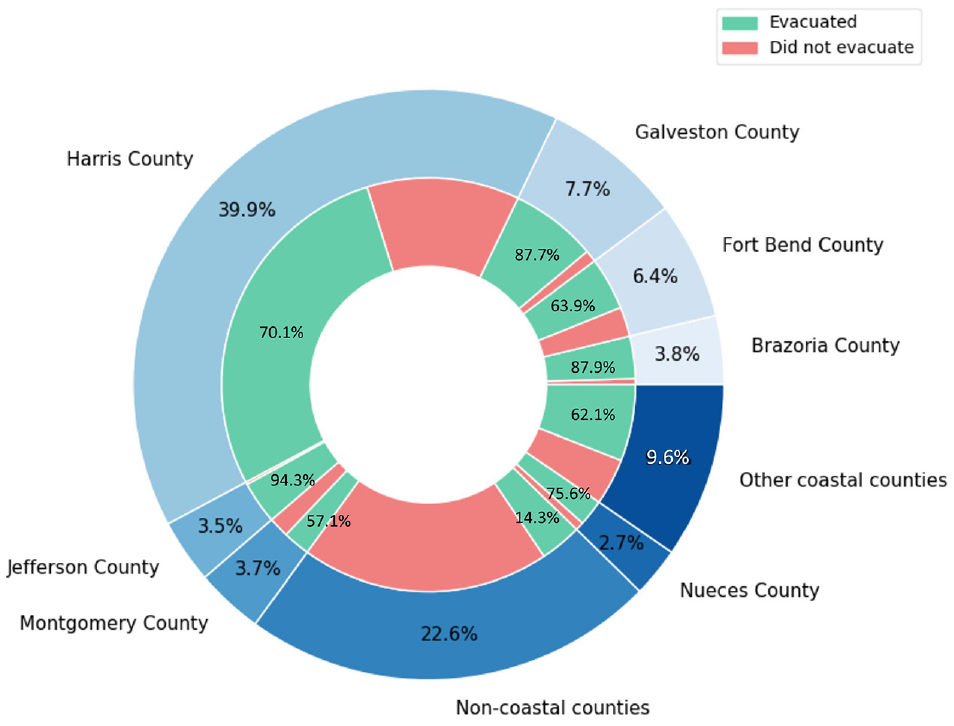
Survey respondent locations and evacuation rates by county.
Mandatory Evacuation Orders in Texas since 1998
After removing incomplete responses from the 889 valid responses received from evacuees, the final evacuation dataset contains 651 respondents who have had past evacuation experience in Texas. Tables 2 to 4 present summary statistics of the dependent variables, socioeconomic variables, and evacuation behavior variables, respectively.
Binary Response Variable Descriptions
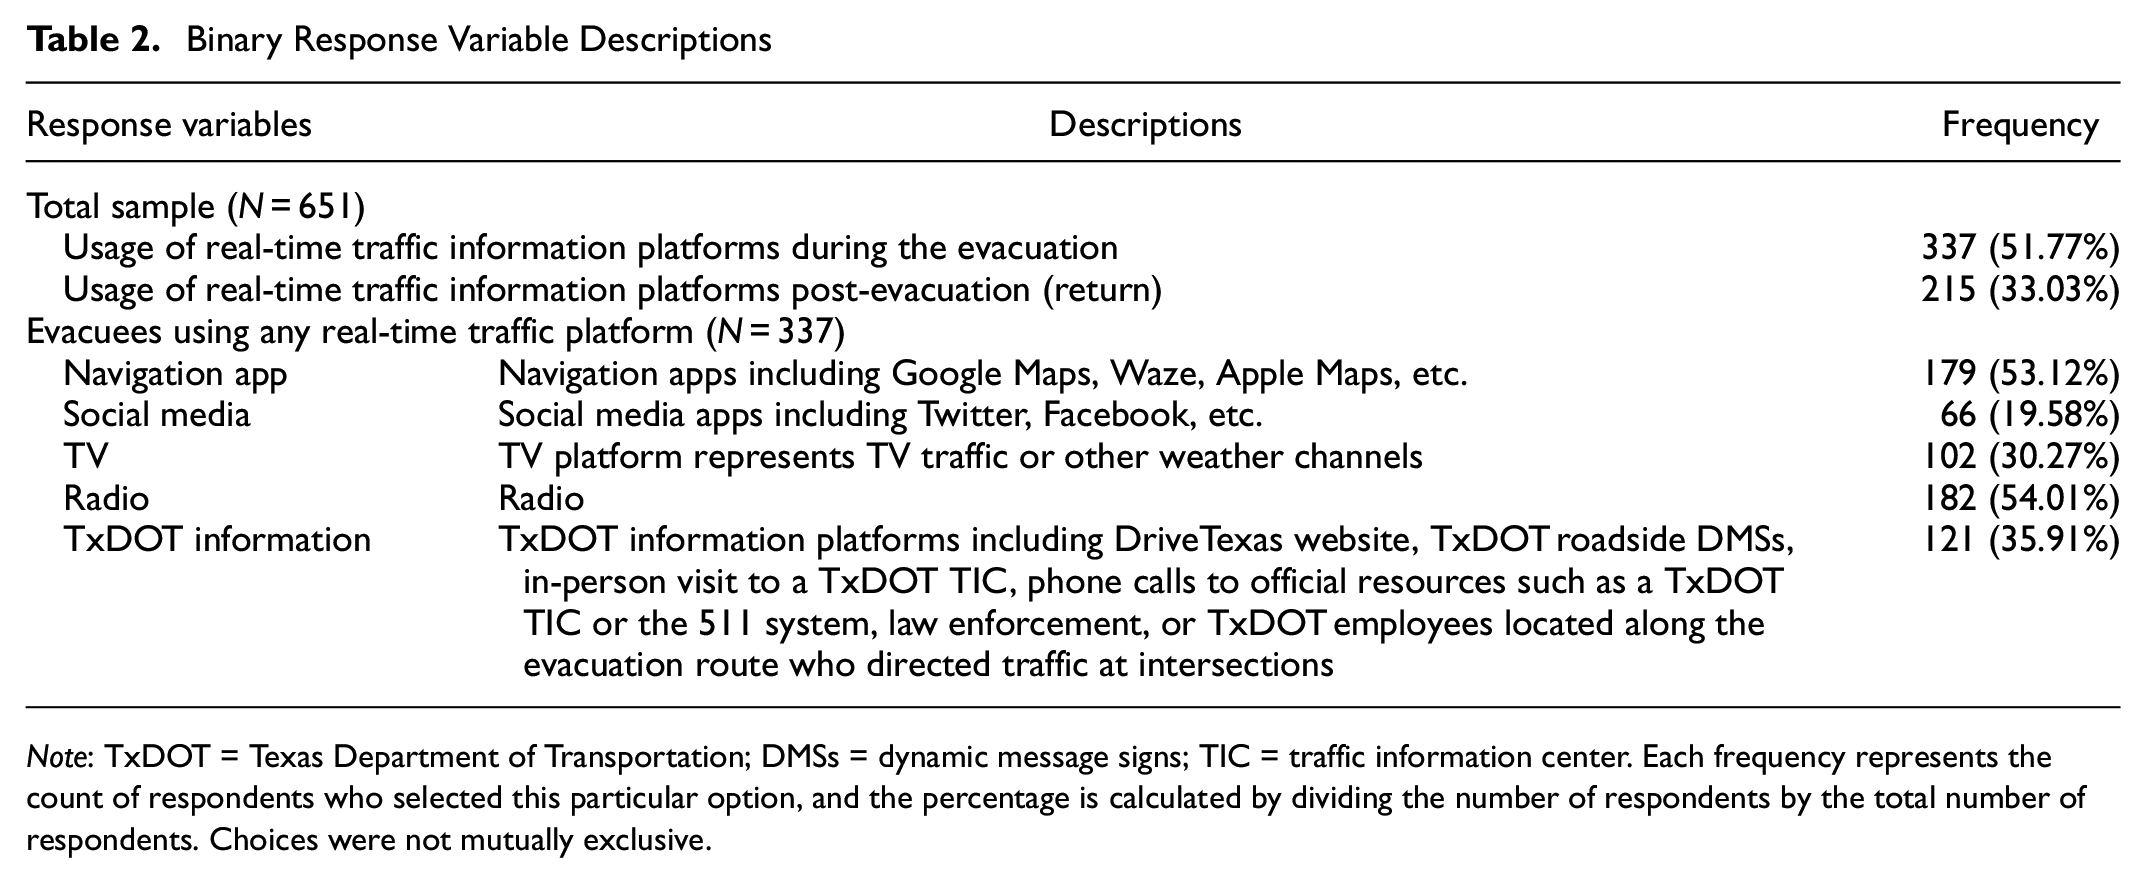
Note: TxDOT = Texas Department of Transportation; DMSs = dynamic message signs; TIC = traffic information center. Each frequency represents the count of respondents who selected this particular option, and the percentage is calculated by dividing the number of respondents by the total number of respondents. Choices were not mutually exclusive.
Summary Statistics of Socioeconomic Explanatory Variables
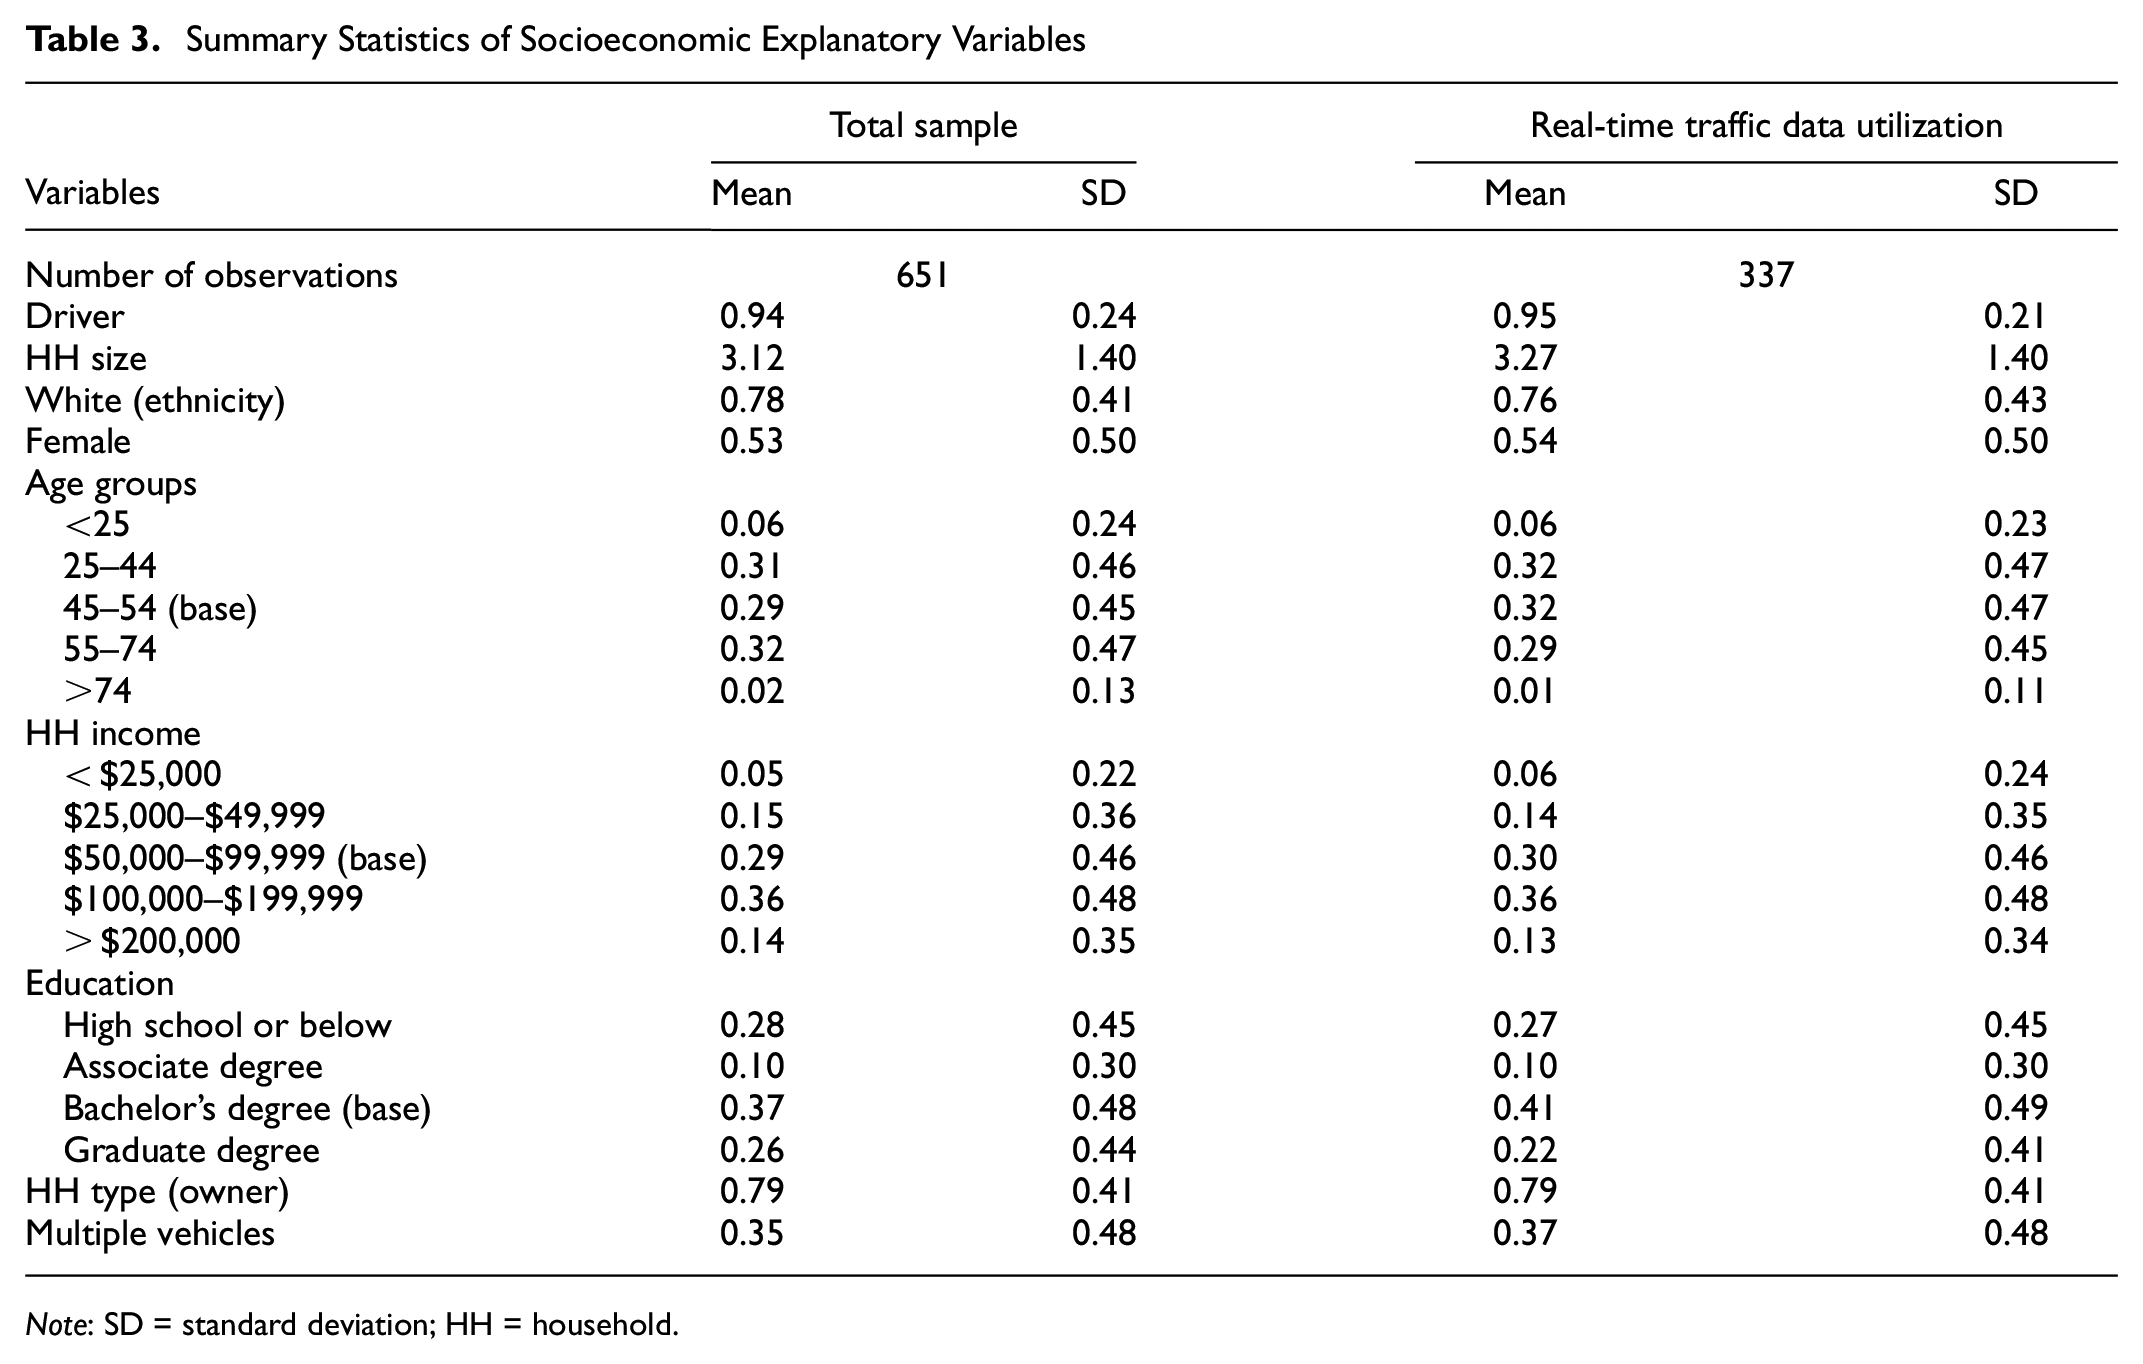
Note: SD = standard deviation; HH = household.
Summary Statistics of Evacuation Explanatory Variables
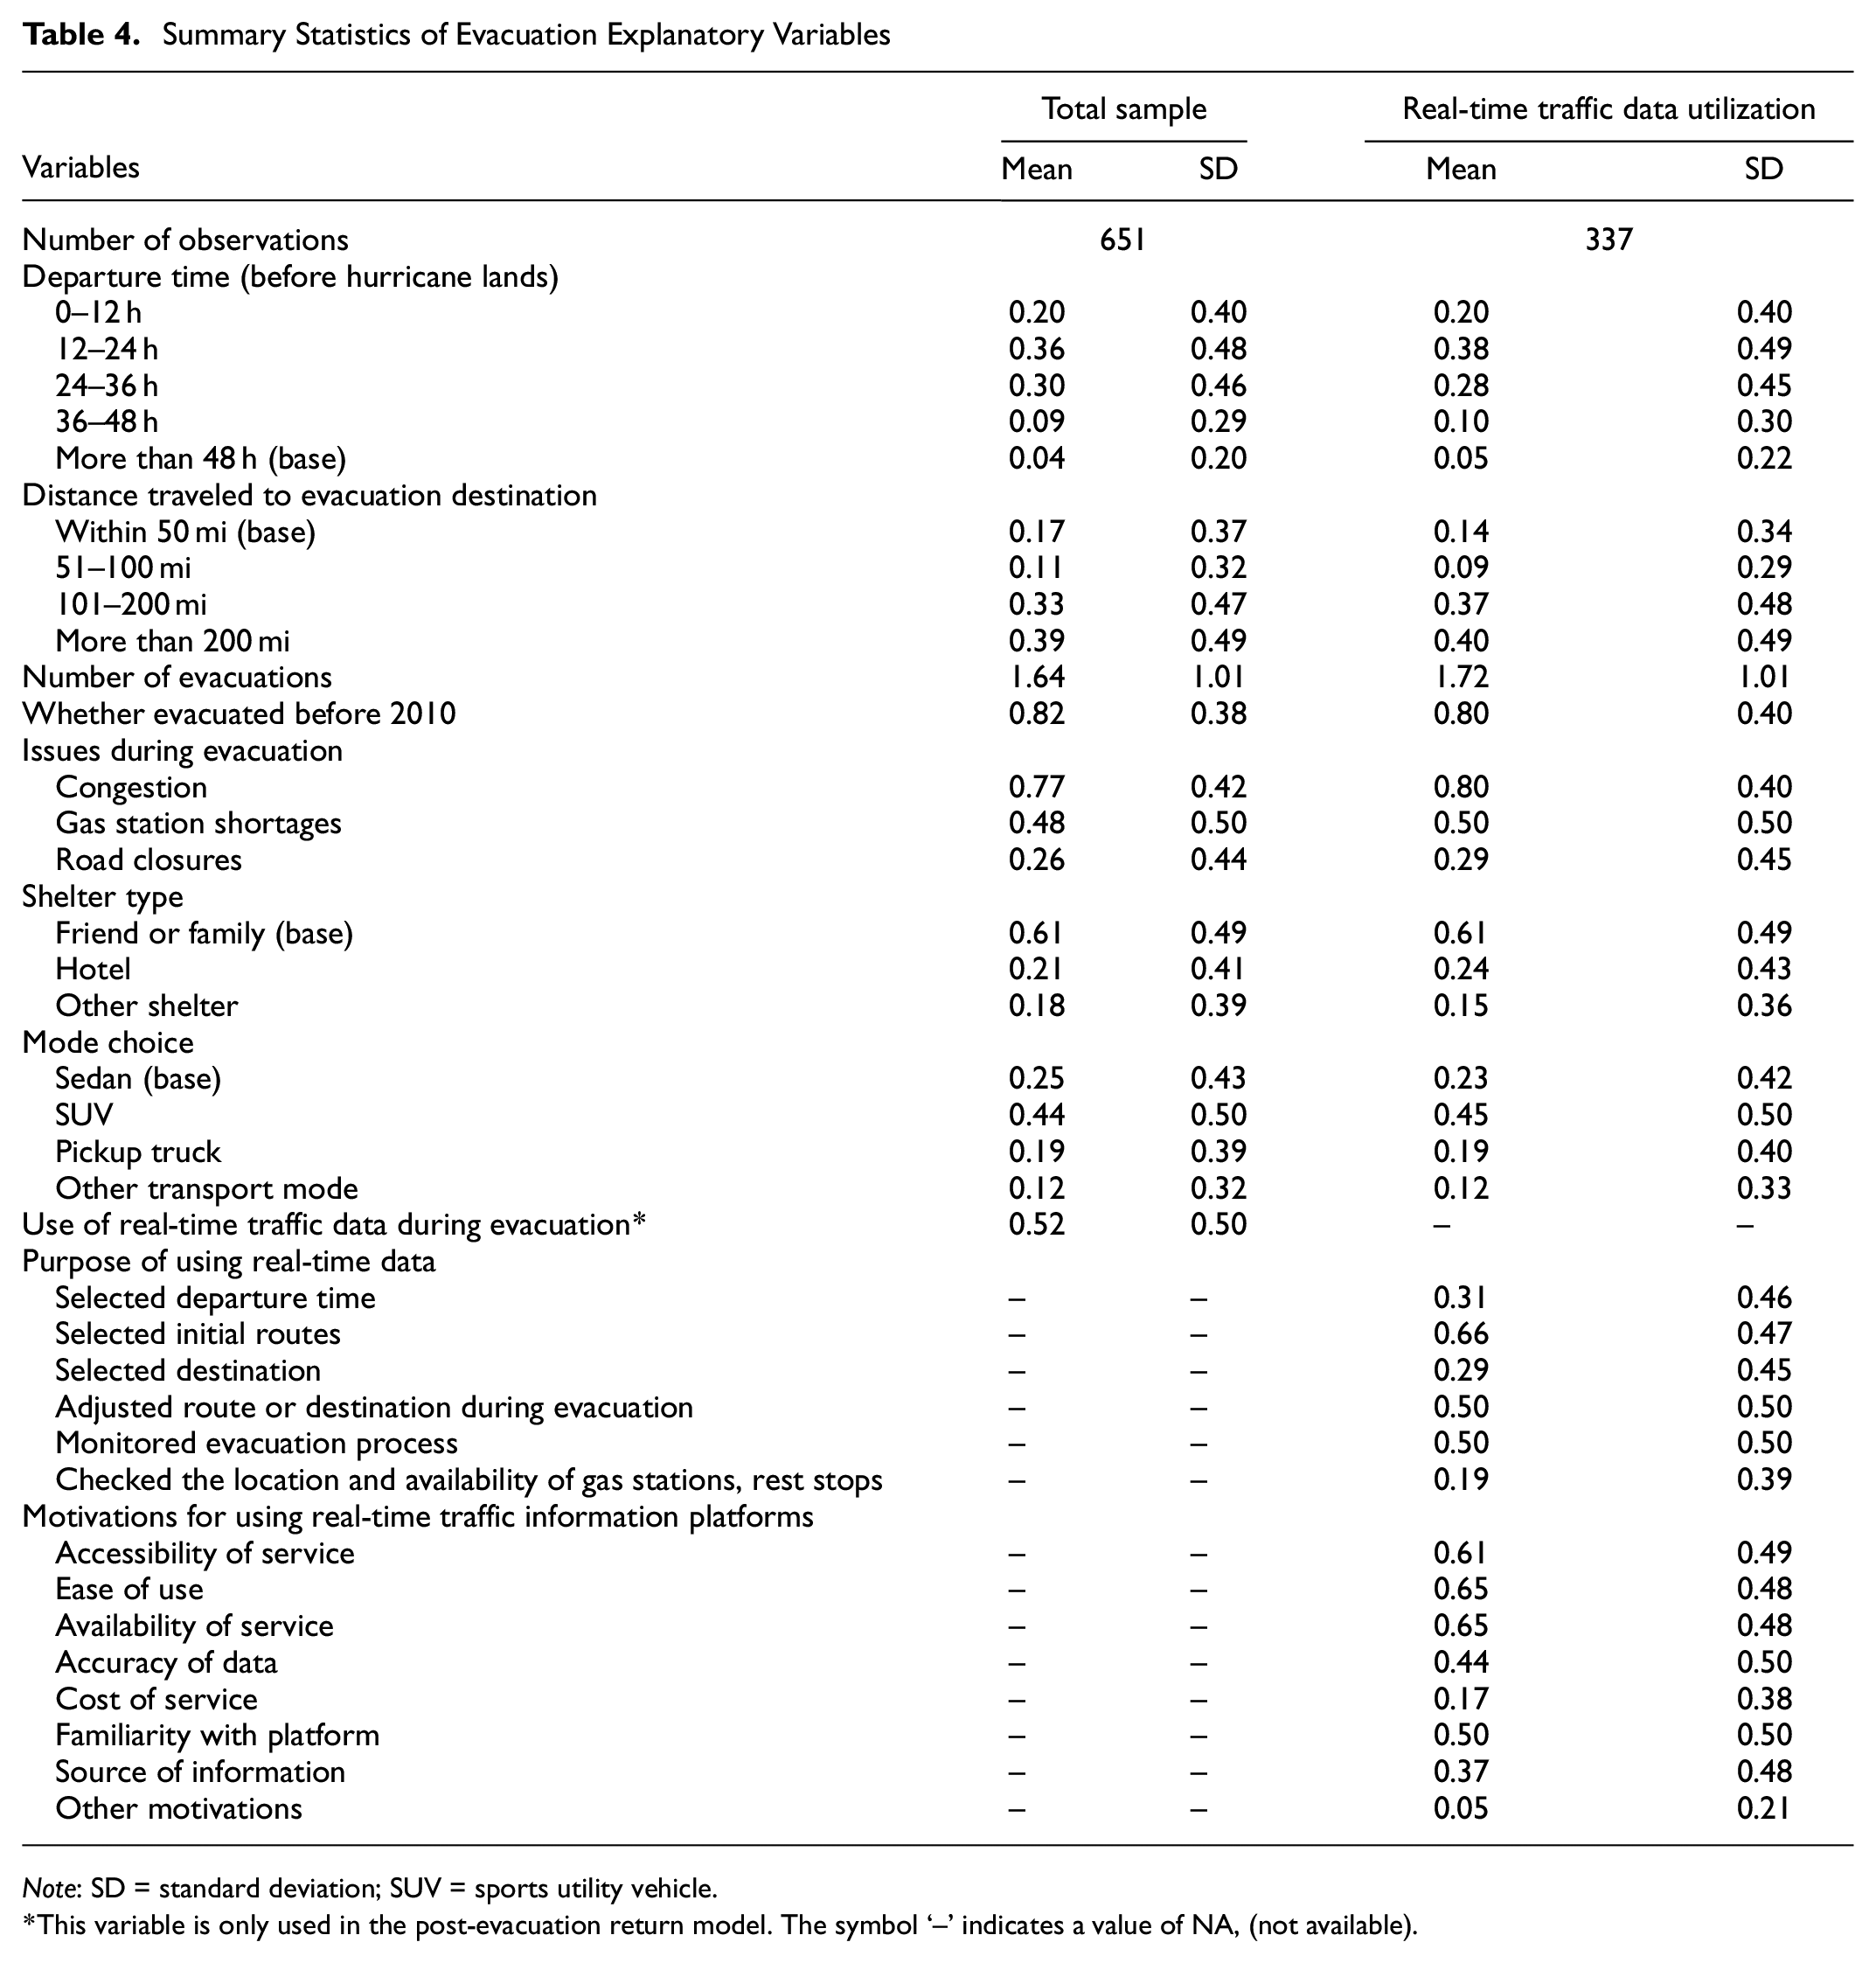
Note: SD = standard deviation; SUV = sports utility vehicle.
This variable is only used in the post-evacuation return model. The symbol ‘–’ indicates a value of NA, (not available).
Response Variables
Table 2 shows the response variables in this study, which are treated as binary variables. We run models to observe the impact of real-time data during an evacuation and post-event return and to examine differences between various data platforms. The binary response variables indicate usage of specific data platforms: navigation apps; social media; TV; radio; and official TxDOT information sources. We consider how platforms may be used in a complementary fashion for disseminating information during the evacuation ( 30 ).
Explanatory Variables
Table 3 shows the socioeconomic and demographic variables used in this model. All variables are binary except household (HH) size, which has six categories (i.e., 1, 2, 3, 4, 5, and 5+). Because ethnicity, age, HH income, and education influence evacuation likelihood ( 24 , 31 , 32 ), we also included them in the explanatory variables. This assumes that these variables may also play a role in the utilization of real-time traffic monitoring platforms and shed light on equity issues for vulnerable groups such as low-income individuals, the elderly, and non-White individuals. Drivers and non-drivers may use different information during an evacuation (and return), and household size may play a role, because large households may have more young or elderly members who need to be taken care of. The “multiple vehicles” variable is to identify different information patterns among one household, because its members can travel in multiple vehicles and may want to communicate en route.
Table 4 shows selected evacuation behavior explanatory variables, which are selected according to the broader issues discussed in the Literature Review section. All variables are binary except the number of evacuations previously experienced. Based on past literature ( 33 ), characteristics such as departure time, evacuation distance, mode choice, and destination shelter type are included in the model. Previous evacuation experience may also influence a household’s actions when evacuating and returning ( 7 , 34 ). We included a variable for evacuation experience before 2010 because of advancements in communication technologies (e.g., smartphones) in recent years ( 35 ).
We include three variables related to the most common issues encountered during evacuation and return, namely, congestion, gas station shortages, and road closures; it was found that gas stations represent fuel consumption and refueling location preferences during hurricanes ( 19 , 20 ). In addition, we also include variables related to real-time traffic data usage: variables describing the evacuee’s purpose for using real-time data, and the reasons or motivations behind their choice of real-time data platforms. Notably, the post-evacuation return model also includes a binary variable to examine whether the usage of real-time information during the initial evacuation may influence its usage during the subsequent post-evacuation return.
Methodology
We use binary logistic regression to analyze the survey results. This section presents the model structure and interpretation of the parameters ( 36 ).
Model Structure
The logistic model investigates how a set of predictor variables

In this study, the response variable Y represents whether real-time traffic information platforms are adopted (during evacuation or post-evacuation), or whether a specific real-time traffic platform is used (navigation app, social media, TV, radio, official sources from TxDOT). The vector of predictors
Multicollinearity occurs in regression models if there is a correlation between independent variables, and it affects the interpretation of regression results. Multicollinearity can be measured by the variance inflation factor (VIF); as a general rule, a VIF of less than 5 means that predictor correlation will not have a negative impact on the analysis.
Parameter Interpretation
To interpret the results of logistic regression models, the odds ratio is introduced to determine the effect of a predictor variable on the outcome variable. The logistic regression model can be rewritten as Equation 2:

Results
Real-Time Traffic Information Utilization in Texas Evacuations
Figures 3 to 6 analyze the behavior of evacuees who used real-time traffic data in previous evacuation events. All questions gave respondents the opportunity to select multiple options; therefore, the data do not sum to 100%. Each bar represents the percentage of respondents choosing a particular option.
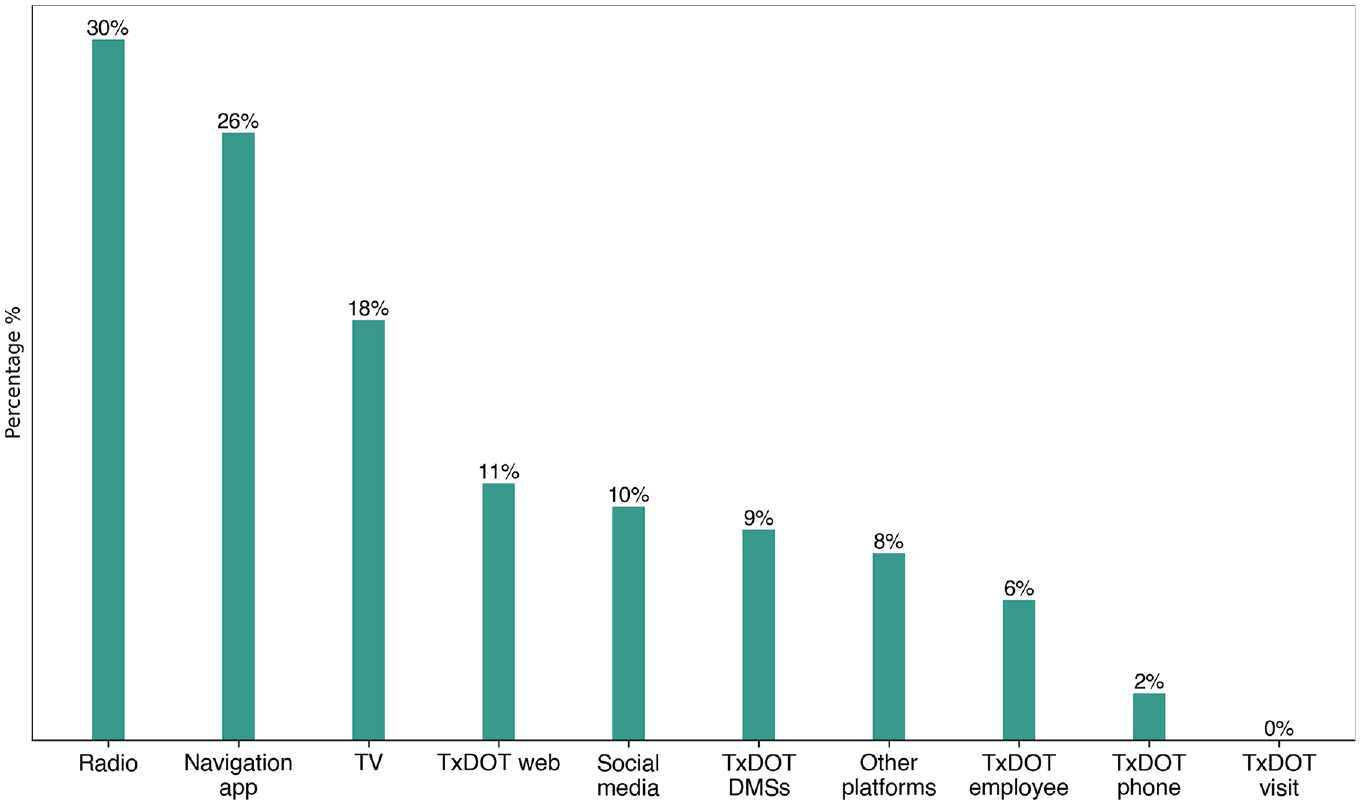
Utilization of real-time traffic information platforms during past Texas evacuations.
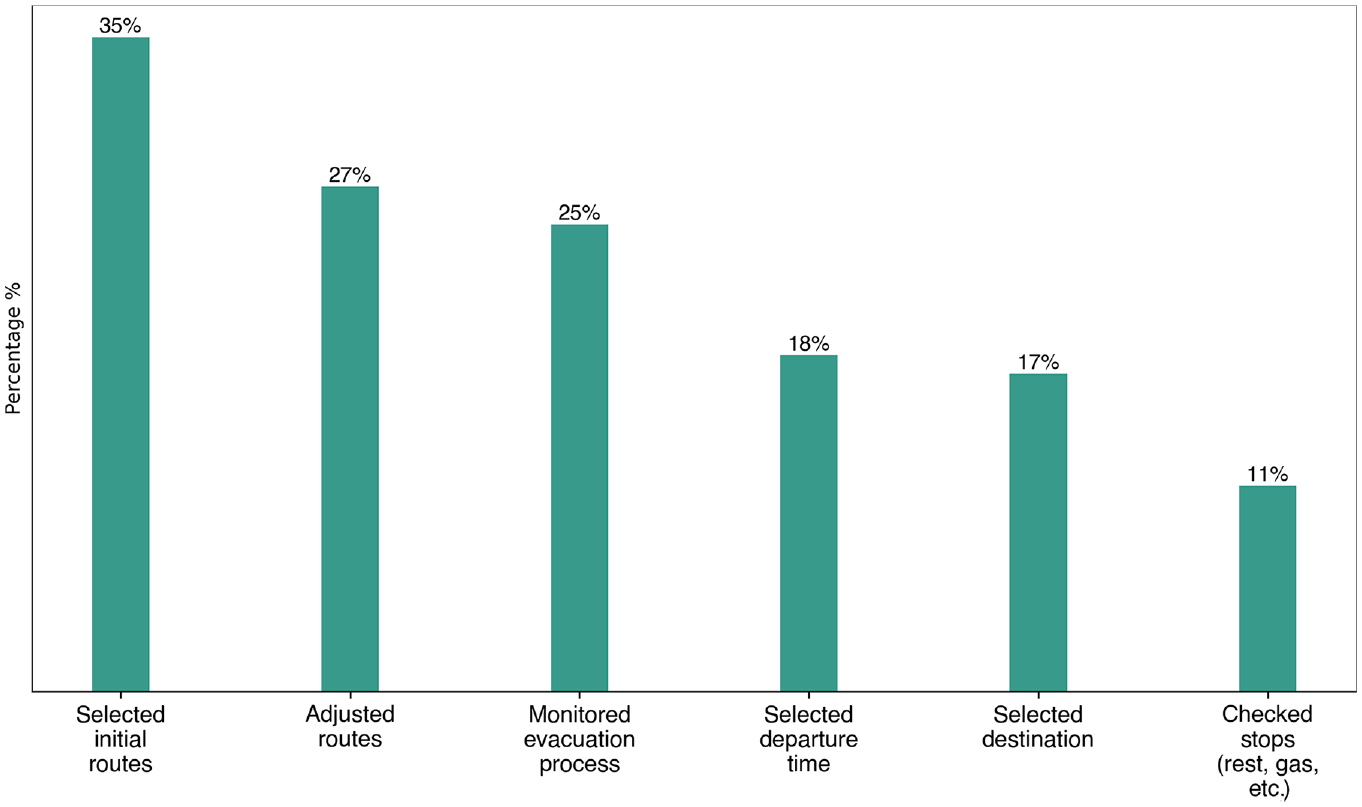
Evacuee motivations for using real-time traffic information.
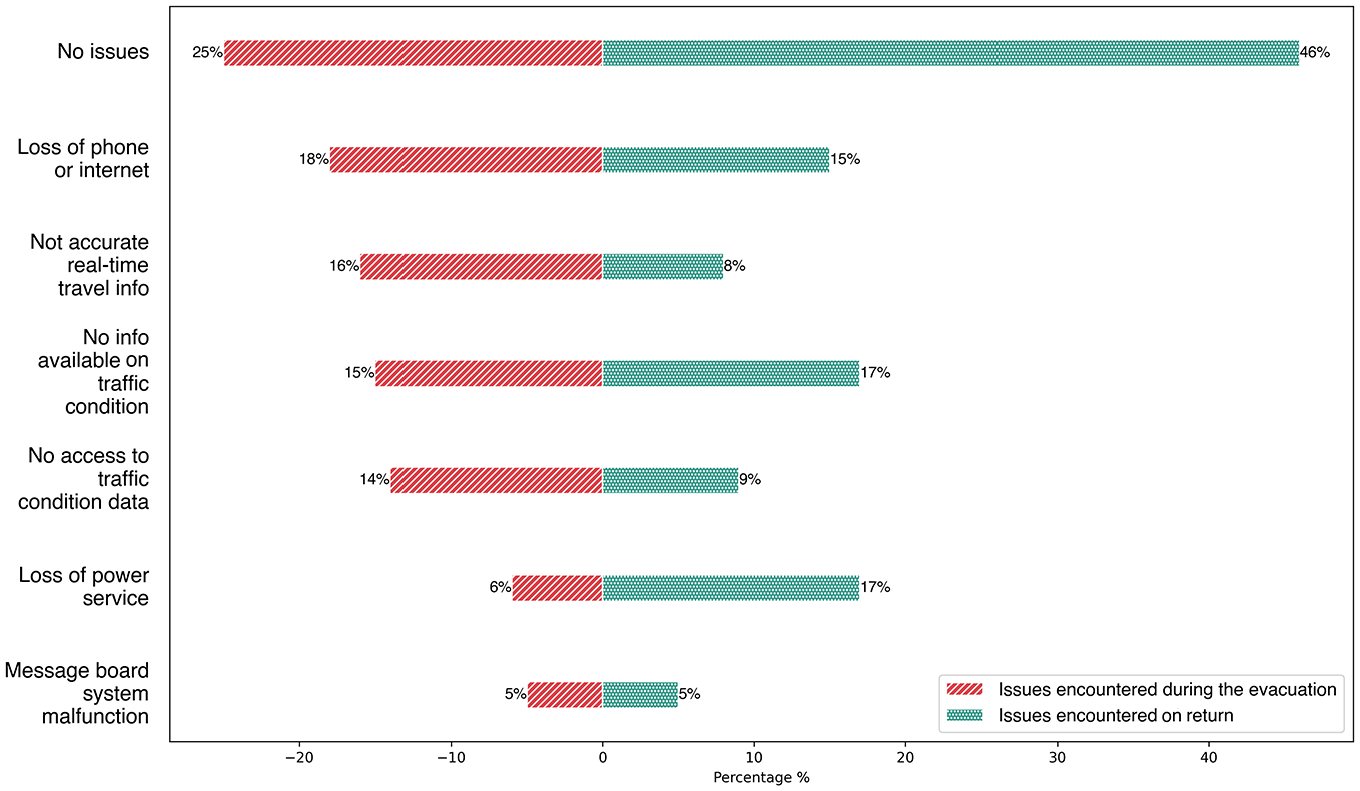
Challenges with regard to real-time traffic information during evacuations and returns.
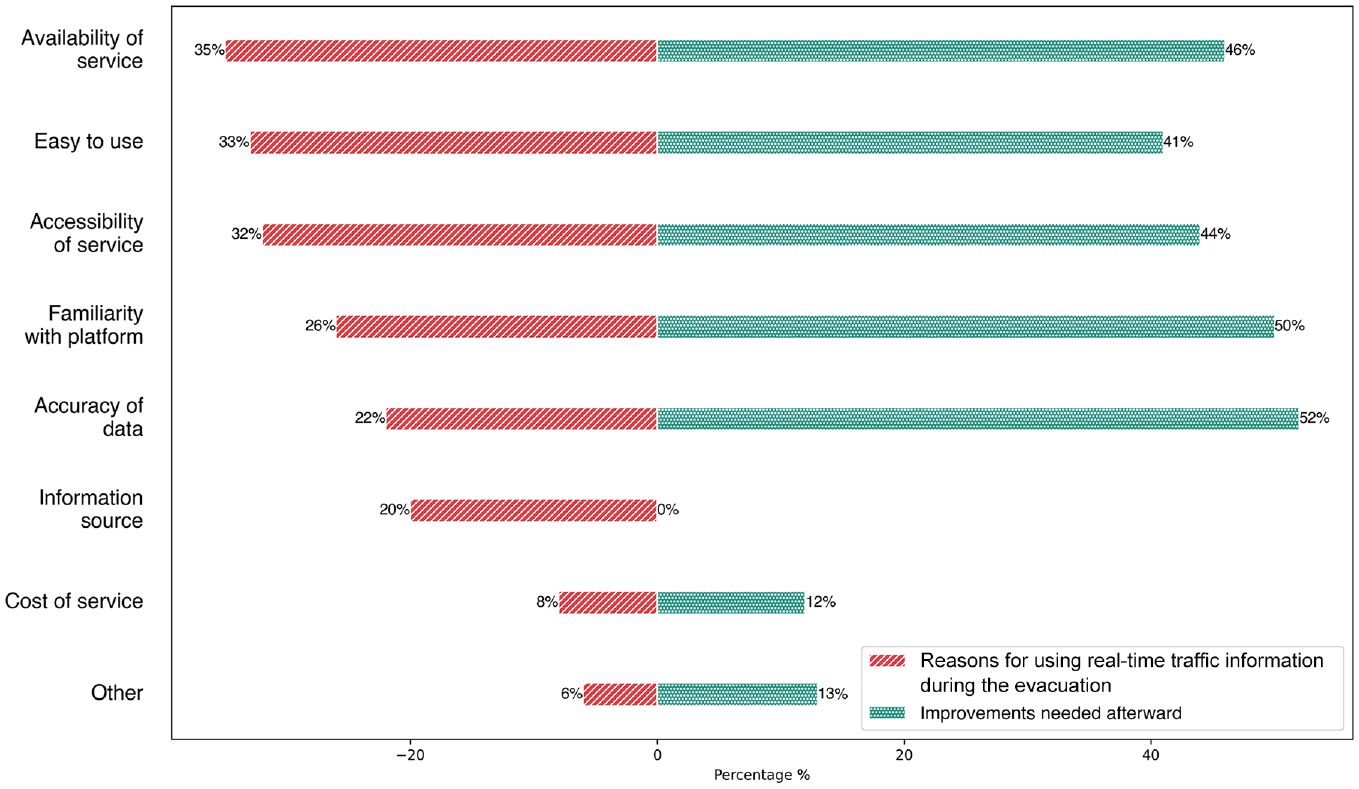
Motivations for using real-time traffic data platforms and suggested improvements.
Figure 3 shows that respondents predominantly used radio (30%) and mobile navigation applications (26%), followed by TV sources (18%). Eleven percent of respondents used DriveTexas, the official TxDOT website for distributing real-time travel information in Texas, and 9% utilized TxDOT DMSs. Further sources of information include talking with TxDOT employees, calling TxDOT phone numbers, and other platforms.
Figure 4 summarizes evacuee motivations for using real-time data. Over one-third of participants used real-time data to help select initial evacuation routes, whereas a quarter of participants used real-time data during the evacuation to adjust routes or monitor evacuation progress. Seventeen to eighteen percent of respondents mentioned they used real-time platforms to select a departure time or choose a destination. These results indicate that evacuees are more likely to use real-time data to help with route selection and mid-journey rerouting, rather than to determine their destination or departure time. This suggests that evacuees may use real-time data to observe congestion levels and roadway incidents to select more efficient and reliable routes. Departure time and destinations are probably influenced by other attributes. For example, evacuation destinations may be predetermined if a household has made arrangements with other family members or friends.
Figure 5 shows the issues encountered during the evacuation and return. Approximately 25% of respondents reported no issues when evacuating; this percentage increased to 46% for the return. The main challenges during the evacuation were loss of phone or internet service (18%), and inaccuracy (16%), unavailability (15%), and inaccessibility (14%) of real-time information. For the return trip, the focus shifted to concerns about loss of power service (17%), less information available about travel conditions (17%), and phone or internet connectivity issues (15%).
Figure 6 shows that more than one-third of respondents indicated that accessibility (35%), ease of use (33%), and availability of the service (32%) affected their use of services. Participants also identified these aspects as areas requiring improvement. Around half of the respondents wanted enhanced data accuracy and needed help to become familiar with the platforms.
Model Results
Logit models were estimated to examine the impact of socioeconomic and evacuation variables on the choice of information source, and the results are summarized in Tables 5 and 6. Table 5 shows results for respondents who used real-time traffic data during their evacuation and return, and Table 6 shows evacuee use preferences for different platforms. The results are reported as odds ratios: a value greater than 1 indicates a higher likelihood of using the platform than not. The VIF values for the explanatory variables in the models were less than 5, indicating there is no significant multicollinearity among explanatory variables. The data were processed using Python and the models were implemented in Stata 15.1.
Logit Models for Real-Time Traffic Information Platform Utilization
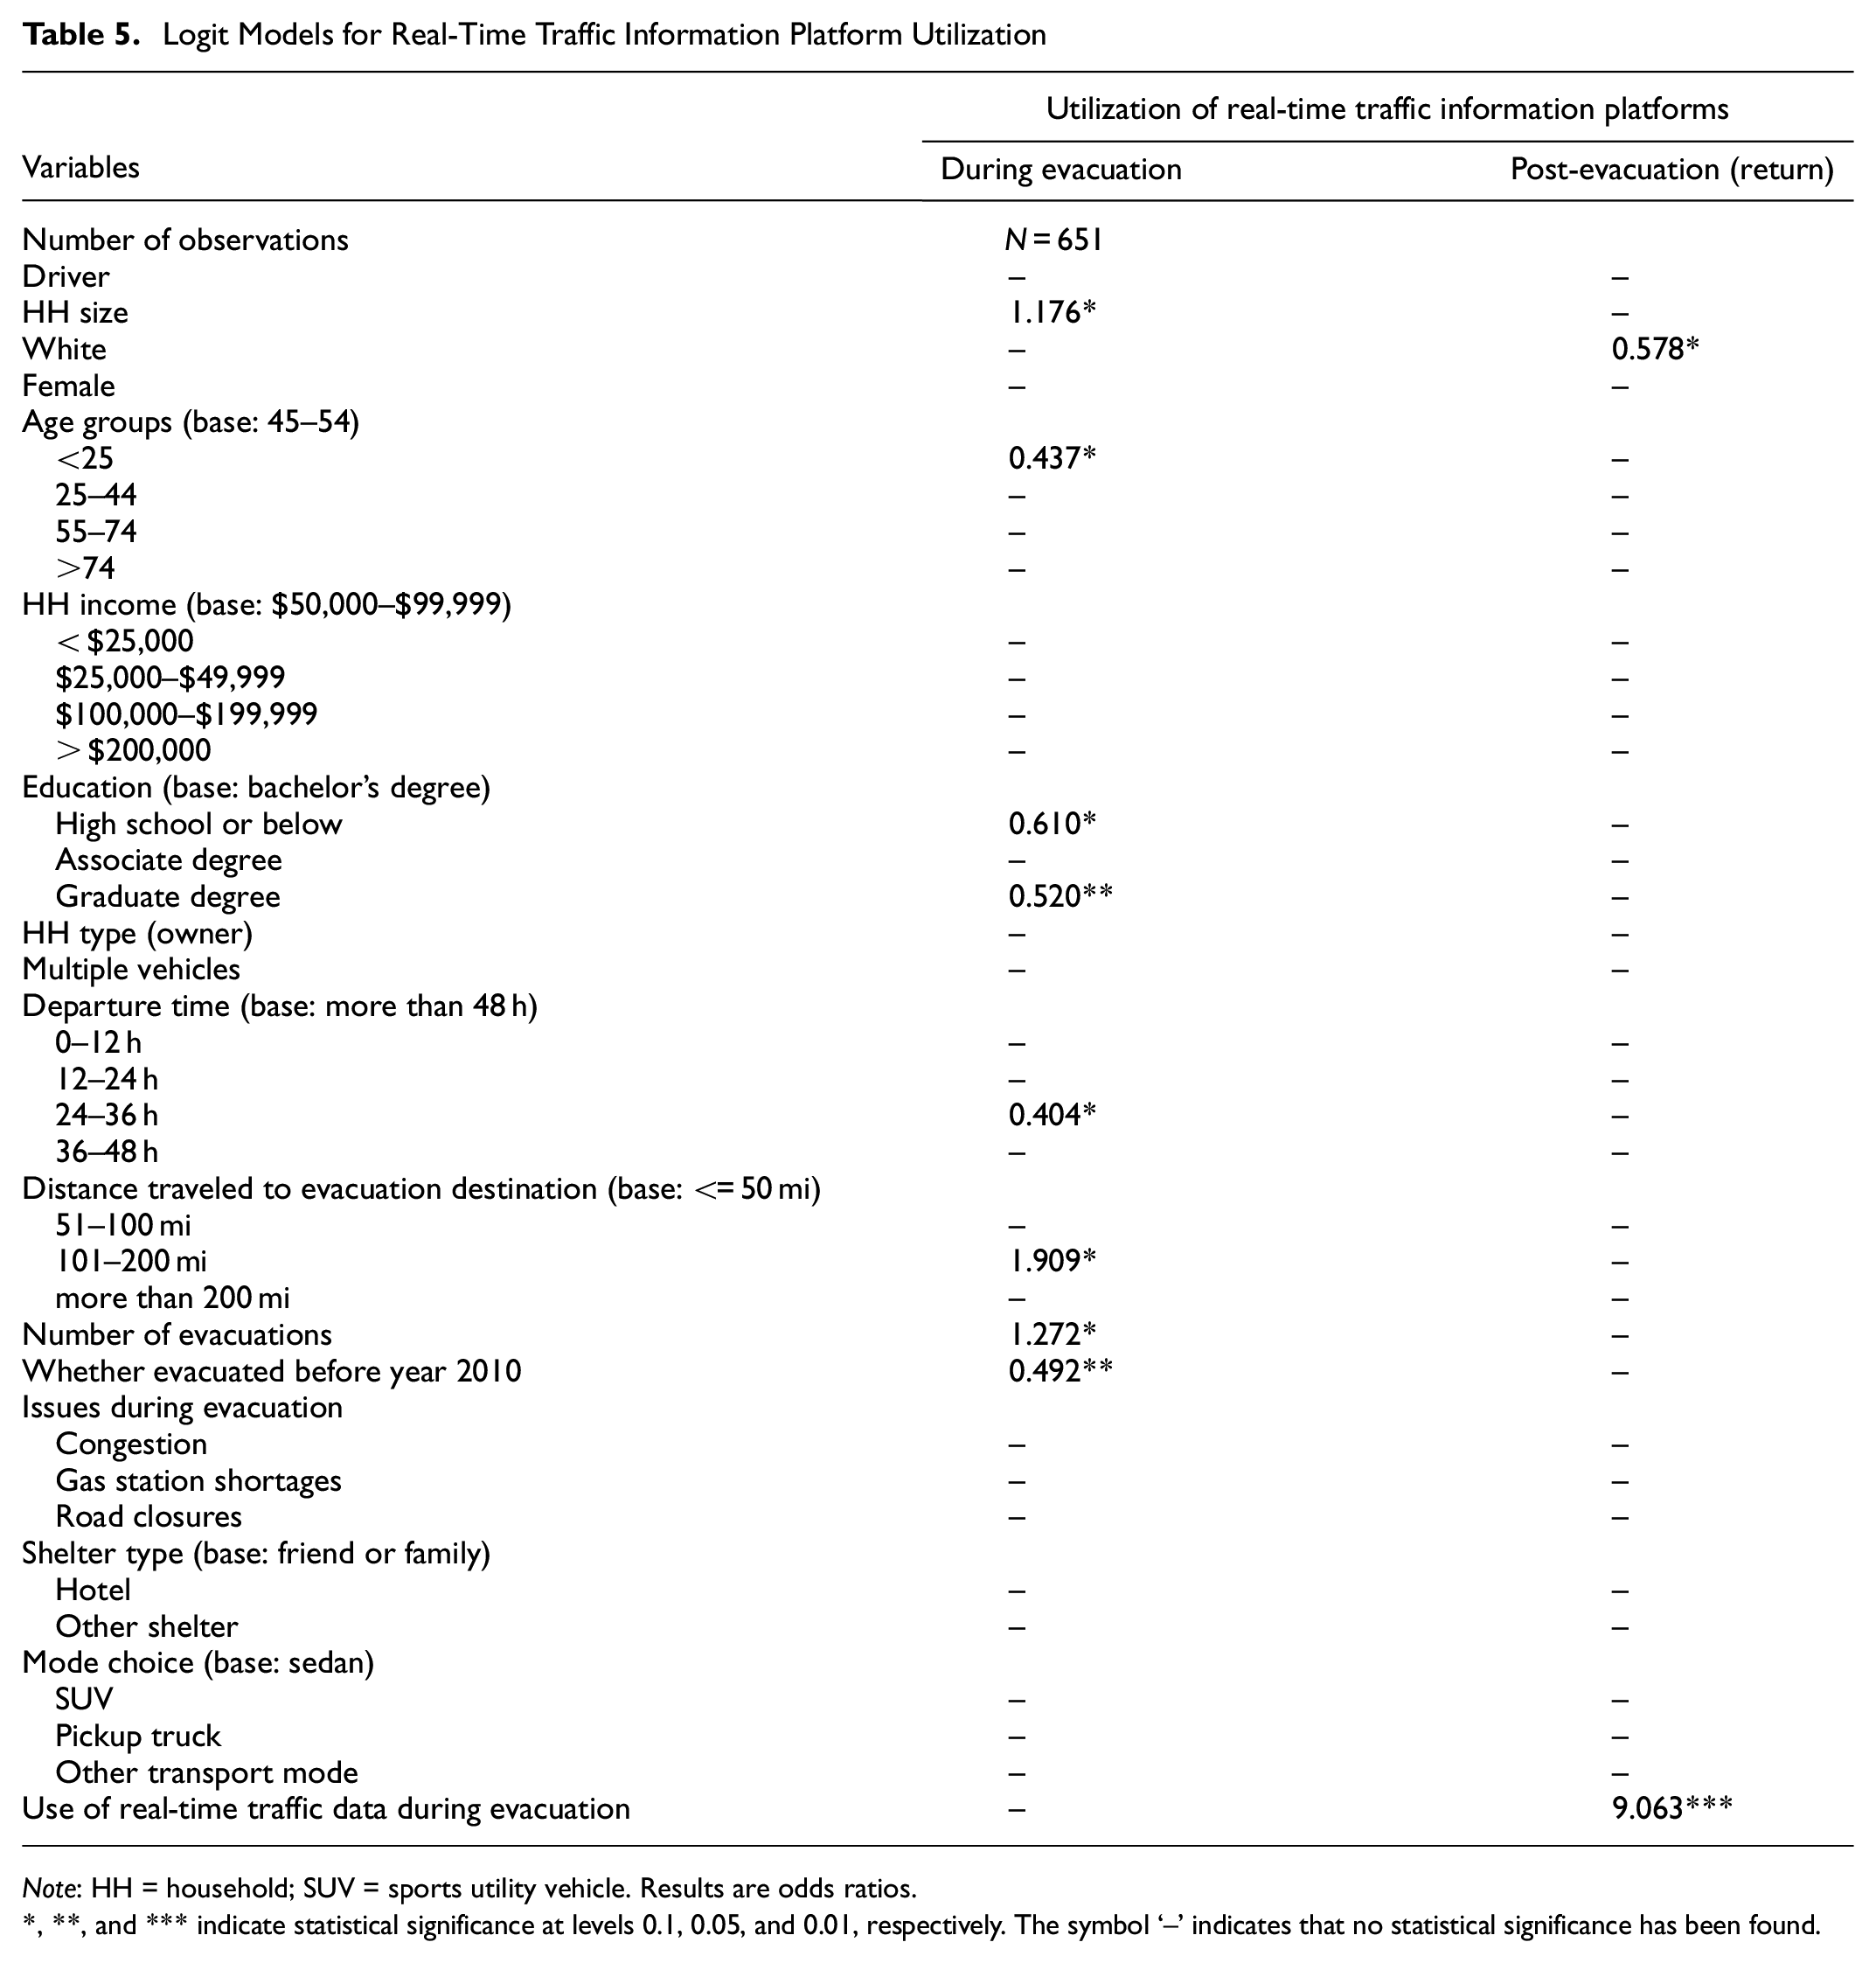
Note: HH = household; SUV = sports utility vehicle. Results are odds ratios.
, **, and *** indicate statistical significance at levels 0.1, 0.05, and 0.01, respectively. The symbol ‘–’ indicates that no statistical significance has been found.
Logit Models for Different Real-Time Traffic Information Platforms
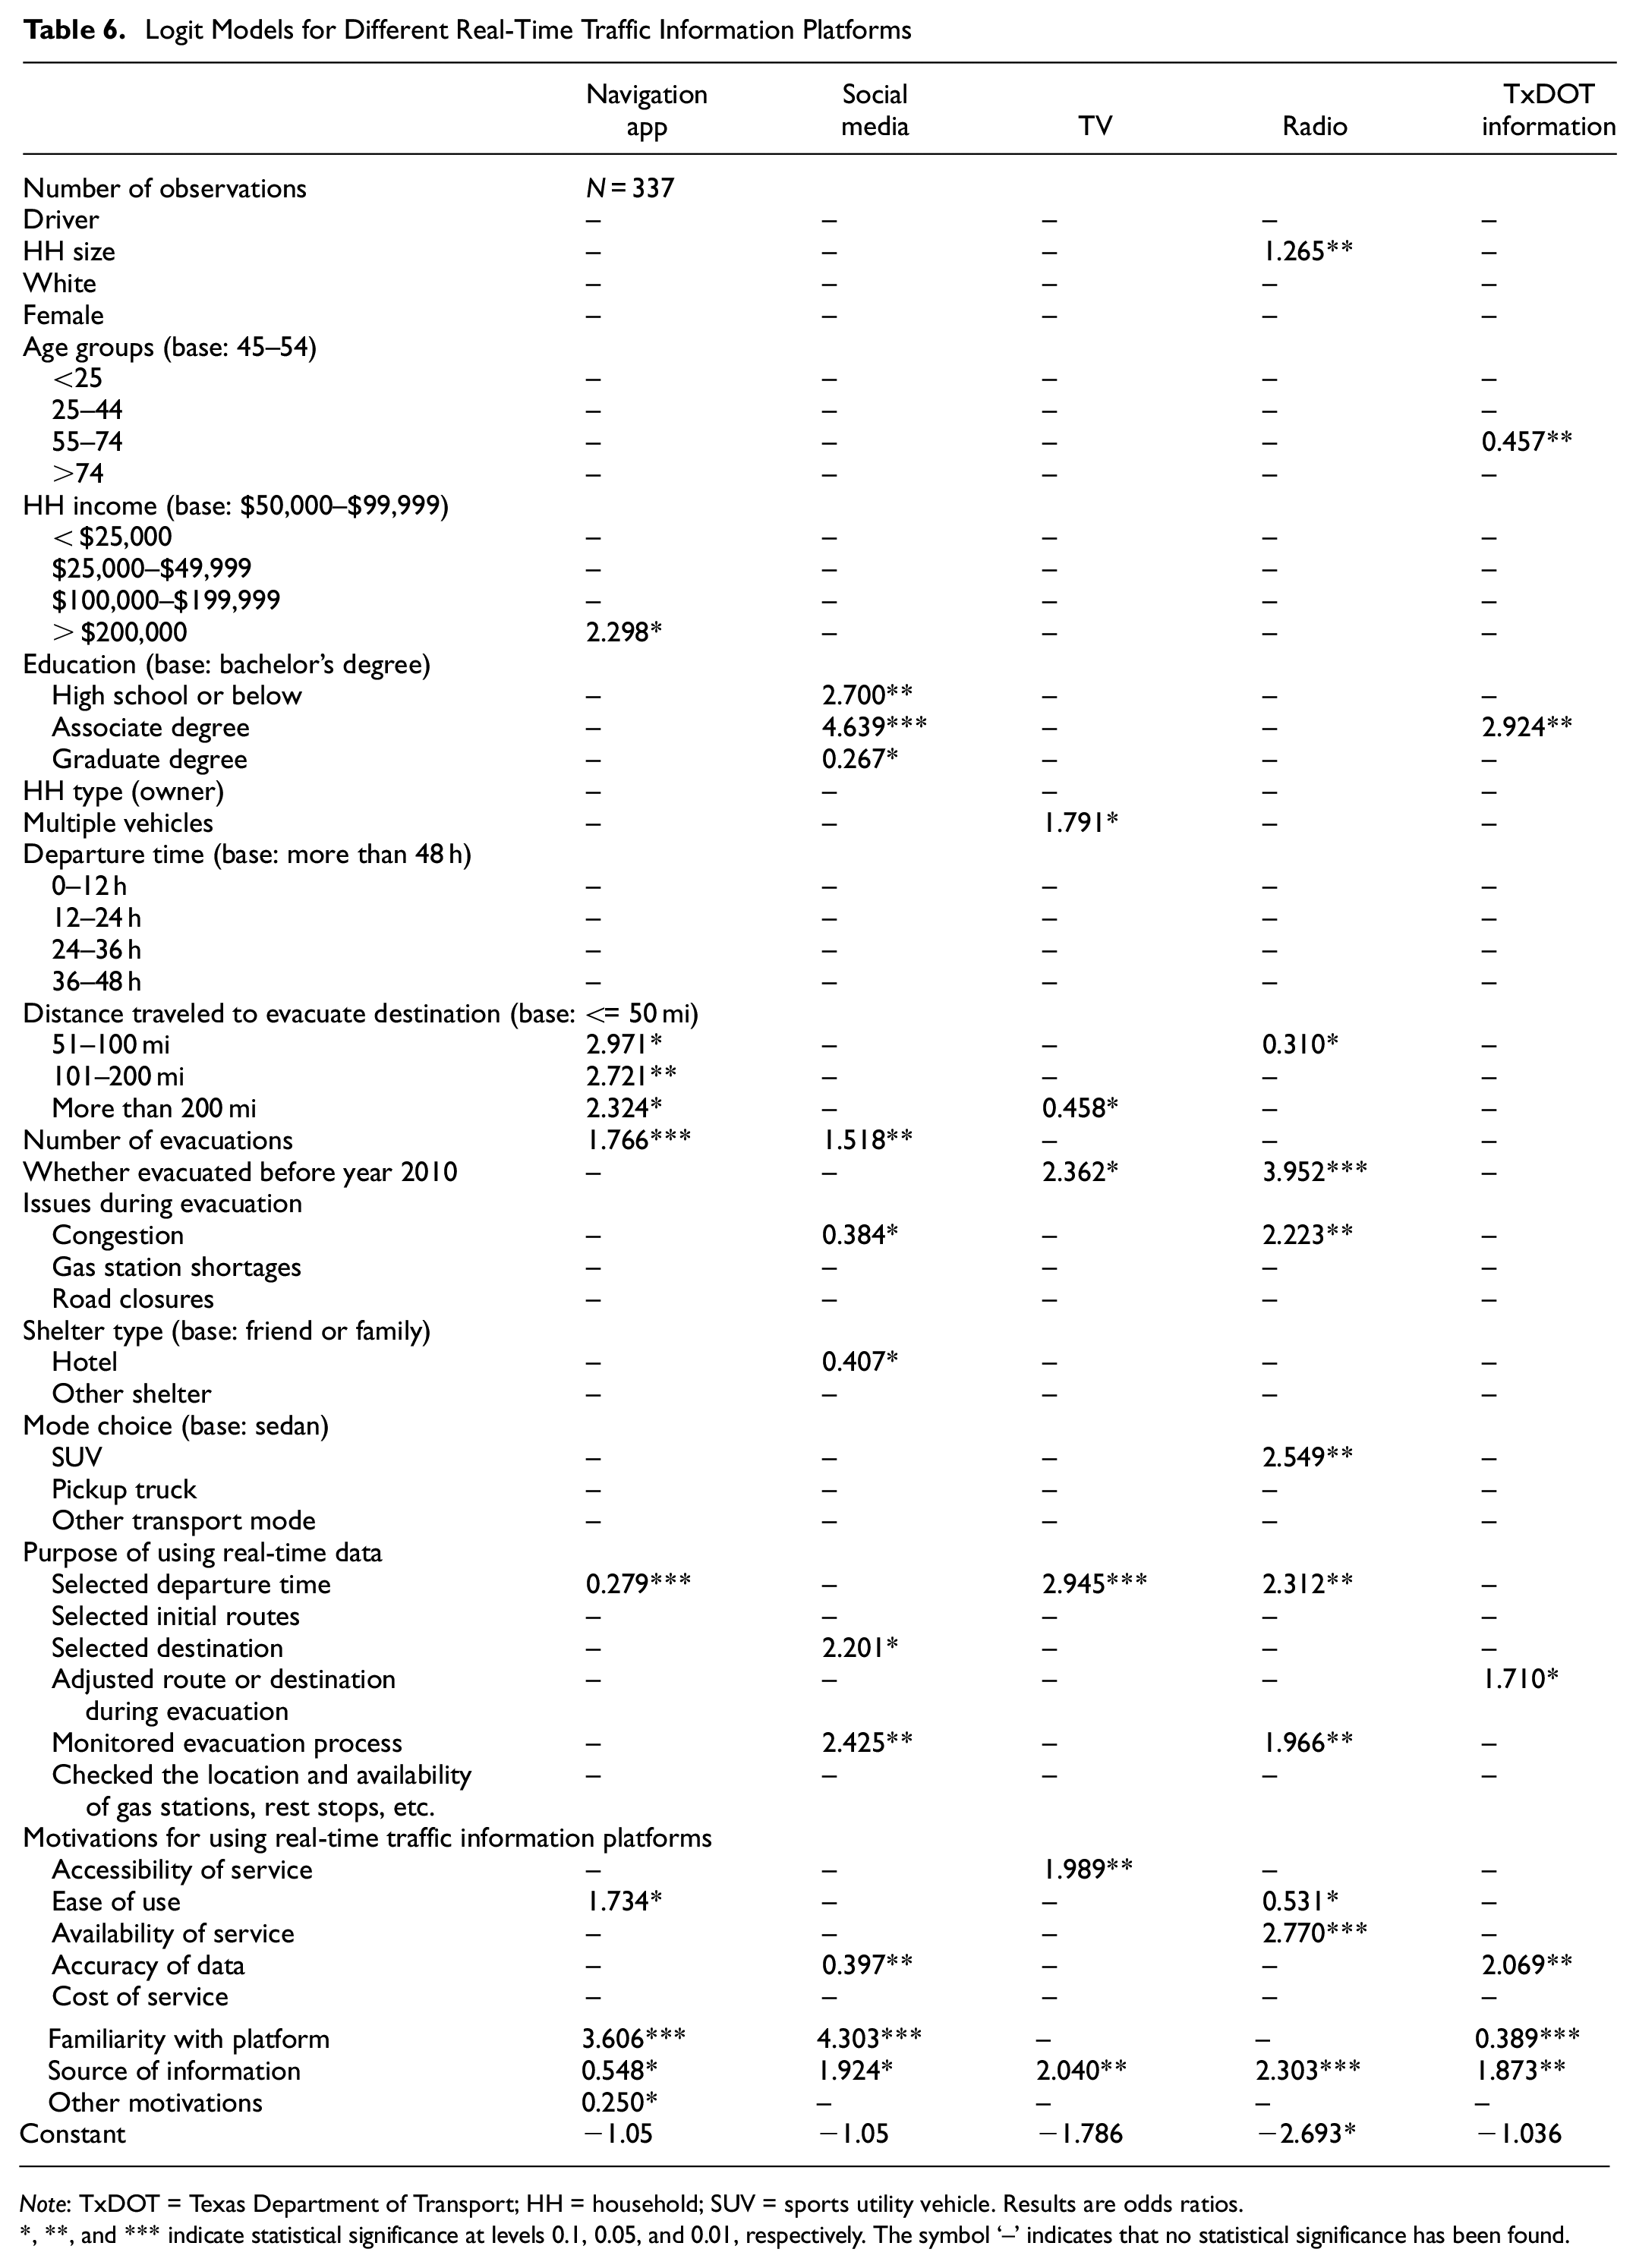
Note: TxDOT = Texas Department of Transport; HH = household; SUV = sports utility vehicle. Results are odds ratios.
, **, and *** indicate statistical significance at levels 0.1, 0.05, and 0.01, respectively. The symbol ‘–’ indicates that no statistical significance has been found.
Table 5 shows model results analyzing the utilization of real-time traffic information platforms during the evacuation and return. An additional household member increases the odds of utilizing real-time traffic data by 1.176*. This suggests that a larger household size tends to increase the possibility of using these platforms during an evacuation, which is consistent with Jiang’s ( 4 ) results. Respondents younger than 25 are less likely to utilize real-time information compared with those in the 45–54 age group. The explanation for this could be that although younger people may rely more on technology, teenagers may often travel with parents or seniors during an evacuation, and in such cases, evacuation information is typically accessed by seniors at home before travel.
Interestingly, household income does not signify a preference for using real-time traffic data. The analysis also reveals that households containing members with a high school education or below, as well as those containing members with a graduate degree, are less likely to use these platforms.
With regard to evacuation behavior, households planning to depart 24–36 h before storm landfall are less inclined to use real-time information compared with those leaving more than 48 h in advance. This finding may suggest “cautious” households that are likely to evacuate well ahead of the forecasted storm arrival are willing to use more real-time resources to help with planning.
Households traveling 101–200 mi to their evacuation destination are more likely to rely on real-time traffic data, suggesting that individuals in this distance category would benefit more from using real-time information, whereas shorter-distance travelers are more familiar with the local roadway network and require less navigational aid. Those who travel further than 200 mi during an evacuation may depart early to encounter less congestion, reducing their reliance on real-time traffic data.
For each additional previous evacuation experienced by a household, the odds of using real-time traffic data platforms increase by 27.2%*. Although Wong et al. ( 1 ) found that past hurricane experiences lowered the evacuation rates, this may reflect a scenario in which past evacuation experiences would enhance the usage of traffic information sources in future evacuations.
However, households with evacuation experience before 2010 demonstrate a lower tendency to use real-time traffic monitoring device data with a factor of 0.492**. This may be because emerging technologies such as smartphones were not widely distributed then.
For the post-evacuation return, two variables emerge as significant: ethnicity (White households are less likely to use real-time traffic data); and whether the household used such platforms during the evacuation process. If the household utilized information for evacuation, there is a strong likelihood they will use it during their return as well, with an odds factor of 9.063***.
To explore distinctions between different platforms, we estimated five additional models, which are summarized in Table 6. These models focused on navigation apps, social media, TV, radio, and official sources (including the DriveTexas website, TxDOT roadside DMSs, in-person visits or phone calls to a TxDOT TIC, the 511 system, law enforcement, or TxDOT employees located along the evacuation route), respectively.
The respondent’s status as a driver does not have a significant impact on the platforms accessed. However, the presence of additional household members has a positive association with the use of radio, with an odds ratio of 1.265**, perhaps because additional passengers in the evacuating vehicle not occupied with driving are available to assist with searching for radio channels in the vehicle during the evacuation.
No age variable demonstrates a significant influence on platform usage, except for those in the 55–74 age group, who are less likely to use TxDOT information platforms (odds ratio 0.457**). With regard to household income, households with an income exceeding $200,000 are more likely to use navigation apps (odds ratio 2.298*). This finding aligns with the observation that higher-income individuals usually undertake jobs requiring the use of information communication technology, which gives them more chance to access information ( 37 ). In relation to education, households containing members with a high school diploma or below and those containing members with an associate degree show a higher likelihood of using social media for obtaining evacuation traffic information compared with households in which members have bachelor’s degrees. Conversely, respondents with a graduate degree are less likely to rely on social media, suggesting a divide between certain education levels and the perceived trustworthiness of different data platforms.
Time of departure does not exhibit a significant influence on the choice of data platforms. However, distance to the destination does have an impact on preference for specific platforms. Individuals traveling more than 50 mi show a clear preference for navigation apps, with odds ratios of 2.971*, 2.721**, and 2.324** for the travel distance categories of 51–100 mi, 101–200 mi, and >200 mi, respectively. This indicates that evacuees traveling greater distances benefit more from using navigation apps with real-time traffic layers than evacuees who remain within 50 mi of their origin during an evacuation. Additionally, as the distance increases, there is a reduced reliance on navigation apps, resulting in lower odds ratios, which suggests that individuals tend to depart early to encounter less congestion.
Households with more previous evacuation experience prefer navigation apps and social media platforms (odds ratios 1.766*** and 1.518**), whereas households with evacuation experience before 2010 are more likely to use the radio and TV (odds ratios 2.362* and 3.952***). This aligns with existing literature ( 7 , 17 ). As households gain more experience, they may become more familiar with real-time updates provided by navigation apps and social media platforms. It should be noted that households with evacuation experience before 2010 are limited as to data platforms, and they may develop habits and preferences for traditional information sources such as the radio and TV.
With regard to the challenges encountered during evacuations, respondents who experienced congestion during an evacuation tend to use the radio as a source of traffic information (odds ratio 2.223**). This is probably because the radio was a common in-vehicle data source in 2005 when the severely congested Hurricane Rita evacuation occurred.
In relation to the purpose of using specific platforms, the TV and radio are used more for selecting departure time, whereas social media platforms are favored for destination selection. This may be because the TV is used primarily for checking departure times through local news shows ( 3 ), rather than for making mid-route decisions during the evacuation. Conversely, evacuees may access social media platforms to obtain up-to-date, qualitative information from posts or look at comments about destination feasibility. Additionally, households rely on a combination of social media, radio, and TxDOT platforms to make route adjustments and monitor evacuation progress. The radio is a convenient in-vehicle resource during the evacuation, and social media could provide extra information with regard to evacuation conditions along the route.
Among navigation app users, platform familiarity (odds ratio 3.606***) is highly valued, followed by platform ease of use (odds ratio 1.734*). Similarly, social media users prioritize platform familiarity and information credibility (odds ratios 4.303*** and 1.924*). TV users prioritize service accessibility (1.989**), which aligns with the findings of Ye et al. ( 3 ), who reported that televisions were the most widely used communication tool during evacuations. On the other hand, radio users prioritize service availability (2.770***), which was identified as the most common source of traffic information during evacuations ( 7 , 16 , 17 ). Finally, users of TxDOT information platforms pay particular attention to data accuracy (2.069**).
Conclusions
This study investigated real-time traffic information usage in past Texas hurricane evacuations using data collected between August 2022 and February 2023. We analyzed the use of various real-time traffic information platforms and discussed the challenges and motivations associated with their usage. It was found that evacuees rely predominately on the radio and navigation apps, and that these data platforms are more commonly used for selecting routes (both initially and rerouting mid-evacuation). The decision to use these platforms depends on service availability, ease of use, and accessibility. Two areas for improvement were identified: enhancing the accuracy of real-time data; and providing educational resources to increase user awareness of the available platforms. Enhancing the power service with mobile hubs to assist with phone charging or internet service during evacuations can be helpful, and having more DMSs with backup power to provide accurate and real-time traffic information along the evacuation routes would be important. For hurricane-prone areas, policymakers should aim to enhance public awareness of the services and resources available during evacuations. This could involve regular organization of free seminars in libraries and schools for the public. Such sessions not only increase people’s awareness but also help them identify and use appropriate tools and resources for evacuation in difficult circumstances.
We also investigated socioeconomic and behavioral differences in the utilization of real-time traffic information platforms during evacuation and return. Households with more members, longer evacuation travel distances, and a history of multiple evacuations are more inclined to use real-time data platforms. Respondents under the age of 25, those with a graduate degree or a high school education or below, and those who evacuated before 2010 are less likely to use real-time traffic information platforms. Notably, respondents who evacuated before 2010 showed a higher reliance on the radio and TV for traffic updates, showing the impact of technological advances on preferences because smartphones were not popular before 2010. Conversely, respondents with more past evacuation experience tend to use navigation apps and social media apps for obtaining traffic information. In addition, users of official information sources value data accuracy highly, whereas TV users prioritize the accessibility of the information and radio users place an emphasis on the availability of the service. Furthermore, in relation to social equity, we found that less educated families prefer to use social media for information. To enhance inclusivity and ensure widespread awareness during evacuation orders, we recommend official announcements across multiple channels, including social media, TV, radio, and agency-provided sources, and suggest increasing the update frequency. Furthermore, to address the needs of groups without access to vehicles or internet services, particularly the elderly, we also suggest utilizing neighborhood networks for distributing information within communities and encouraging participation in the sharing economy, for example, through ride-hailing services such as Uber and Lyft, or by offering available car seats to those without vehicles during evacuations ( 19 ).
These findings provide valuable insights for researchers and policymakers in relation to emergency evacuation preparedness in Texas. By understanding the patterns and preferences of evacuees when accessing and using real-time traffic information, stakeholders can make informed decisions on the best ways of improving the effectiveness and efficiency of disaster response operations and obtain a better understanding of the benefits of expanding or upgrading traffic monitoring devices in the state.
A potential limitation of our findings is self-selection bias in the sample demographics. Specifically, the data exhibited an overrepresentation of individuals from three predominant categories: White; female; and high-income households. This may be because of the platform used for survey distribution (Nextdoor). To improve understanding of the topic, future research should include more discussion of equity among a diverse sample more representative of vulnerable groups. Such research should also examine the distinction between using a platform and having access to a platform, because this can help distinguish between individual preferences and equity concerns.
Footnotes
Acknowledgements
We thank the Texas Department of Transportation for their invaluable support. We also thank Kangni Jiang and Shobhit Saxena for their invaluable help and assistance.
Author Contributions
The authors confirm contribution to the paper as follows: study conception and design: L. Xu, K. Bathgate; data collection: K. Bathgate, S. Pan, J. Sun, Z. Han; analysis and interpretation of results: L. Xu, K. Bathgate, J. Robbennolt; draft manuscript preparation: L. Xu, K. Bathgate, J. Robbennolt, J. Sun, S. Pan, Z. Han, S. Boyles. All authors reviewed the results and approved the final version of the manuscript.
Declaration of Conflicting Interests
The author(s) declared no potential conflicts of interest with respect to the research, authorship, and/or publication of this article.
Funding
The author(s) disclosed receipt of the following financial support for the research, authorship, and/or publication of this article: This work was supported by the Texas Department of Transportation (0-7123). The conclusions are the authors' alone, and do not reflect positions of the Texas Department of Transportation or any other organization.
The conclusions are the authors’ alone, and do not reflect the position of the Texas Department of Transportation or any other organization.