
Abstract
A large number of casing failures occur during the volume fracturing operation of shale gas, making normal completion stimulations impossible. To solve this problem, rock mechanical experiments and numerical simulation experiments are carried out in this article. It is found that the macroscopic rock mechanical strength reduces most when the crack angle of fissured rock in Longmaxi Formation is 45°, and it reduces stably when the number of cracks increases to 8. The elasticity modulus ratio, yield strength ratio, and compressive strength ratio are 0.70, 0.71, and 0.68, respectively, based on which this article establishes the finite element model for shale gas well X201. Then, the secondary development realizes the dynamic adjustment of the rock mechanical properties during the fracturing. The correctness of method and model in the article is verified through comparing the simulated calculation of casing deformation and the field multi-arm caliper logging data. The casing failure mechanism is revealed, providing a theoretical basis for the prevention of casing failure caused by shale gas fracturing.
Keywords
Introduction
Volume fracturing is a new technology that can “shatter” the reservoir, form complex crack networks, and create “artificial” permeability. Crack initiation in the technology is realized by shearing, breaking, and slipping. This technology breaks through the traditional mode of crack percolation theory and significantly shortens fluid flow distance. It has stimulated unconventional oil and gas production greatly and been widely applied to the transformation of rock layer with higher brittleness. Meanwhile, it adopts the staged multi-cluster perforation. 1 The proposal of “volume transformation technology” subverts the classic fracturing theory. 2
Compared to conventional fracturing, volume fracturing is characterized by excessive stimulated stages, large fracturing volume, and high injection capacity in the operation process. The technique breaks up reservoirs into pieces and forms complicated fracture networks, which degrades the mechanical properties of formation rock much larger than the convention fracturing. There will exist complicated mechanical behaviors such as shear, leap, and slip around the casing string, which makes casing more prone to failure. In the development of China shale gas, frequent collapses and deformations of casing prevent the bridge plug from setting in the very place. The effect of fracturing operation is mitigated as a result, and the running of subsequent tools gets harder. Along with it, construction costs are increased and the construction becomes tougher, making it difficult to ensure the wellbore integrity of gas well and bringing a big risk for subsequent production operations.1,3–8
In order to reveal the mechanism of casing failure in the volume fracturing process, this article analyzes the typical well X201 with casing failure in the Changning-Weiyuan national demonstration zone of shale gas. Through a large number of rock mechanical experiments and numerical simulation experiments, the effect of crack angle and crack number on rock mechanical properties and its effect on casing failure in the volume fracturing process are studied. Moreover, a comparative analysis is conducted with the field multi-arm caliper imaging tool (MIT) logging curve of casing failure section in X201 well.
Analysis on the change of rock mechanical properties during volume fracturing
Basic data of X201 well
Located in Yibin, Sichuan Province, X201 is in the east wing of the top Middle Ordovician Shangluochang nose uplift in Changning anticline structure. The target layer is a part of Longmaxi Formation in Silurian.
X201 is a vertical shale gas well with measured depth (MD) of 2542 m. Completion is conducted with Φ139.7 mm × L10.54 mm casing with steel grade P110. IBC (Isolation Scanner, post-casing imager) cementing quality evaluation is good without significant channeling. According to logging data, elasticity modulus of the formation is 13–46 GPa, and average Poisson’s ratio is 0.23 at 2200–2550 m; the minimum horizontal stress is 45–50 MPa, and the maximum horizontal stress is 50–70 MPa, as shown in Figure 1.

Interpretation of rock mechanical parameters and in-situ stresses in X201.
Volume transformations are conducted twice at 2400–2525 m in the well. The fracturing fluid is injected directly into the formation through the casing, and the two-staged amount is 1953.5 and 1239.9 m 3 , respectively. The detailed fracturing parameters are shown in Table 1.
Fracturing operation parameters of X201.

Sticking occurs when the gauge tool (Φ114 mm) is run to make a wiper trip at 2441.6 m after two fracturing operations. Then, casing deformation failure may have occurred. MIT logging is subsequently conducted to perform an accurate inspection of the inside of casing, and it is found that serious casing deformation occurs near 2441 m. Casing deformation cannot be effectively prevented by simply increasing steel grade and wall thickness. It is initially thought that casing deformation failure may be caused by the degradation of fissured rock mechanical properties and the redistribution of near-well geostress field after the volume fracturing.
Fissured rock theory
Volume fracturing is to form the previous relatively intact rock in certain volume area into fissured rock with many multiple directional cracks, which changes the macroscopic mechanical properties. According to the related theories of fracture mechanics and several fracture criteria,9,10 rock damage is characterized by the progressive degradation of rock mechanical properties, leading to material failure. The critical stress criterion of rock damage can be represented as given in equation (1)

Rock damage is assumed to initiate when the maximum nominal stress ratio (as defined in the expression above) reaches a value of 1.
A scalar damage variable, d, represents the overall damage in the material. It initially has a value of 0. If rock damage evolution is modeled, d monotonically evolves from 0 to 1 upon further loading after the initiation of damage. The elasticity modulus and compressive strength are affected by the damage according to equations (2) and (3).
The linear degradation criterion of elasticity modulus is

The linear degradation criterion of compressive strength is

The formula to calculate the damage factor d is

From equations (1)–(4), it is shown that rock is continuously damaged due to new cracks formed in fissured rock during the volume fracturing process, resulting in such mechanical properties’ degradation as the elasticity modulus, compressive strength, and so on. However, the complexity of fracture networks formed by volume fracturing makes it hard to obtain relative damage parameters. Hence, there is no quantitative representation model for mechanical properties’ degradation. In order to solve this problem, this article carried out rock mechanical experiments, aiming at the Longmaxi Formation where casing failure occurred frequently. Mesoscopic numerical simulations based on Voronoi diagram were also conducted to analyze the change law of macroscopic mechanical properties during volume fracturing process.
Rock mechanical experiment of Longmaxi Formation
In order to reveal the mechanism of casing failure at 2400–2525 m in the well, the mechanical properties of fissured rock in the volume fracturing process were studied in the first place to establish the numerical inversion model in the fracturing process.
Cores in X201 well in Longmaxi Formation were selected for the triaxial compression experiment with the confining pressure of 53 MPa in the article. The experimental results as follows show the mechanical properties of intact rock before fracturing. The elasticity modulus is 22.6 GPa, the yield strength is 161 MPa, and the compressive strength is 262 MPa. The rock sample appears with an obvious breaking plane with a clear brittle fracture characteristic, as shown in Figure 2(a). The cohesion and the internal friction angle of rock in Longmaxi Formation are 15 MPa and 43°, respectively. Such rocks will form into fissured rocks with multiple cracks under the effect of large-scale hydraulic fracturing.
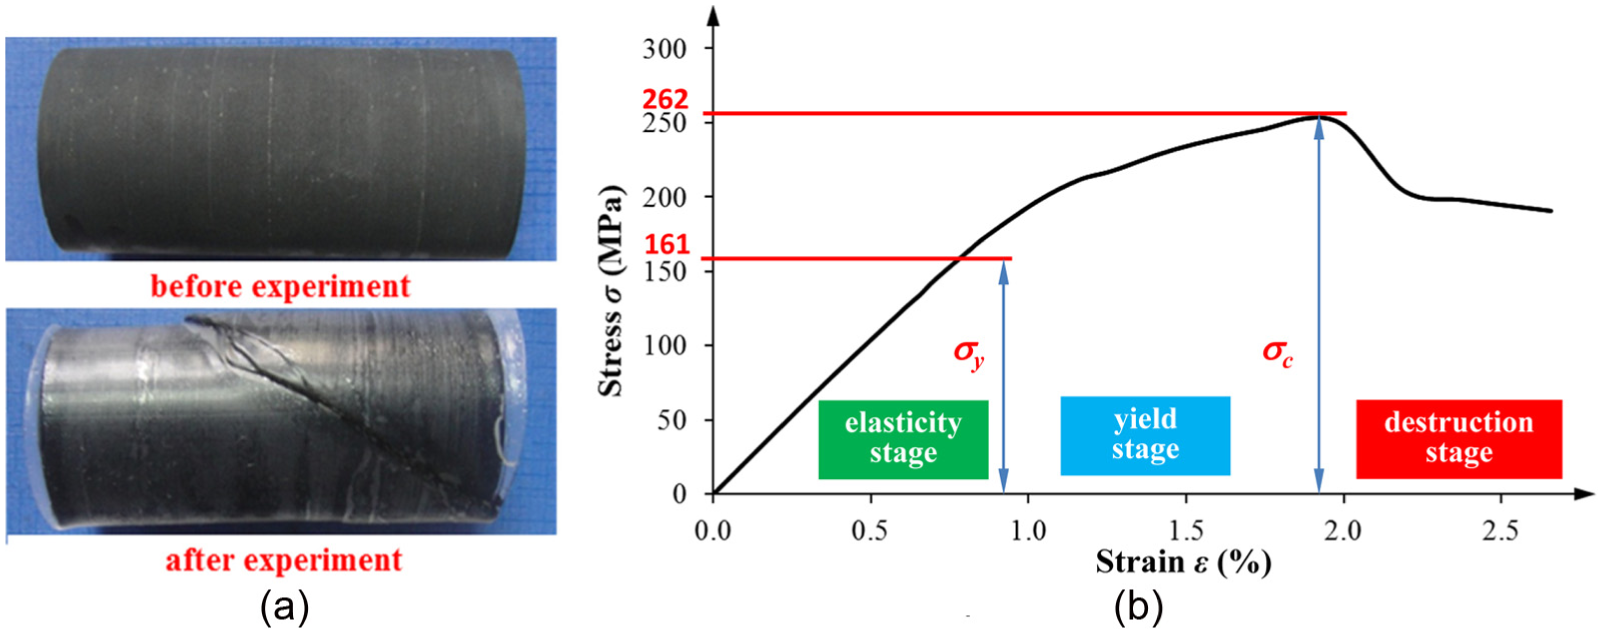
Test results of compression experiment in Well X201 in Longmaxi Formation: (a) cores comparison and (b) stress–strain curve.
Study on the change of fissured rock mechanical properties after volume fracturing
Volume fracturing aims to increase the transformation volume of shale gas reservoirs to the utmost extent and to form more complex crack networks. It significantly increases flow conductivity of reservoirs on one hand and divides the intact rock before fracturing into several small portions on the other. Mechanical properties, including elasticity modulus and strength, varied after fracturing and the original mechanical condition of casings changed. This article aims to study the effect of the formation with complex crack network on rock mechanical properties in the volume fracturing process. Therefore, the model was established with mesoscopic numerical simulation method based on the Voronoi diagram. The quantitative relationship of the effect of different crack angles and the number of rock mechanical properties was analyzed.3,11–16
Effect of crack angle on the rock mechanical properties
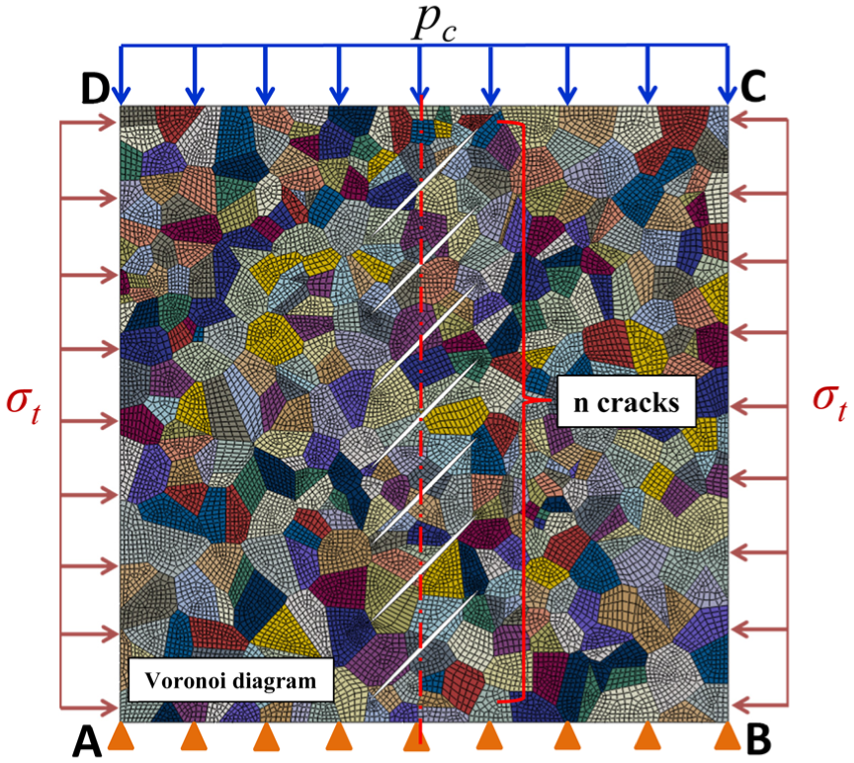
Cracks with different angles are formed in the rock in the volume fracturing process. To obtain the effect of crack with different angles on rock mechanical properties, the finite element (FE) model was established, as shown in Figure 3. The numerical experiments of the effect of a single crack under different angles on rock mechanical properties were conducted. Wherein areas of different colors are randomly generated Voronoi diagrams, representing different particle regions in the rock whose elasticity modulus, Poisson’s ratio, cohesion, and internal friction angle are 22645 MPa, 0.22, 15 MPa, and 43°, respectively (as obtained in the triaxial compression experiment above). The FE model is a square (a = 100 mm) and the crack is 25 mm long. The bottom AB is constrained, and the confining pressure σt is set as 53 MPa. Load (pc = 300 MPa) is imposed on the top edge with linear loading of 100 steps.

Finite element model of crack angle on rock mechanical properties.
According to the FE model shown in Figure 3, numerical simulation experiments for different crack angle θ (0°, 15°, 30°, 45°, 60°, 75°, and 90 °) were conducted, respectively, with the same method of data extraction as the triaxial compression experiment. The engineering stress–stain curves with different crack angles are shown in Figure 4, where the vertical axis represents stress (stress = pc) and the horizontal axis represents strain (strain = Δd/d).
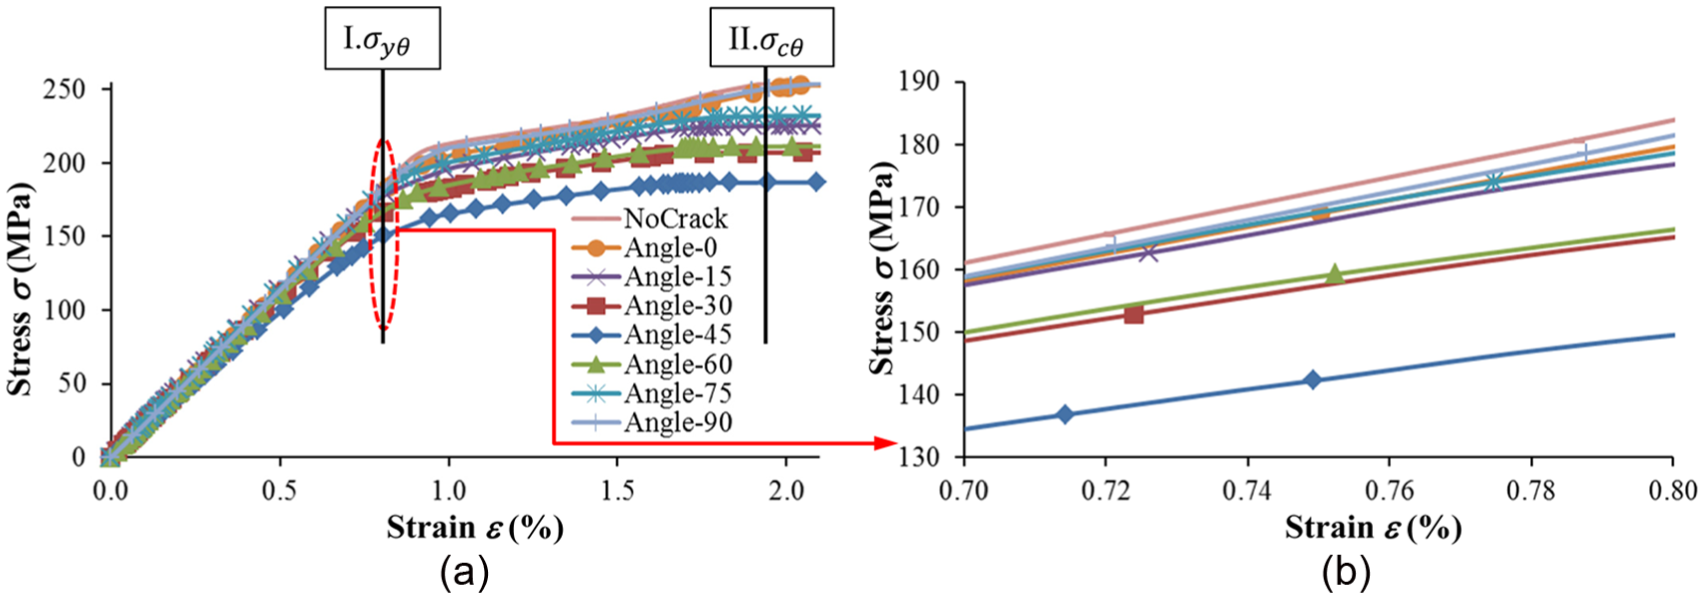
Stress–strain curves of rock under different crack dip angles: (a) stress–strain curve and (b) yield strength.
From Figure 4, it can be known that there are three stages in the failure process of rock mass: elasticity stage, yield stage, and failure stage. Compared to the results of triaxial compression test in Figure 2, the stress–stain curve of numerical simulations without cracks in Figure 4 is the same as that of the test basically. When the single crack in the rock is Lc long, there is varying change of stress–strain curves in different degrees. When θ equals 90°, the stress–strain curve substantially coincides with the one without cracks, indicating that the crack basically does not influence the rock strength. When θ is 0°, the stress–strain curve is slightly lower than that without cracks and has a smaller amplitude of variation by contrast. When θ is 45°, the stress–strain curve drops most drastically compared to that without cracks, indicating minimum rock strength. When θ is other value, the stress–stain curve for a single crack is between that without cracks and the one when θ is 45°.
Taking area I in Figure 4(a) as the yield strength of the rock mass, a partial enlarged view of the area is shown in Figure 4(b); taking area II as the compressive strength of the rock mass, the yield strength and the compressive strength values are obtained with no cracks and the cracks at different angles. The yield strength σy0 and the compressive strength σc0 of rock mass without cracks are 161.1 and 260.5 MPa, respectively. The symbols σyθ and σcθ are the variables depended on the crack angle θ, representing the yield strength and the compressive strength at different crack angles. To characterize the quantitative change relationship of strength between the fissured rock and the intact rock, the ratios of σys/σy0 and σcs/σc0 are used. Similarly, the elasticity modulus ratio of Eθ to E0 is obtained and analyzed. Eventually, the ratio changing curves of three kinds of parameters with θ are shown in Figure 5.
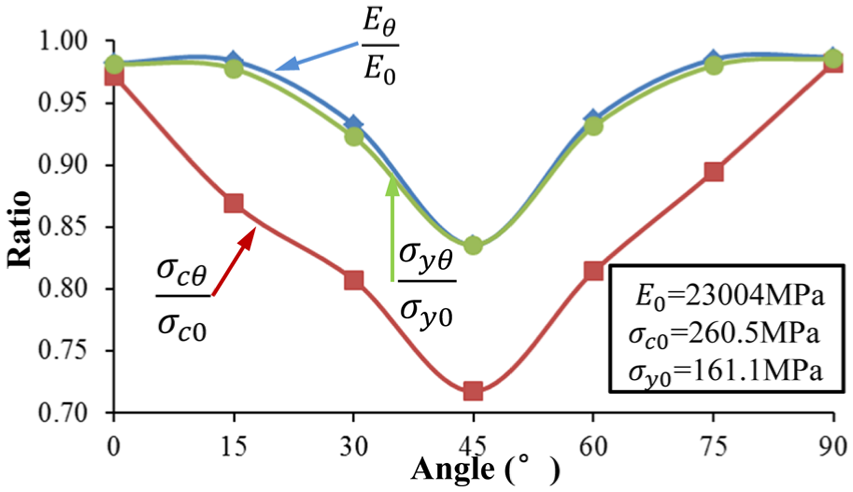
Curve of crack dip angle on rock mechanical properties.
As can be seen from Figure 5, the curve of elasticity modulus ratio (Eθ/E0) shows a wing-shape variation when the crack angle changes from 0° to 90°. With the increase in the angle, the ratio first decreases and then increases. The curve gradually declines from both ends to the middle part and is basically symmetrical about the line (θ = 45°). The yield strength ratio (σyθ/σy0) and the compressive strength ratio (σcθ/σc0) also show a similar trend, and the variation amplitude of compressive strength is the most obvious. When the crack angle θ is 45°, the ratios of elasticity modulus, yield strength, and compressive strength show a minimum value. They are 0.84, 0.83, and 0.72, respectively. This shows a significant effect of crack angle on the rock mechanical properties. Comparison with the previous researches verifies the reliability and accuracy of the established FE model.11,15
Effect of the number of crack on the rock mechanical properties
Many cracks are formed in the rock mass in the volume fracturing process. In order to obtain the effect of the crack number on the rock mechanical properties, the ultimate minimum strength of fissured rock based on the study of the single crack was studied. The numerical experimental model for the rock mass with multiple cracks at the angle θ of 45° was established, as shown in Figure 6.
Finite element model of crack number on rock mechanical properties.
The material mechanical parameters, crack attribution, boundary conditions, and loads are the same with that of the FE model in Figure 3. Numerical simulation experiments for cracks with different number n (1, 2, 3, 4, 5, 6, 7, 8, 9, 16, 32, and 64) were conducted, respectively, and stress–stain curves with different crack numbers are shown in Figure 7. The symbols σyn and σcn are the variables depended on the crack number n, representing the yield strength and the compressive strength with different crack numbers. Through the comparative analysis, the stress–stain curves show varying degrees of reduction as the crack number increases. The stress–stain curve of the rock mass is significantly lower when n is 2 than that when n is 1, indicating a great amplitude vibration. The stress–stain curve keeps a lower level when n is 3; however, the amplitude is smaller than before. When n is more than 8, the stress–strain curve substantially coincides, indicating basically no change in rock strength. The rock strength is reduced to the limit. When n is 64, the yield strength σyn and the compressive strength σcn are close to 115.7 and 176.7 MPa, respectively.

Stress–stain curve of rock mass with different crack number: (a) stress–strain curve and (b) yield strength.
As can be seen from Figure 8, with the increasing number of cracks, the elasticity modulus ratio En/E0 gradually decreases, with a declining amplitude, to a constant. The ratios of yield strength and compressive strength also show similar variation trend, of which, the variation amplitude of the yield strength is most obvious. When n is more than 8, the ratios of elasticity modulus, yield strength, and compressive strength become stable (0.70, 0.71, and 0.68). This shows that the variation in crack number has no significant effect on the rock mechanical properties in the volume fracturing process when n reaches a certain value.
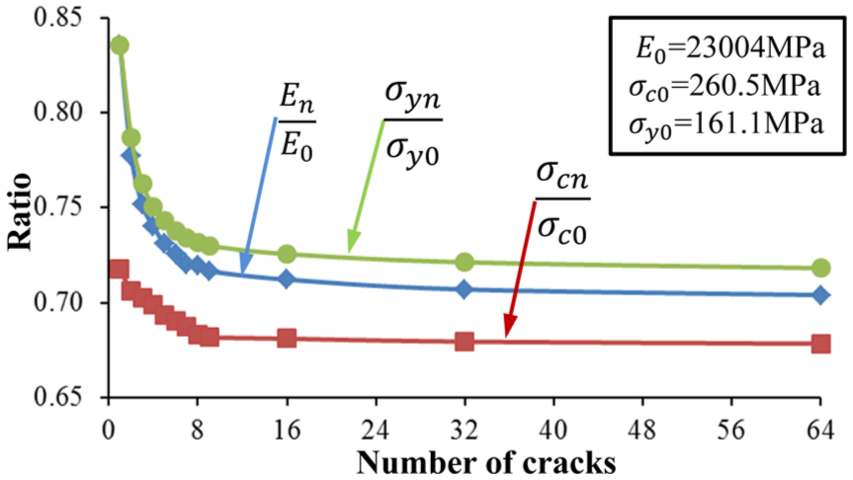
Curve of crack number on rock mechanical properties.
To sum up, cracks with different angle and number can be formed in the fracturing area in the volume fracturing process of shale gas and the mechanical strength of macroscopic rock continues to decrease. Through numerous rock mechanical and numerical experiments, the quantitative relationship and the change law of mechanical properties in X201 well during volume fracturing are obtained, providing a theoretical basis for the FE analysis of subsequent casing failure.
Study on the mechanism of casing deformation failure after fracturing
Establishment of the FE model of casing failure in X201 well
Based on the geological data, logging data, fracturing operation conditions of X201 well, combined with the theory of rock damage mechanics and elastic–plastic theory, aiming at the position of casing failure, the three-dimensional (3D) FE model in X201 well during volume fracturing was established (200 m long, 5 m wide, and 5 m thick), as shown in Figure 9.
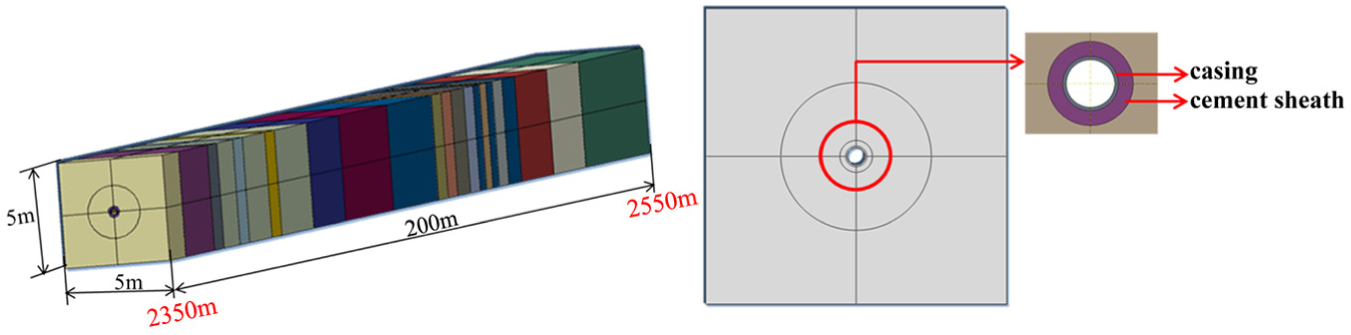
3D finite element model during volume fracturing in X201 well.
Six surfaces of the model are the far-field boundary conditions. Experimental and logging data rock mechanics in Figure 1 are employed to set initial mechanical parameters before volume fracturing.
This article has set up multi-analysis steps to simulate each stage of the volume fracturing with FE software. In the process of volume fracturing, the basic parameters of fracturing fluid pressure in casing and corresponding fracturing areas (pore pressure) are shown in Table 1.
*Field is a kind of keyword to specify predefined field variable values, which could be used to adjust the material parameters through changing the values of dependent variables indirectly used in the analysis. Using that keyword and secondary development, degraded material properties are reset to the fracturing areas dynamically in the analysis according to quantitative relationship above.
Analysis of the FE numerical simulation
Based on the established FE model of formation-cement sheath-casing in the volume fracturing process of shale gas (see Figure 9), von Mises stress distribution contours of casing near the damaged position after two-staged fracturing are shown in Figure 10.
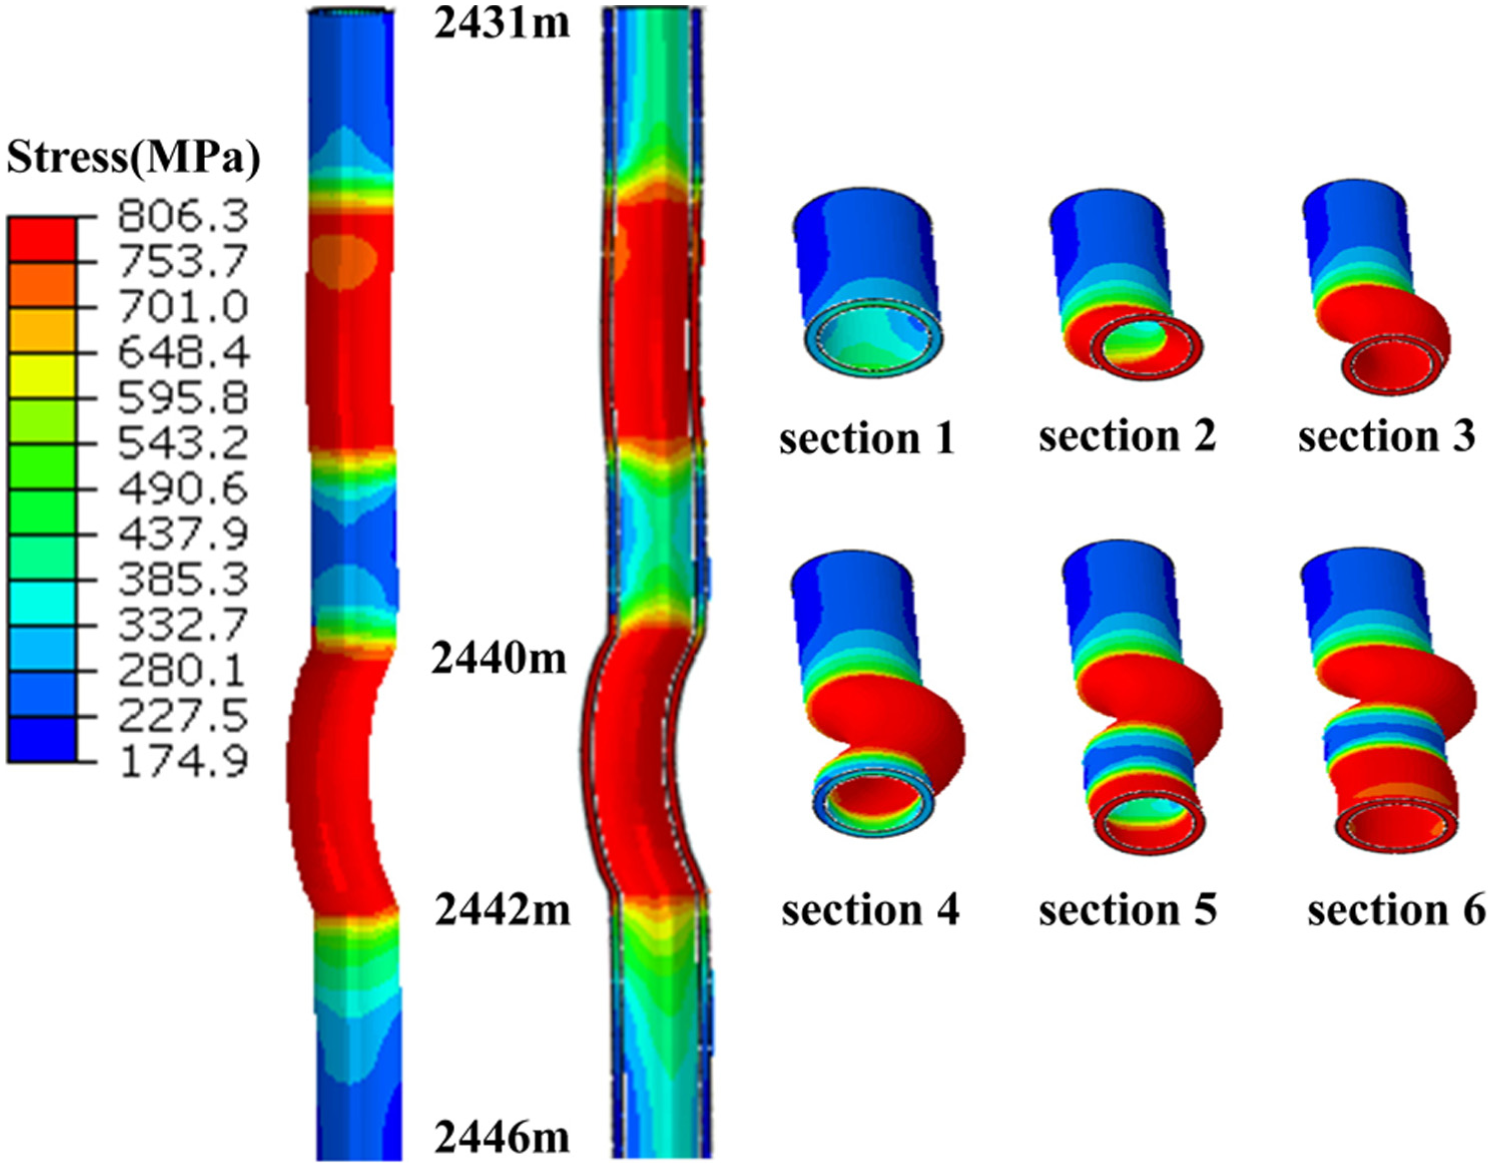
FE results of damaged casing section.
As can be seen in Figure 10, the maximum stress of the casing reaches 806.3 MPa after two-staged fracturing and some elements of casing are in the yield stage; the casing bends obviously at 2440–2442 m and elliptical deformation occurs in the casing profile. Qualitatively, the large deformation near 2441 m made the running of rigid gauge tool difficult after the volume fracturing.
To further quantitatively compare and analyze the casing deformation, the cross section of the casing is divided into 12 equal parts based on the calculation. The distance between ends (phase angle of 180°) is the inner diameter of deformed casing labeled A–F, respectively, as shown in Figure 11. It can simulate the result that is similar to that of the field MIT logging curve and compare the accuracy of numerical simulation results more directly and clearly.

Comparison diagram between simulation and MIT logging data.
By comparing MIT logging curves, as shown in Figure 11, it can be seen that severe casing deformation does occur at 2440–2442 m. The minimum inner diameter is about 110.8 mm, and the maximum inner diameter is about 126.1 mm. The casing ovality 1 can be calculated by equation (5)

The maximum casing ovality is 12.9%. The results accord with that of MIT logging curve, accurately simulating the position and amplitude of casing deformation failure. It proves that the model and method in the article are correct and effective.
Thus, casing failure of X201 well is caused by the elliptical deformation of casing cross section led by volume fracturing. The Φ114-mm gauge tool cannot pass through the damaged casing whose inner diameter is only 110.8 mm, and sticking occurred at 2441.6 m. The casing failure mechanism during volume fracturing of shale gas wells is revealed.
The study above shows that the casing deformation failure during volume fracturing is mainly resulted from large ovality caused by the extrusion and shearing during volume fracturing process. Therefore, increasing steel grade cannot solve the elliptical deformation of casing. Instead, increasing the flexural strength by increasing wall thickness can effectively improve the resistance to ovality. In addition, the reasonable spacing design of volume fracturing can also help solve casing deformation failure. The optimal spacing design based on geological data, rock properties, and in-situ stress filed should be applied instead of the simple uniform one.
Conclusion
In this article, aiming at the effect of complex crack networks on rock mechanical properties in the volume fracturing process, the model was established with mesoscopic numerical simulation method based on the Voronoi diagram, and the quantitative relationship of the effect of different crack angles and the number of rock mechanical properties was analyzed.
Through a large number of rock mechanical experiments and numerical experiments, this article obtained the quantitative relation between the macroscopic mechanical strength of rock and the mesoscopic characteristics of crack in fissured rock mass. It is found that rock mechanical properties reduce most when the angle of single crack in Longmaxi Formation is 45°; rock mechanical strength tends to be stable when the crack number is more than 8.
The numerical simulation for casing failure during the volume fracturing was conducted, and the obtained mechanism of casing failure is elliptical deformation of casing section. Oversize ovality leads to sticking of subsequent run tools. Comparison with the field MIT logging data verifies the effectiveness of the method used in this article and the accuracy of calculations.
Increasing wall thickness is more effective to improve the resistance to ovality than increasing steel grade. In addition, the reasonable spacing design of volume fracturing can also help solve casing deformation failure.
Footnotes
Appendix 1
Academic Editor: Farzad Ebrahimi
Declaration of conflicting interests
The author(s) declared no potential conflicts of interest with respect to the research, authorship, and/or publication of this article.
Funding
The author(s) disclosed receipt of the following financial support for the research, authorship, and/or publication of this article: This study was supported by the National Natural Science Foundation of China (nos 51504207 and 51574198), Research Fund for the Doctoral Program of Higher Education of China (no. 20135121110005), and Key Project of Natural Science of Sichuan Education Department (no. 14ZA0037).