
Abstract
Accurate predictive method for ship dynamic is a keynote precondition for structural design and an important consideration for strength evaluation. A wave-ship coupling model focusing on the estimating of ship dynamics is numerically established to solve the fluid–structure interaction. Numerical calculation based on the presented algorithm is carried out, and the dynamical response for both ship and fluid is thus investigated with MATLAB. The dynamical responses including the structural force, deformation, velocity, and energy with different ship mass and stiffness are obtained. Experiment is conducted in the towing tank to investigate the peak frequency and transient amplitude with different wave speeds. It is found that the ship dynamics is closely related to the quality and stiffness of the structure, as well as the wave velocity of the fluid. An appropriate estimating method for ship dynamics is thus proposed through series of discussion on numerical results and experimental data.
Keywords
Introduction
Ship safety is of grand significant to the navigation in order to guarantee confidence in the safety performance of the ship. 1 In order to optimize the timing of ship steering, maneuvering the control in big waves, and warn dangerous operating condition, the research on ship dynamics of fluid–structure interaction (FSI) is significant for the development of ocean industry and ship safety. 2 During the navigation, complex forms of dynamical deformation are produced with the effect of long-term wave loads, affecting the reliability of the ship. As the increase of ship scale and tonnage, structural materials with high strength are adopted to reduce the overall quality. The natural frequency of the hull structure regarding to the stiffness and mass is therefore dropped; the fatigue life and safety performance of the hull structure is seriously influenced. 3 Moreover, the internal factors including propeller excitation, bearing support, oil film lubricating, and gear crack of the shaft system will cause complex vibrations and noise, leading to intense hull deformation through the connection between hull structure and shaft system.4–6
The FSI investigates the dynamical performance of a system that consists of both fluid and structure simultaneously. The most significant characteristic is that the fluid motions actioned on the structure and while the structure response affects fluid flows. 7 As the water is incompressible, the fluid force caused by fluid inertia and deformation, acting on the structure and changes its motion through the interface. Under the action of fluid force, the structure produces flexible deformation. As the structural inertia, the deformation reacts on the fluid, changing its motion state. That is the key point of the FSI problem. Since the ship always sails on the water, the integrated system is a FSI system, 8 for which the water flows affect ship motions and its elastic deformation (Figure 1). Reversely, the motions of ships are also affecting the distribution state and motion performance of the water flows through wet interaction interfaces. 9 Therefore, to estimate more accurate deformation of the hull structure, the investigation on an integrated water-ship system is necessary for ship safety.

The mechanical relationship of the FSI. 7
In the previous research, J Michell 10 proposes the theory of ship wave making resistance. As the complexity of the hydrodynamics, the viscosity of the flow surface is not considered in the theory. With the rapid progress and gradual maturity of the flow theory, theoretical method for FSI is developed during recent years. 11 On the basis of hydro elasticity theory, the inertia force of the structure and the hydrodynamics of the fluid are considered as an integral system to describe the interaction. S Denis and W Pierson 12 propose the statistical definition of the wave effect in flow field and provided theoretical foundation for the dynamical motion of ship. B Kroukovsky 13 solves the differential equation for the interaction between ship and regular wave on the basis of the fluidic velocity and acceleration. W Jacobs 14 calculates the bending moment of the ship with the influence of vertical force. G Vossers 15 analyses the hull deformation caused by the velocity, damping, and excitation force of the waves. J Jensen and T Pederson 16 investigate the bending moment and shear stress of the ship from regular wave to random wave. Moreover, the research of time-domain strip theory that dealt with nonlinear problem in time domain is developed gradually.17–19 The theory had the characteristics of low computational work and high calculative precision, but the accuracy decreased under the irregular wave. In this situation, J Hess and A Smith 20 develop the arbitrary three-dimensional hydrodynamic theory to elevate the linear problem to the study of nonlinear systems.
With the expert application of finite element method and rapid development of computer capacity, the numerical software based on hydro elastic mechanics is adopted to define the function of the fluid. 21 H Söding 22 discusses the ship safety problems involve various kinds of flow computations. C Mei 23 finds that the steady-state problem of ship depends on the wave resistance through numerical solution. M Neves and C Rodríguez 24 present a mathematical model and conducted the numerical simulations from the model to investigate the vessel’s motions in head seas. A Feng et al. 25 use desingularized integral method combined with mixed Euler–Lagrange method to solve the 2D nonlinear FSI problem. J Cercos-Pita et al. 26 investigate the coupled response of a vessel with a free surface through a six-dimensional simulation code in combination with a computational fluid dynamics solver. These modeling methods and calculation technology for FSI are deeply imperative to provide practical guiding for shipbuilding industry.
In addition to theoretical and numerical method that calculating the dynamical response of the ship, investigations have mainly focused on the experimental tests for the ship dynamics. N Fonseca and C Guedes Soares 27 investigate the nonlinear heave performance of a containership going forward in regular waves. S Bennett et al. 28 experimentally investigate the influence of abnormal waves on a vessel traveling with forward speed in irregular seas. I Drummen et al. 29 conclude that hull flexibility will improve the ship’s vertical bending moment in related sea states. These measurements cannot directly reflect the interaction between water and hull deformation, but can be used to verify the theoretical and numerical results.
Nevertheless, the disadvantage is that the previous theoretical and numerical researches are inadequate enough to deal with the ship dynamics including structural force, deformation, velocity, and energy simultaneously. Meanwhile, various structural parameter and fluid velocity with different forms of combination are not be included in the previous research. These methods contain a serious error caused by the approximating of the interaction conditions, the simplification of the model, and other mechanical property. Moreover, the period of calculation is long and the requirements of computer configuration are high during the numerical simulation. The key point including interface interaction, constitutive relationship, and integration process of the FSI is incompletely understood. Thus, the most suitable model should be applicable to estimate ship dynamics with the abovementioned factors and be reasonable to be solved in numerical calculation.
Therefore, an appropriate method is proposed in the investigation of the ship dynamics to analysis the FSI problem. In this article, a numerical model is developed regarding the mentioned impact factors to calculate the dynamics in both time and space domain. The structural response including force, deformation, velocity, and energy is thus obtained through numerical calculation. Moreover, experiments with various cases are conducted in the towing tank to discuss the effect of wave velocity on structural frequency and amplitude.
Theoretical basis
For the FSI, the dynamical response of both fluid flow and structure domain is considered simultaneously. The selection of the solution method is directly relate to the length of the calculation time and then the accuracy of the results. In the process of the solution, the wave equation is applied for the flow surface. The fluid domain is separated into moving grid in the direction of the ship motion. Multiple solving is adopted in time and space domain. Meanwhile, the traditional finite element method is applied to discrete the structure and the time integral method is adopted for solving. The physical model of the FSI is shown in Figure 2.

The physical model of the FSI. 30
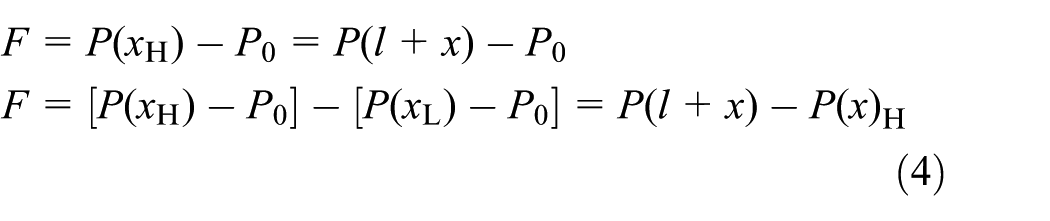
Defining the height of the motion direction is x and the initial position of the ship is l. The bottom and top of the motion direction are xL and xH, respectively. The ship remains a balanced state at the initial position. The non-velocity fluid suffered an external pressure of P0 and is controlled by the Euler equation. As the ideal fluid is homogeneous and incompressible, its velocity potential satisfied the Laplace equation and the boundary condition of nonlinear flow. The mathematical equation of the fluid [xL; xH] can be given

where ρ, v, P, and E are the density, velocity, pressure, and energy of the fluid. Defining the height of motion direction is h, the pressure and energy can be obtained by

The boundary condition of the fluid and the structure is respectively

Defining the external force of the fluid and structure is respectively
The fluid model
The solution for deformation of the flow grid at every time step can not only ensure the compatibility of the fluid and structure during the movement, but also prevent the penetration of the fluid in the nearby of the ship. Assuming the flow velocity is ωx and the speed of the structure is

The defining external force F acts on the interface of the two boundary conditions. The speed of the ship is equal to the velocity of the flow. Meanwhile, the boundary condition of the contact surface for both fluid and structure is the same. The moving grid of the fluid is divided through the Euler equation
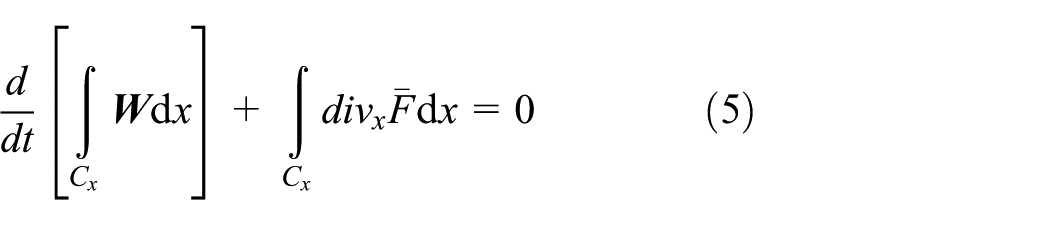
where x is the height of the structure in the motion direction,

Equation (5) can be rewritten to an implicit form of finite volume

where

Calculating the area

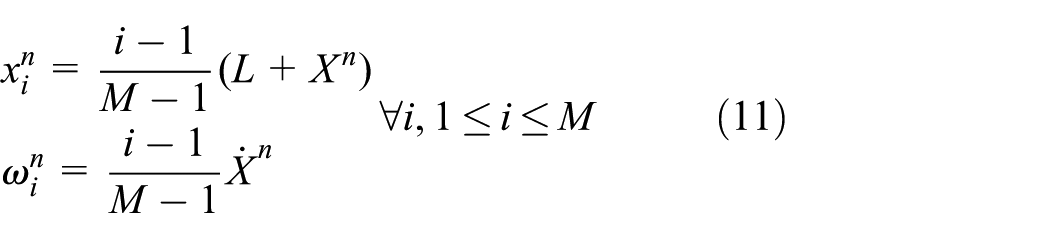
As the position of the grid is determined by

The grid size is uniform and the velocity is consistent for the flow at any moment. Assuming the amount of the grid is M, the motion equation can be expressed as
The ship model
The fast integration method is applied for the ship model. Assuming the deformation xn, speed

Based on abovementioned assumption, the solution an + 1 for the motion equation man + 1 + dvn + 1 +kxn + 1 = Fn + 1 is calculated. As the external force F is known, the implicit Newmark–Wilson method is applied to expand the deformation and speed of the structure according to the sequence of time

where, Δt is the time interval between the two solution processes t and t +Δt. The formula of acceleration

The interaction
In the interaction, the structural deformation at the moment tn + 1 is calculated and the position of flow grid is regained through time step Δt. For the solving of the sub-cycle of the fluid, the final position of the grid remains the identical position before calculating. During the multi-step cycle of the fluid, the sub-cycle amount N of the flow grid can be obtained:

The average velocity

Assuming the energy of fluid and structure, Ef(t) and Es(t) are

Assuming the time integration of the structure conforms to the trapezoidal rule: the flow exerts same pressure

The total energy variation of each sub-cycle of the flow can be expressed as

Because of the variation of the pressure distribution during the circulation of the flow, the total energy variation can be concluded through both the fluid and structure

Numerical calculation
Parameter definition
The dynamic response of the FSI is numerical calculated with MATLAB. Defining the initial height of the ship is H = 1.0 m, namely the distance from the bottom to the surface of the fluid. The equilibrium position of the structure, being the draft depth of the ship is L0 = 0.06 m. Defining the initial pressure, density of the fluid and flow speed is p0 = 1.0 × 10⁵ Pa, ρ = 1.0 × 101 kg/m3, and v = 0.1 m/s, respectively. The calculation time is half a cycle with a step length of N = 100. Table 1 lists four study cases for the numerical simulation to investigate the influence of structural mass and stiffness on the interaction. And the natural frequency and motion period of each can be obtained through f = (k/m)0.5 and T = 1/f.31,32
The peak frequency and motion period for the four cases.

Numerical results
Figure 4 shows the 3D diagram of the pressure for the four cases. The coordinate axis showed the time domain (time/T), the position domain (x/m), and the dynamical response (pressure), respectively. The time is half a cycle and the position is the height of the fluid. Here, the height x includes the initial height of 1.0 m and draft depth of 0.06 m. The result for cases 1 and 4 keeps the same with a ultimate pressure of 1.2 × 10⁵ Pa; the reason is the same ratio of stiffness to mass (as shown in Table 1). The diagram of case 2 shows smooth lines as the frequency is lower and the magnitude of the pressure is much smaller with a maximum of 1.1 × 10⁵ Pa. On the contrary, the curve in figure of case 3 increases obviously and its distribution is extremely uneven. The maximal pressure is above 1.3 × 10⁵ Pa because of the larger frequency among all cases. Moreover, the pressure is corresponding larger as the frequency increased from 31.8 to 225.1 Hz. It can be concluded that the dynamical response of the FSI increased with the natural frequency of the ship.

The 3D diagram of the fluid pressure for the four cases: (a) Case 1, (b) Case 2, (c) Case 3, and (d) Case 4.
Figure 5 shows the detailed discussion dynamical response of the fluid domain and the comparison of the numerical results for the four cases. Figure 5(a) shows the comparison of fluid pressure along with the height of the fluid. It is the results of each case in Figure 4 at time of 0.5 T with the units of the vertical coordinate is ρt/ρ0. It can be seen that the fluid pressure reached largest at the time of half a cycle. And the amplitude of the pressure is the same as Figure 4 showed. Meanwhile, the value of pressure varied with the height of the fluid.

The comparison of the numerical results of the fluid: (a) comparison of the fluid pressure and (b) comparison of the fluid deformation.
The comparison of fluid deformation regarding to the position is displayed in Figure 5(b). It shows the fluid movement of the fluid surface during the interaction. The displacement of case 2 is the biggest and case 3 is the most small, which is determined by the frequency of the structure.
Similarly, the structural dynamical response is discussed in detail. Figure 6(a) shows the comparison of structural force during the interaction. For case 1, the force various significantly because of the heavy weight and low stiffness. While, the same weight of case 3 changes slightly as its high stiffness. And the variation of cases 2 and 4 is relatively small as the mass is much lighter.

The comparison of the numerical results of the structure: (a) comparison of the structural force, (b) comparison of the structural deformation, (c) comparison of the structural velocity of 1.6 m/s, and (d) comparison of the structural energy.
The results in Figure 6(b) are the comparison of structural displacement in half an motion cycle. Comparing with others, the motion for the four cases suffers slight difference in the overall diagram. While from the local amplification, the structure of case 3 shows the biggest displacement variation. The results make good agreement with the fluid pressure of the fluid in Figure 5(a).
It can be found that the comparison of structural velocity in Figure 6(c) is similar to the fluid pressure in Figure 5(a). The reason is that the ratio of stiffness to mass for case 3 is larger than other cases. It causes the pressure of the fluid much intense and reacted to the structure. While the results of other three cases trend to be stable.
The comparison of structural engine is shown in Figure 6(d). The energy variation of cases 1 and 2 are nearly the same and the results for cases 3 and 4 are unchanged essentially. It can be concluded that the energy of the structure is closely related to the stiffness. Its energy variation with small stiffness is severe and that with large stiffness is slight.
Experiments
Experimental setup
In order to investigate the structural dynamical response on the fluid flow, the wave-ship experiment is conducted at the towing tank in Southampton Solent University. The length, width, and depth of the tank (shown in Figure 7) are 60, 3.7, and 1.85 m with the ultimate carriage speed of 4.6 m/s. The experimental platform consists of the main control system (shown in Figure 8), the ship, the fluid, and the motor-driven paddle wave generator. The main control system concludes a displacement sensor to collect and analysis the actual displacement of the fluid. And the experimental results are recorded by the data acquisition system built in the ship. The wave including different frequencies, amplitudes, and phases is produced by the wave generator that is able to generating waves with a maximum wave height of 0.1 m and wave frequency of 2.0 m/s.

The experimental towing tank.

The main control system.
In order to satisfy the test condition with various parameters while restrict the extra resistance caused by the adding appendages. A towing tank ship model is designed and manufactured to meet the requirement of the experiments. The ship model is free to heave and pitch during the test. The main parameters of the ship are shown in Table 2. The ship model is strengthened by adding a longitudinal stiffener to ensure reliability for the test in various waves.
The parameters of the ship model.

A sensor is designed in the interior (approximate at the vertical and longitudinal center of gravity) of the ship model to measure its multi-directional displacement, velocity, and acceleration. The approximate time of each run is 1 min depending on the wave velocity and its reaction from the opposite side of the tank.
Free running test is conducted in the towing tank to investigate the response of the FSI with the ship model not fixed on the carriage. To study the effect of the natural wave period, the ship is placed in the center of the tank and advancing in head waves with the wave speeds is defined as 1.0, 1.2, 1.4, and 1.6 m/s. Moreover, the wave is defined as regular wave with an amplitude of 0.06 m to maximize the ship’s response and minimize the drip ingress from the freeboard. During the test, marking a location and recording the time with every 2 m along the direction of the ship calculate its average speed. The results between the interval of the fourth and sixth meters are selected as the experimental data.
Data analysis
The heave response of the ship is obtained through calculation of the root mean square in time domain with varying wave frequencies. Figure 9 indicates the time–frequency curve of the vertical acceleration of the four cases. In the curve, the abscissa and ordinate denote the results in time domain and frequency domain, respectively. Thus, the results of time domain and frequency domain can be analyzed simultaneously. It can be found that the red part along the abscissa is the transient results and that along the ordinate is the harmonic results. For the four cases, the peak frequency corresponding to the abscissa is nearly unchanged (about 10 Hz) with increasing wave velocity. While, the ultimate acceleration corresponding to the ordinate increases from 0.11 to 0.25 m/s2 under varied wave velocity. To extract the specific data, the power spectral density and transient amplitude are analyzed for the four cases.
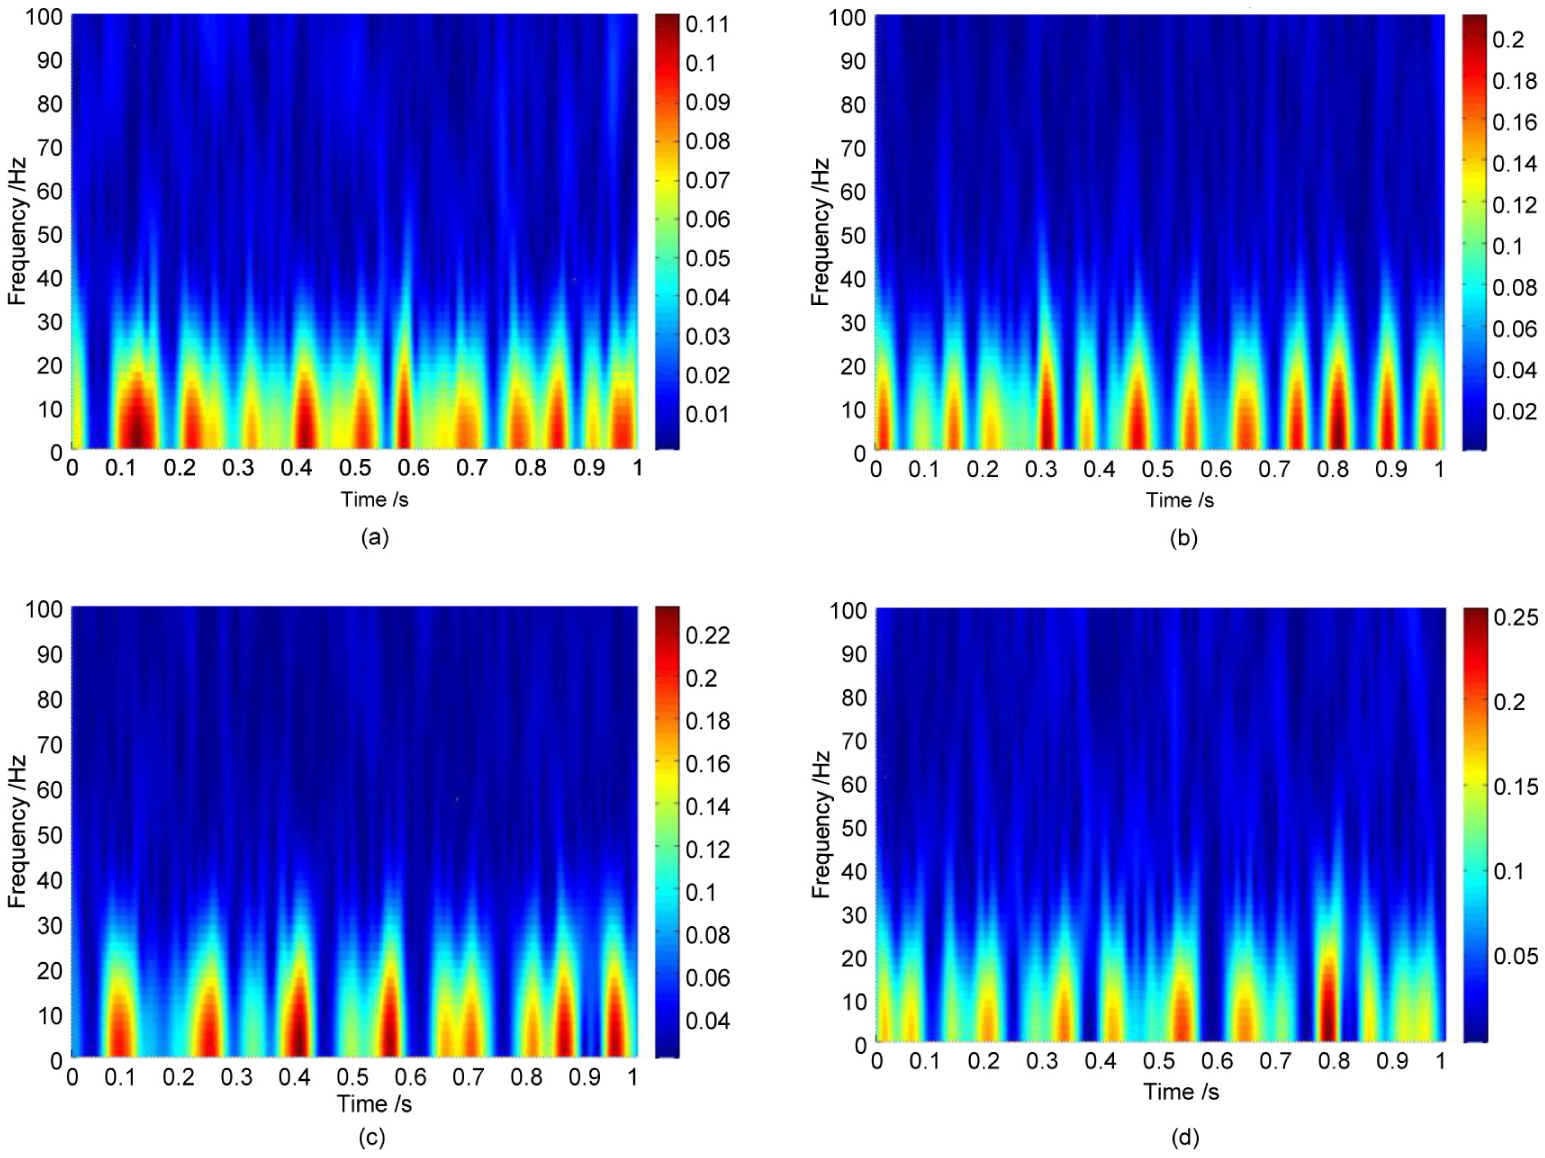
The time–frequency curve of the vertical acceleration: (a) 1.0 m/s: time–frequency spectrum, (b) 1.2 m/s: time–frequency spectrum, (c) 1.4 m/s: time–frequency spectrum, and (d) 1.6 m/s: time–frequency spectrum.
Figure 10 shows the power spectral density of the vertical acceleration for the four cases. The data reflect the ship’s performance advancing in regular waves over a range of wave velocities. The diagram shows the peak frequency of the ship model in the vertical direction. For the harmonic results, it can be found that the frequency at different wave velocities is 10.7, 11.7, 7.8, and 8.9 Hz, respectively. As these data show very slight difference, it means the frequency of the ship model is independent of the wave velocity in the flow fields.
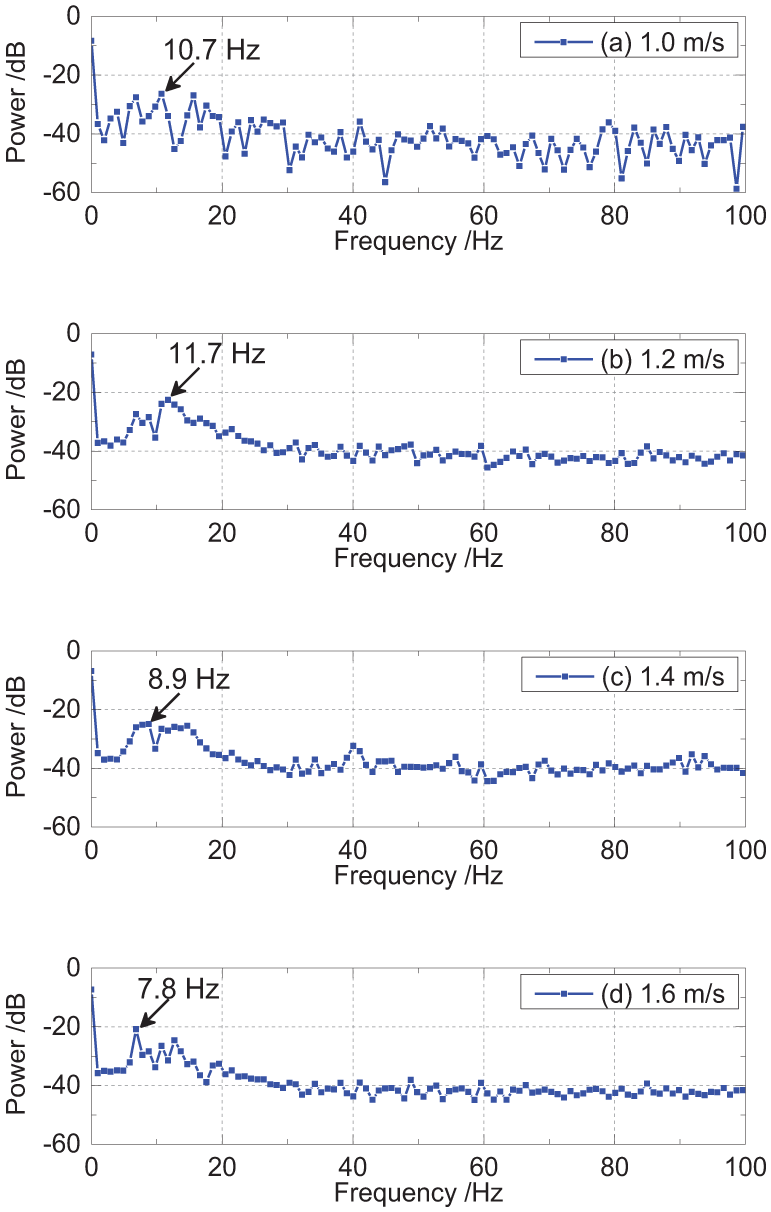
The power spectral density of the vertical acceleration.
Figure 11 shows the transient amplitude of the vertical acceleration for the four cases. The figures shows that the motion of the ship is effect by the wave velocity. The dynamical response becomes larger as the flow rate increases. The vertical accelerations of the ship are 0.03, 0.04, 0.06, and 0.07 m/s2 with the wave speeds increase from 1.0 to 1.6 m/s. This indicates that the variation in the transient response is due to the change of the wave velocity. As wave frequency raises to approach the structural natural frequency, the acceleration response is increased gradually.
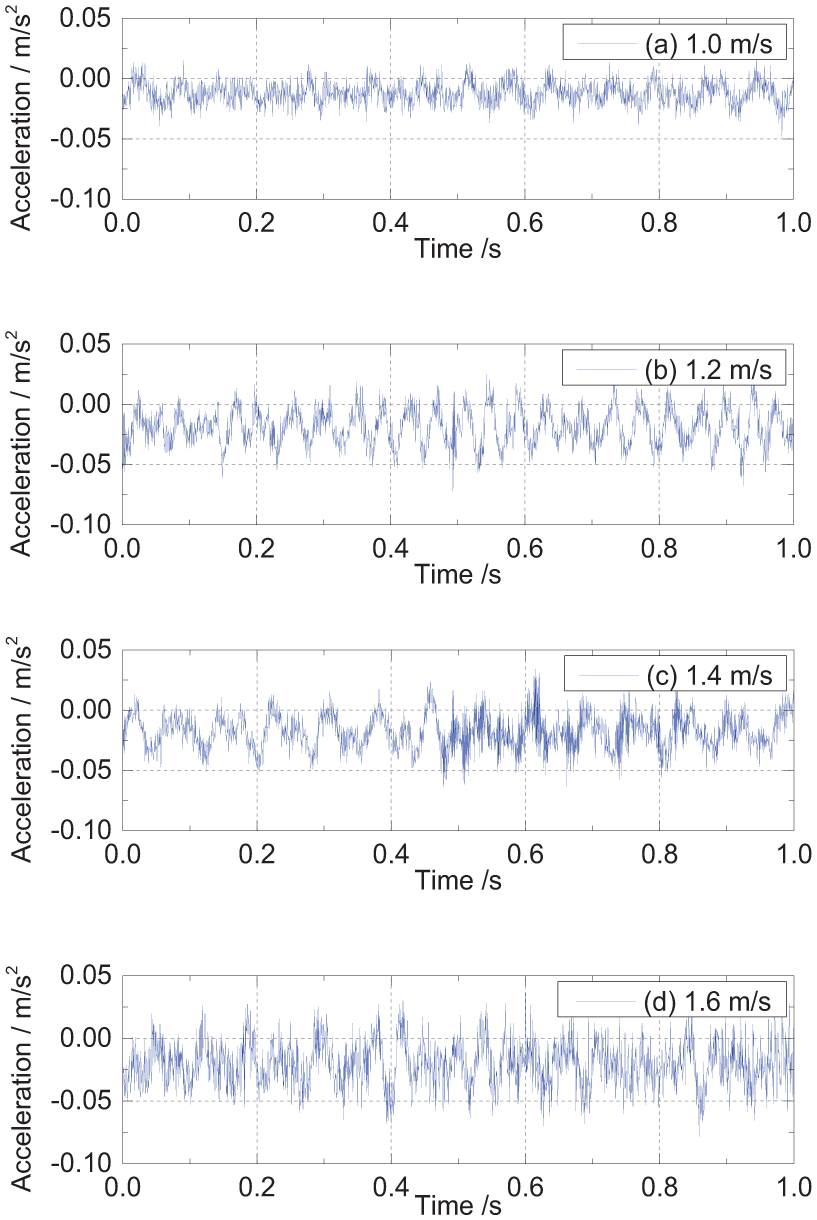
The transient amplitude of the vertical acceleration.
Conclusion
The presented work addresses a significant need to estimate ship dynamics in the FSI. Due to its complex nonlinear signature, the ship motion in time and space domain is hard to be accurately extracted. In this study, the dynamical response of the structure has been investigated on the basis of numerical modeling by considering the structural mass and stiffness. Along with the establishing of the fluid model, the structure model, and the coupling, a theoretical estimating method for the structural force, deformation, velocity, and energy is thus obtained. Numerical analysis on the basis of theoretical model is calculated and the applicability is investigated according to a comparison of four study cases. Meanwhile, experiments regarding peak frequency and amplitude of the ship under the condition of various wave velocity are conducted. A more appropriate numerical model is thus proposed for the ship dynamics of FSI.
The calculations and experiments have been investigated over a range of running modes to investigate the influence of structural parameter and fluid properties on the ship dynamics. The analysis results demonstrate that the peak frequency of the ship is found to be independent of the increasing wave velocity. Meanwhile, it should be point out that the fluid and structure are mutually interacted during the navigation. To minimize the coupling effect caused by the fluid, the interaction should be considered and reduced during the design of the ship to improve its reliability. Moreover, the maximum amplitude of the structure is found to increase with increasing structural frequency, as well as the wave velocity. In addition to the deformation, the response including force, velocity, and energy of the structure is also increased. The findings in this work will develop enriched calculation method for FSI, providing useful techniques for marine designers and bringing in substantial economic benefits to the maintenance industry.
In future works, the research will focus on the extending of the model from one dimension to two dimensions. The model parameters will be modified and the iterative algorithm during the calculation process will be optimized to improve the effectiveness. Meanwhile, the accuracy and applicability of the theoretical model regarding to the FSI problem will be discussed and investigated.
Footnotes
Handling Editor: Zhixiong Li
Declaration of conflicting interests
The author(s) declared no potential conflicts of interest with respect to the research, authorship, and/or publication of this article.
Funding
The author(s) disclosed receipt of the following financial support for the research, authorship, and/or publication of this article: This research is supported by the National Natural Science Foundation of China (no. 51139005 and no. 51509194), the China Postdoctoral Science Foundation (no. 2017M620341), and the Hubei Provincial Natural Science Foundation of China (2018CFB371 and 2016CFB265).