
Abstract
This article presents the results of simulated hemispherical die stretching of low-carbon steel (ST12 and ST14) blanks of various thicknesses. The simulations were designed to obtain forming limit diagrams. Multiple criteria, including the second time derivatives of major strain, thickness strain and equivalent plastic strain extracted from the strain history of simulations, were used to accurately detect the start of necking in forming limit diagrams. This is to say that necking starts when the second derivative of the thickness strain, major strain or plastic strain reaches its maximum value. Knowing the onset of necking, one can measure the major and minor strains at the critical area and produce the corresponding forming limit diagram. Moreover, a modified Marciniak and Kuczynski method was used to predict the forming limit diagrams. The results from the proposed methods and those from experimental tests are compared to demonstrate the efficiency of the proposed methods.
Keywords
Introduction
Forming limit diagrams (FLDs) help designers to predict the success probability of a sheet metal forming process such as automobile body manufacturing. Understanding the forming behavior of a sheet metal is the key to its practical efficacy, along with a thorough production cost analysis. The FLD has been widely accepted as an effective tool for the formability analysis of sheet metals. An FLD, or forming limit curve (FLC), is often used to predict the forming behavior of sheet metals.1–3 Introduced by Keeler 4 and Goodwin 5 in the 1960s, FLDs could be achieved both theoretically and experimentally. To find the FLD, the sheet metal is subjected to various stress combinations leading to various sets of principal stresses and principal strains. For this purpose, some sheet metal specimens of constant lengths and variable widths are stretched by a hemispherical punch (out-of-plane stretching) or flat punch (in-plane stretching), and some constant geometry specimens are stretched using different lubricants.
Due to the fact that experimental studies are often too costly and time-consuming, several simulation techniques have been proposed to produce fairly accurate FLDs based on the results of uniaxial tensile tests at very low costs.6–10
In recent years, many researches have attempted to develop precise and reliable models to determine FLDs of sheet metals, and several necking criteria have been proposed to predict the onset of localized necking.11,12 For the forming limit prediction of sheet metals, Narayanan et al. 13 introduced some necking criteria, namely, the effective strain rate–based criterion (ESRC: RC1), major strain rate–based criterion (MSRC: RC2), thickness strain rate–based criterion (TSRC: RC3) and thickness gradient–based criterion (TGNC: RC4). Narasimhan and Wagoner 14 presented several necking criteria based on MSRC (R1), minor strain rate (R2) and ESRC (R3) variations in the neck and safe region and suggested that necking would occur when R1 > 4, R2 > 10 and R3 > 4. Brun et al. 15 suggested that the material would start to neck at the point of accelerated thinning. This finding was further studied by various researchers,16,17 who determined the FLD using such numerical analysis methods as finite element method (FEM).
In this article, three necking criteria are presented to predict the FLDs of low-carbon steel (ST12 and ST14) blanks of various thicknesses (1.00 and 1.25 mm). These criteria are as follows: (a) second time derivative of the equivalent plastic strain (PEEQ; in ABAQUS, PEEQ refers to the equivalent plastic strain), (b) second time derivative of the major strain (SDM)
The first criterion (PEEQ) has been employed for the first time to obtain FLDs. Hill’s 1948 yield function and Holloman’s strain hardening law have been used to model the behavior of sheet metals. A modified Marciniak and Kuczynski (M–K) method was also used to predict the FLDs. Furthermore, the FLDs have been determined experimentally to validate the results of the proposed methods.
Experimental procedure
Materials
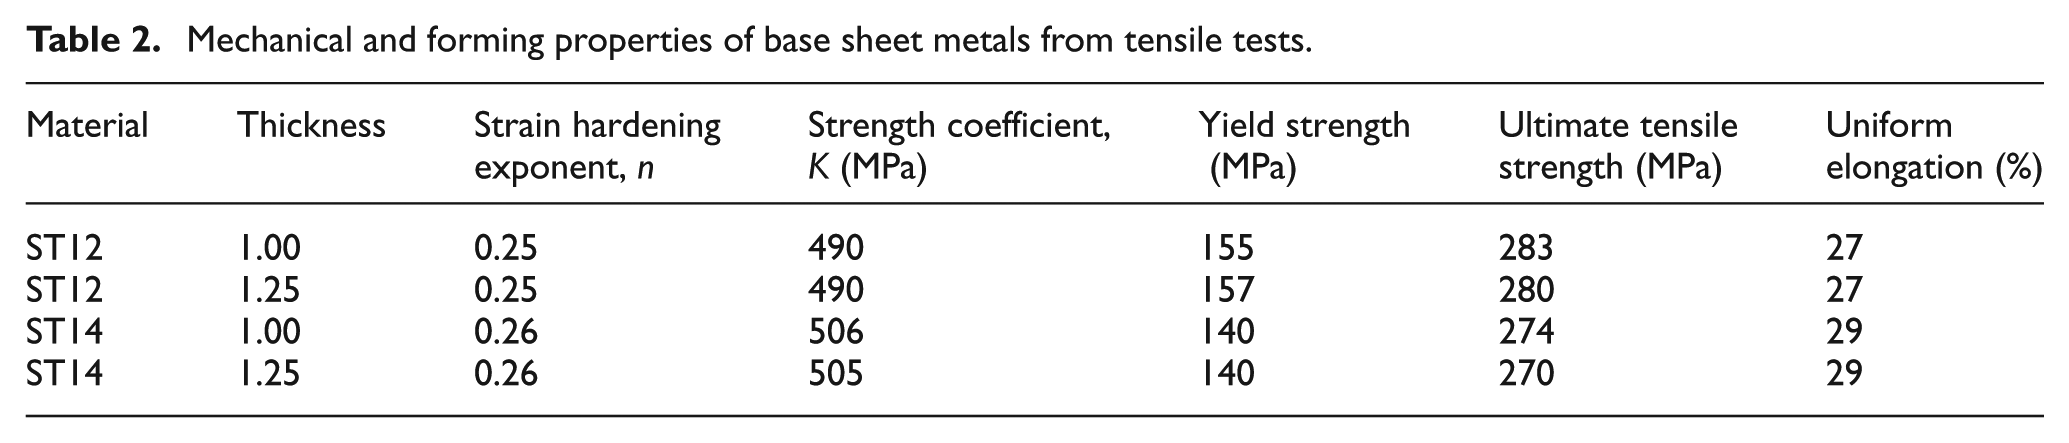
Two low-carbon steels (ST12 and ST14) were used in this study. These steel are widely used to make body panels in automotive industry due to their good stretchability. The chemical compositions of the low-carbon steels used in this study are reported in Table 1.
Chemical compositions of the low-carbon steels used in this study.
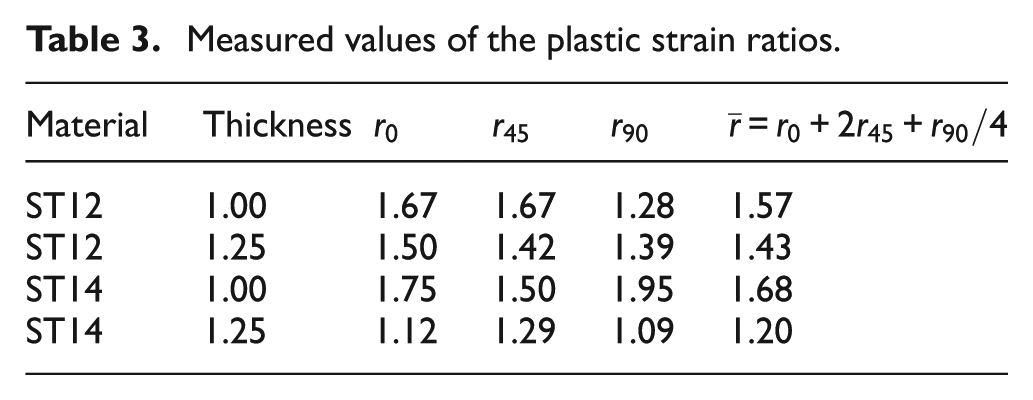
The mechanical properties and forming parameters of base sheet metals used in this study are given in Table 2. The yield strength, ultimate tensile strength, uniform elongation, strength coefficient and strain hardening exponents have been determined by standard tensile tests according to American Society for Testing and Materials (ASTM)-E8 specifications at 2 mm/min cross-head speed. 18
Mechanical and forming properties of base sheet metals from tensile tests.
The plastic strain ratios (
Measured values of the plastic strain ratios.
Experimental setup for FLDs
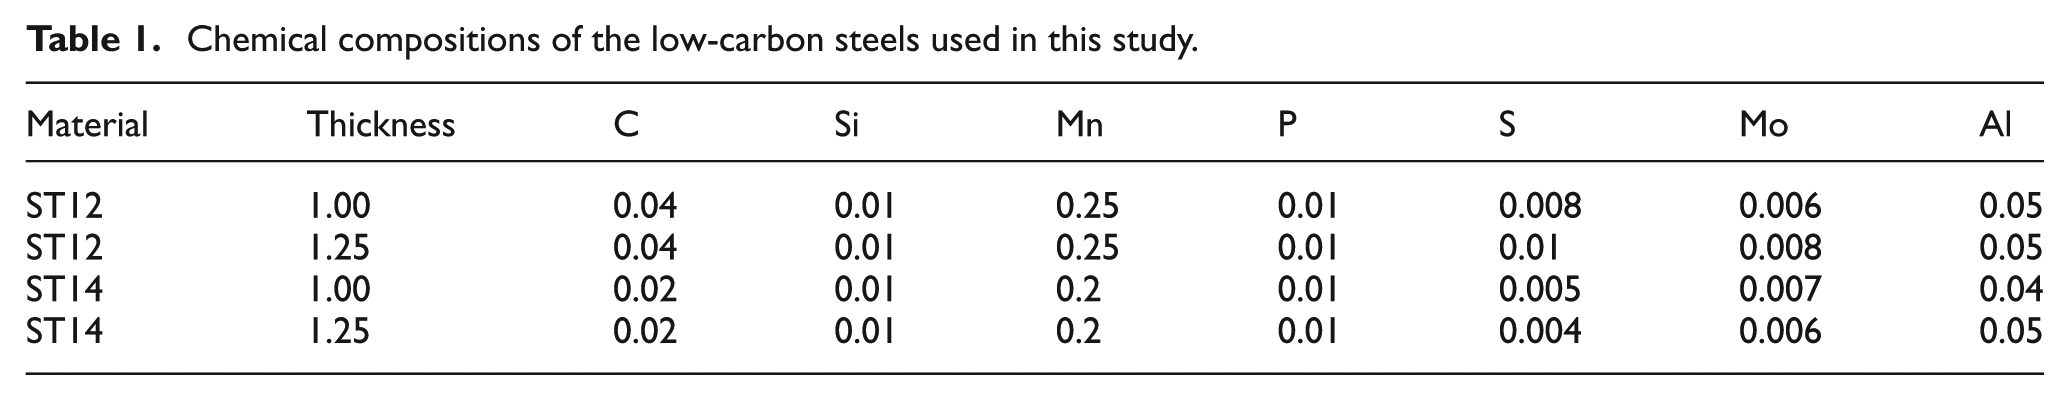
The biaxial stretch-forming tests were carried out according to the Nakajima deep drawing test.19,20 A schematic of the punch, lower die and upper die according to ISO 12004 are shown in Figure 1.
Schematic of punch, lower die and upper die.
Rectangular strips of various widths were cut from the sheet metals 200 mm long were made perpendicular to the rolling direction. Circular grids of 2.5 mm diameter were marked on each sample sheet by electrochemical etching. A 30-tonnes constant speed hydraulic press was used to draw of the specimens. A sudden drop in the load–displacement curve was used as a stopping criterion for the test (Figure 2). Circular blanks of polyethylene (PE) foil were used as lubricant. The experimental FLD setup is shown in Figure 3. Typical deformed specimens are shown in Figure 4.
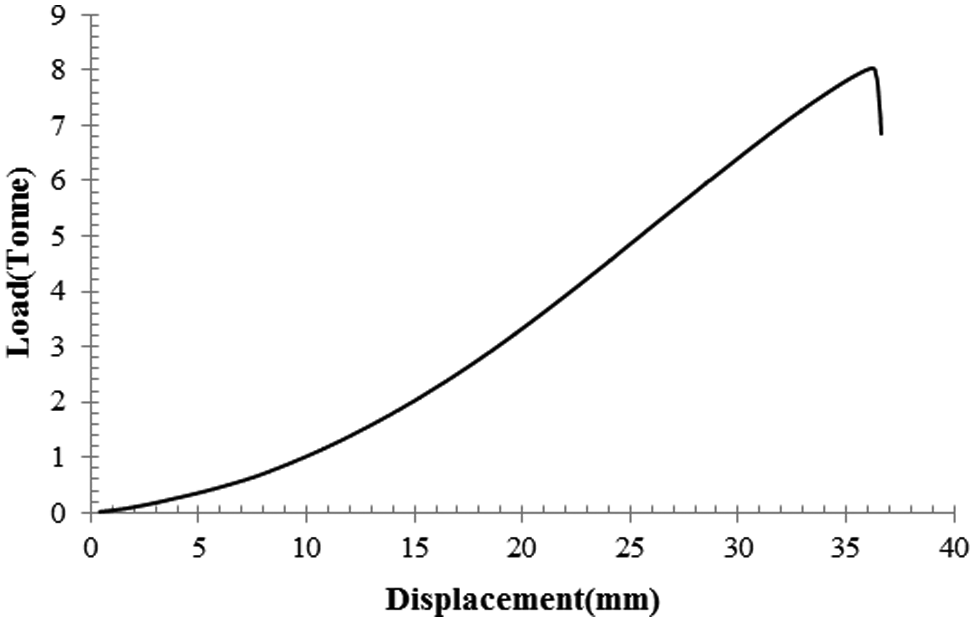
Typical load–displacement curve from the deep drawing test.
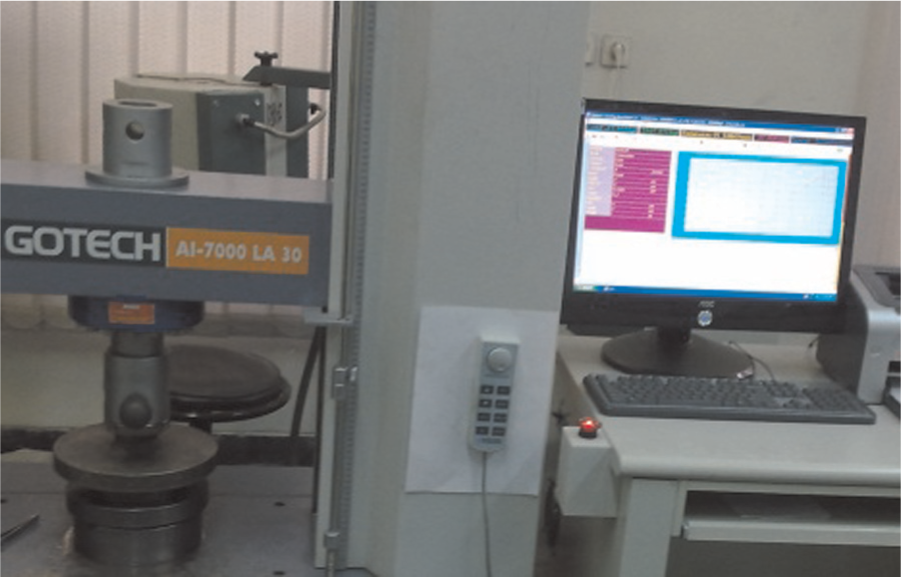
Experimental FLD setup.
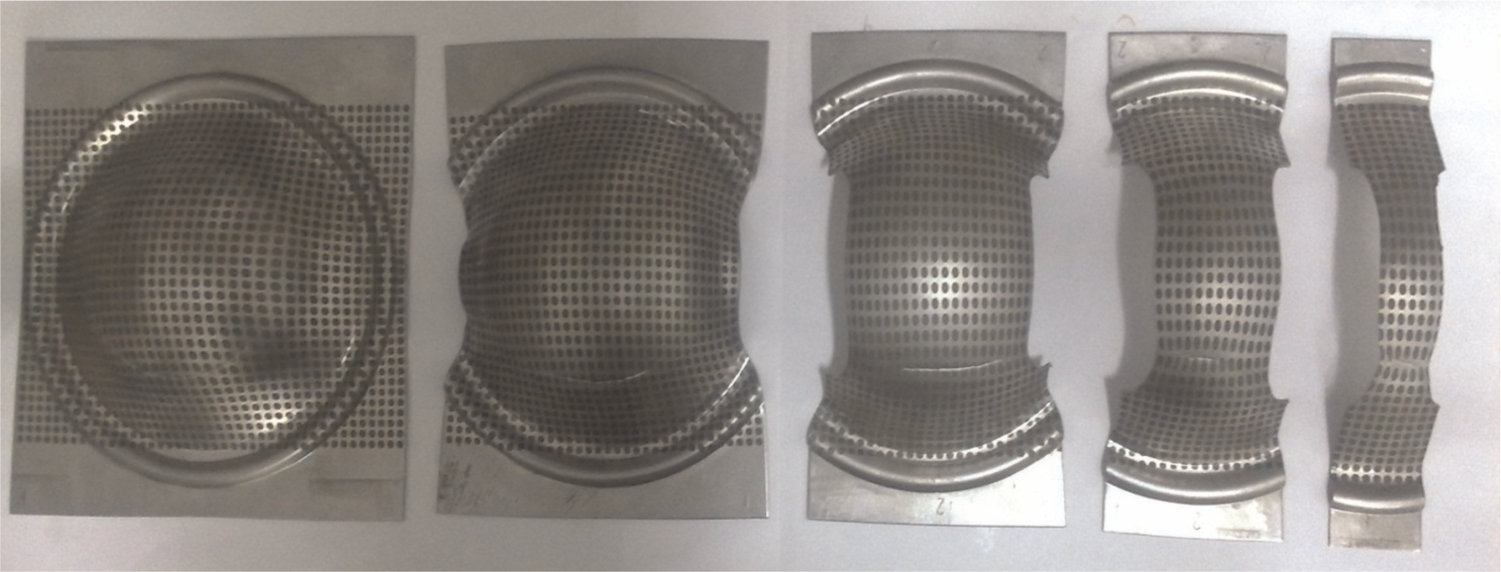
Typical deformed specimens.
The circles transformed to ellipses after deformation. The major and minor diameters of the ellipses were measured using a traveling microscope. The engineering strains were obtained using equations (1) and (2), respectively, and then transformed to true strains
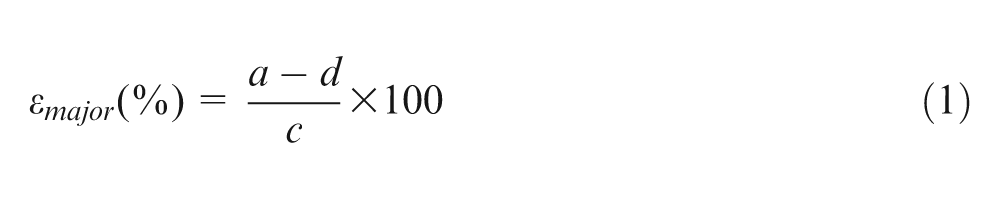

where a, b and c denote the ellipse’s major and minor diameters and the initial circle’s diameter, respectively. The FLD was determined by separating the safe zone (e.g. sheet metal limiting strains) from the unsafe zone containing the necked and fractured ellipses.
FE simulations to predict FLDs
The Nakajima deep drawing test was simulated in three-dimensional (3D) using ABAQUS/Explicit to study the formability of sheet metals. The friction coefficient between the blank and the punch (µ) was assumed to be 0.1. The die and punch were modeled as a rigid body (diameter of punch was 100 mm and diameter of die was 105.6 mm). The blank holder and the punch were allowed to move in the Z-direction along the axis of the punch and the die was fixed (Figure 5). The blanks were modeled as deformable solids and meshed using C3D8R elements.
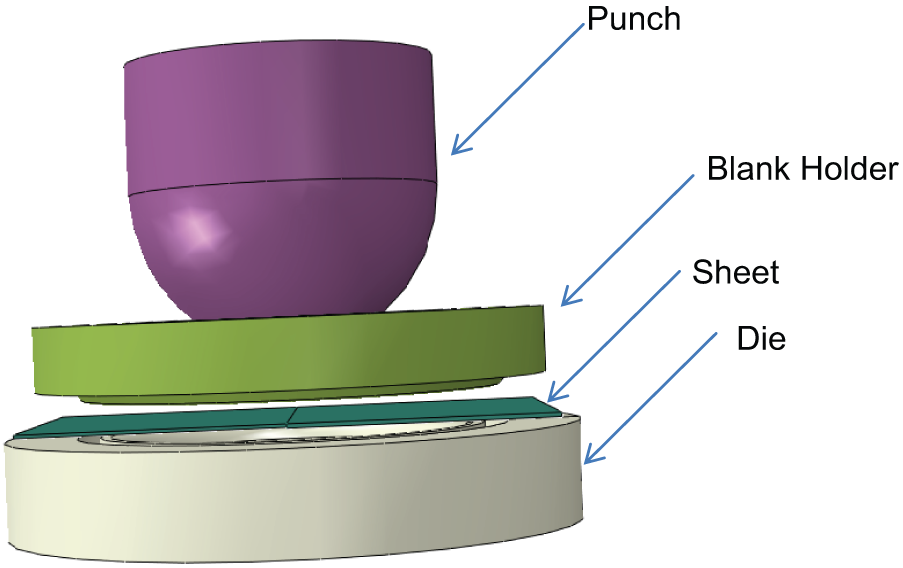
Typical view of the 3D model including the punch, the blank holder, the sheet and the die.
The governing yield function and hardening law
Hill’s 1948 yield function was used to model the behavior of the sheet metals. The model is described by the following relations 21
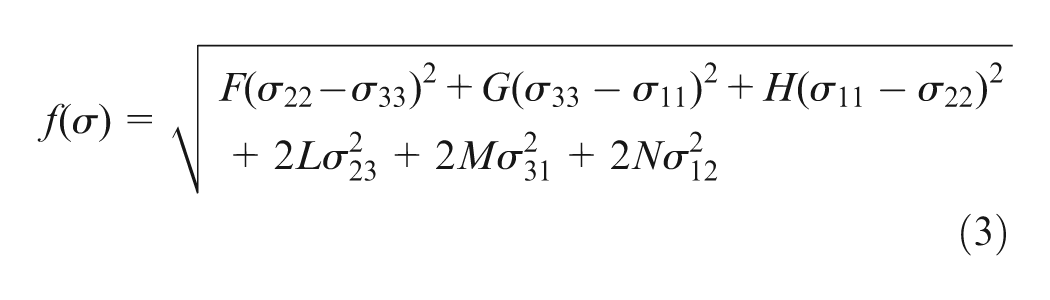
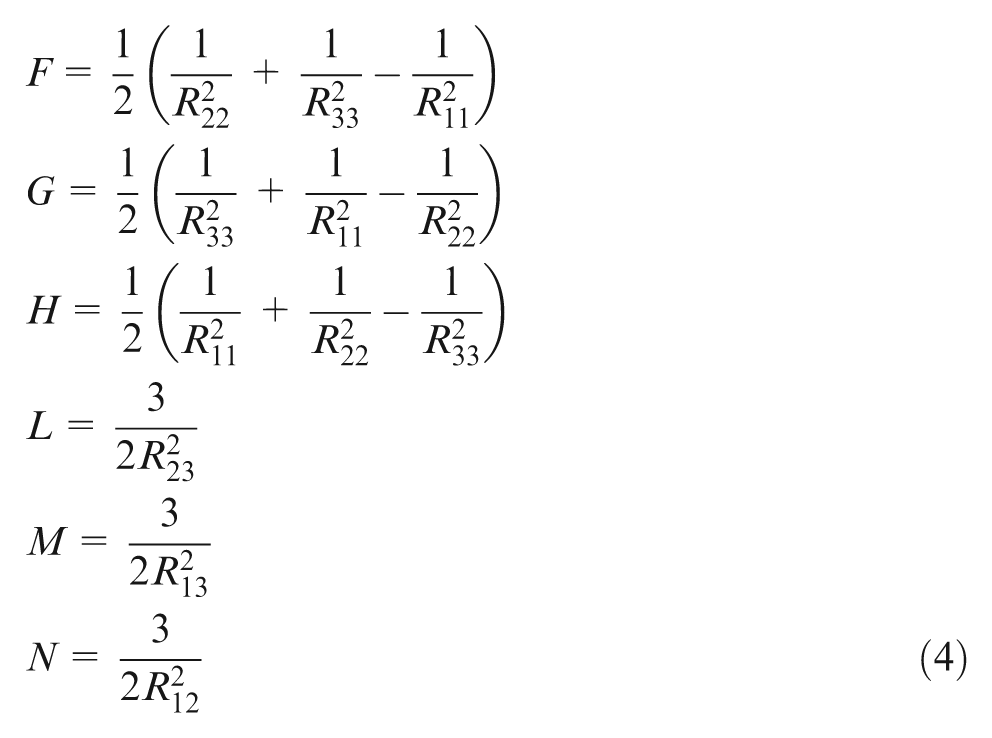
F, G, H, L, M and N are Hill’s yield function coefficients. These coefficients can be imported into the software by six yield stress parameters
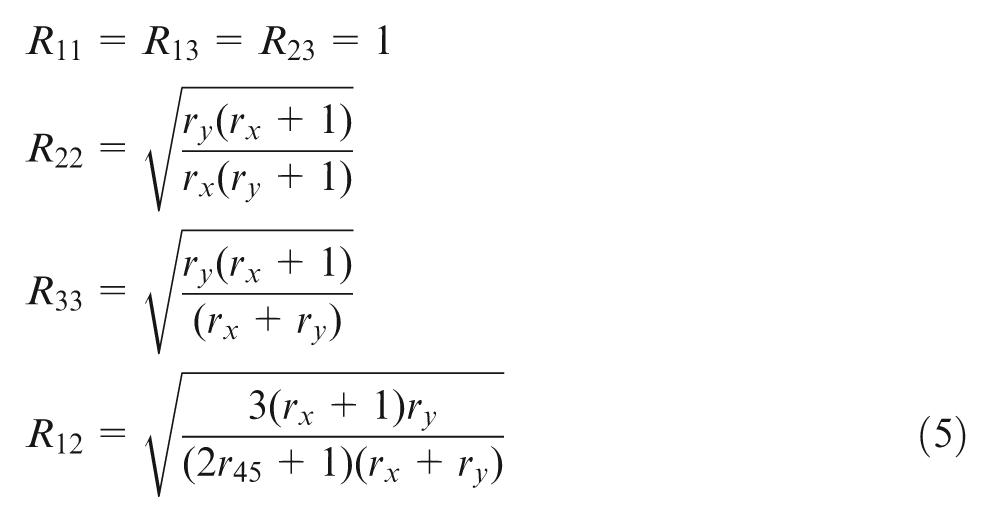
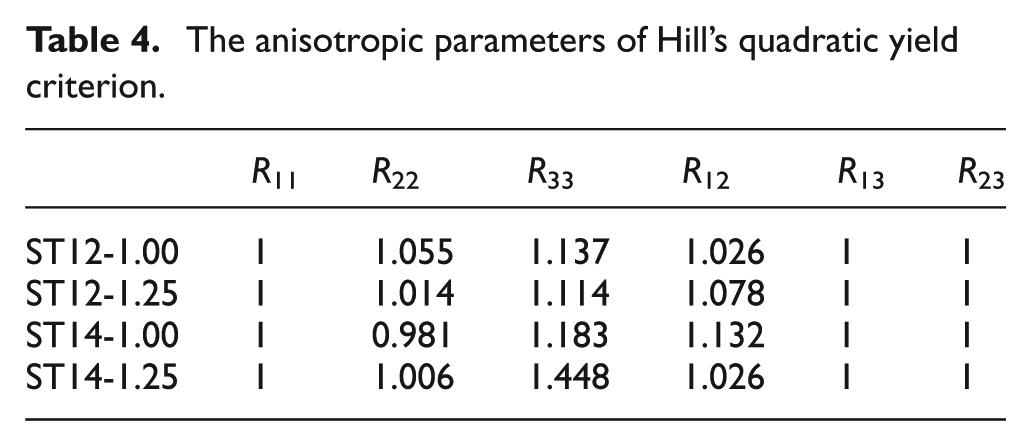
These anisotropic parameters were calculated for low-carbon steel blanks (ST12 and ST14) of various thicknesses (1.00 and 1.25 mm) (Table 4.)
The anisotropic parameters of Hill’s quadratic yield criterion.
Holloman’s hardening law was used to describe work-hardening. The law is given by the following equation23,24,25
where
Necking criteria for the FLD prediction by FEM
Selecting a proper necking criterion is essential to the determination of sheet metal limit strains (Figure 6). As mentioned earlier, in this work, three different necking criteria, namely, SDM, SDT and PEEQ, were employed to detect the onset of necking. These criteria are described here.
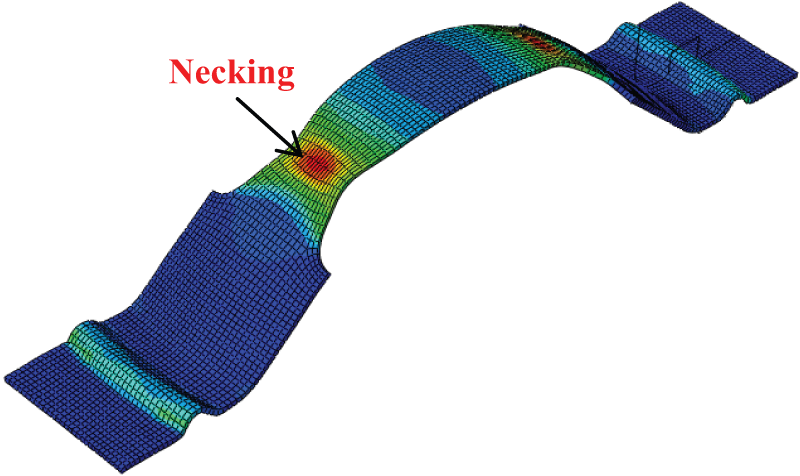
Typical FEM results depicting the onset of necking in a deformed specimen.
The SDM criterion
First proposed by Situ, 25 the SDM criterion is based on the second derivative (or acceleration) of the major strain in the blank, defined as
where
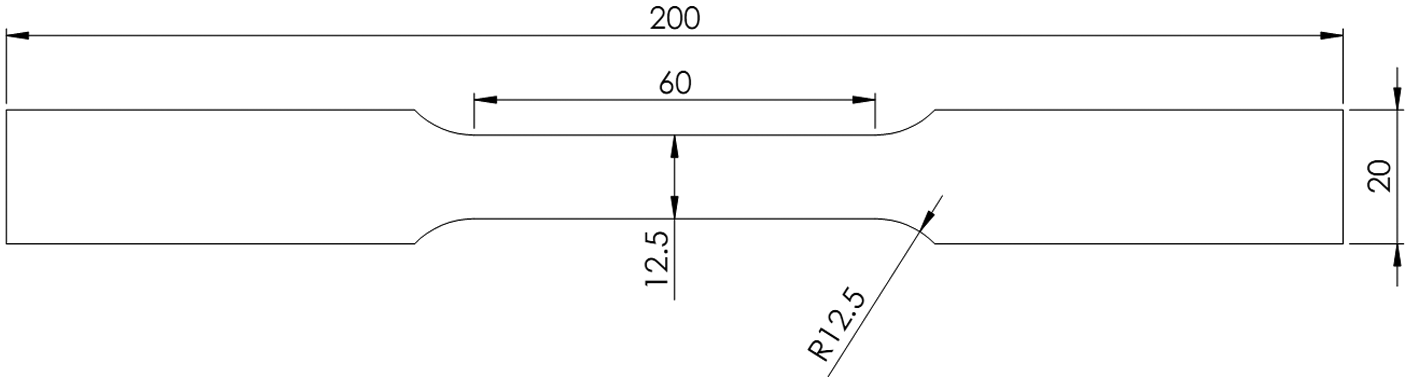
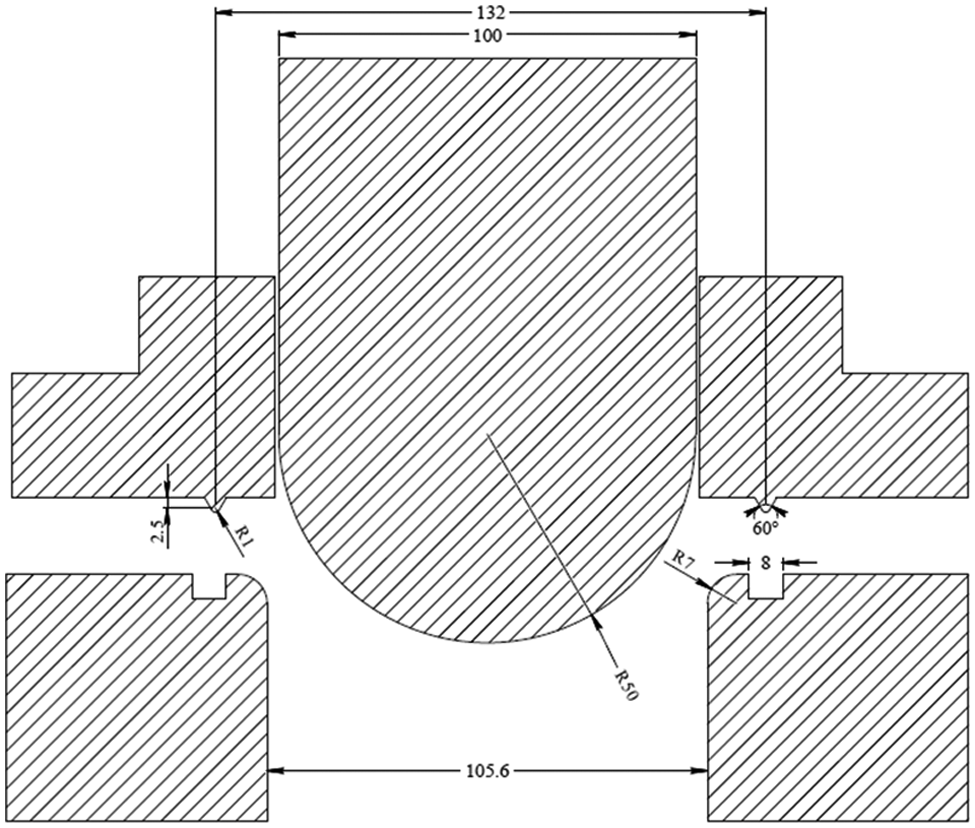
The tensile test sample dimension.
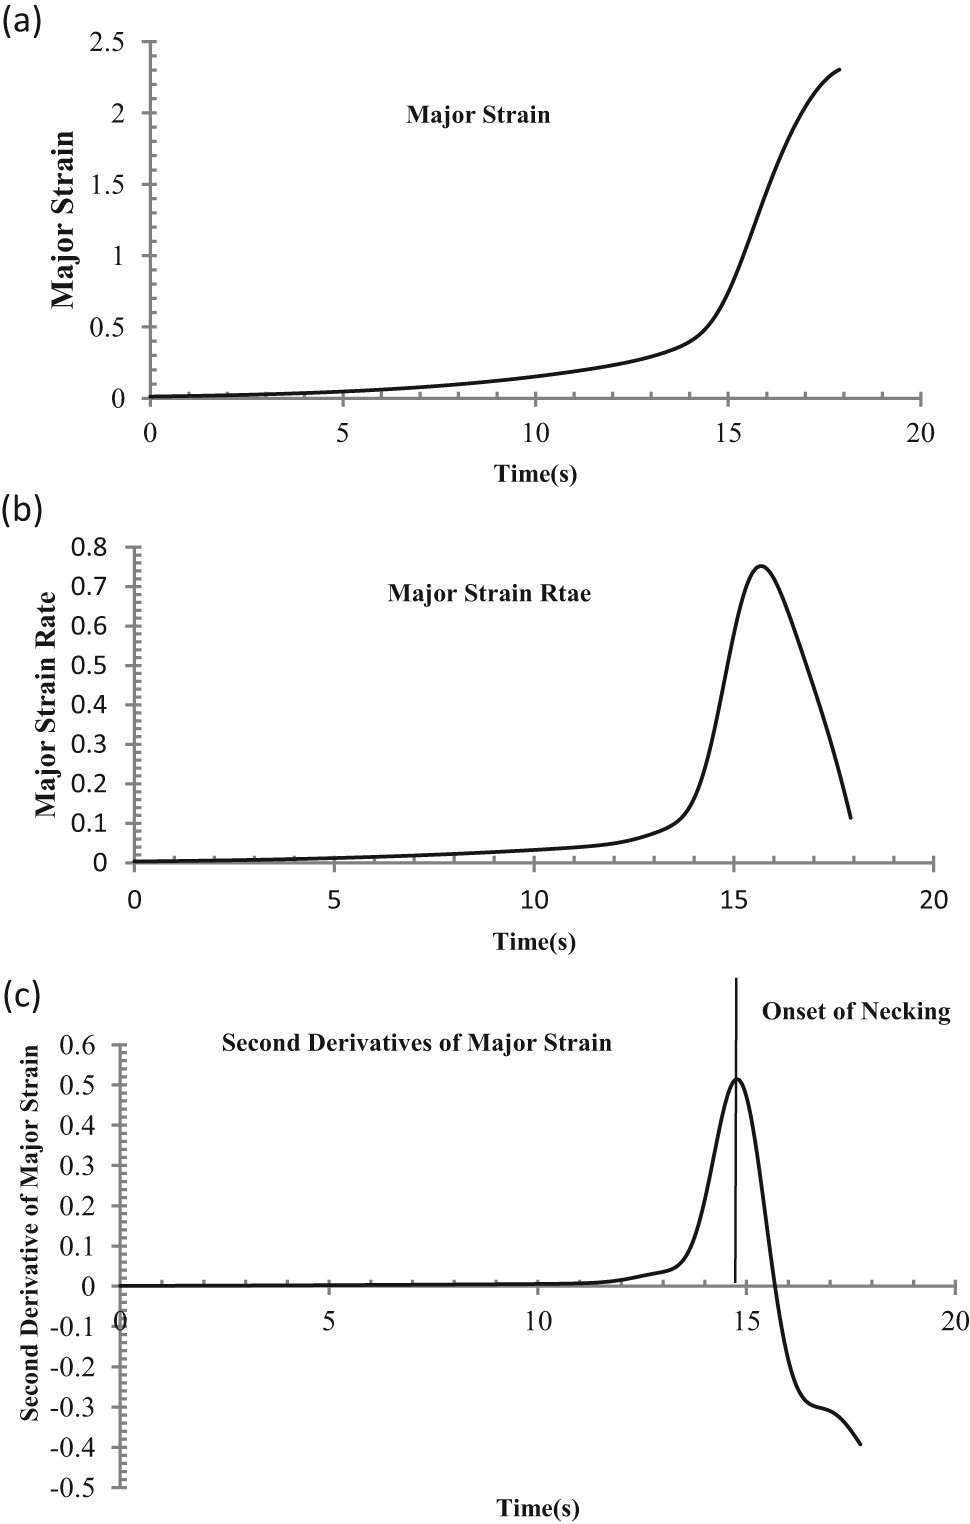
(a) Major strain history data, (b) first derivative of the major strain history data and (c) second derivative of the major strain history data.
The SDT criterion
The second time derivative (or acceleration) of the thickness strain is defined as
where
The PEEQ criterion
The scalar quantity “equivalent plastic strain” (PEEQ) could represent the material’s inelastic deformation, where a positive PEEQ indicates yielding. PEEQ is defined as22,26
where
A comparison between the strain histories of equivalent plastic strain, major strain and thickness strain is shown in Figure 9. Figure 10 shows the relation of plastic strain and thickness strain with major strain. This figure shows that the relation between these criteria is linear. Therefore, the peaks of their second-derivative curves occur at the same time, and hence the resulting FLDs would be similar. Therefore, it is only natural that the three criteria show the same results.
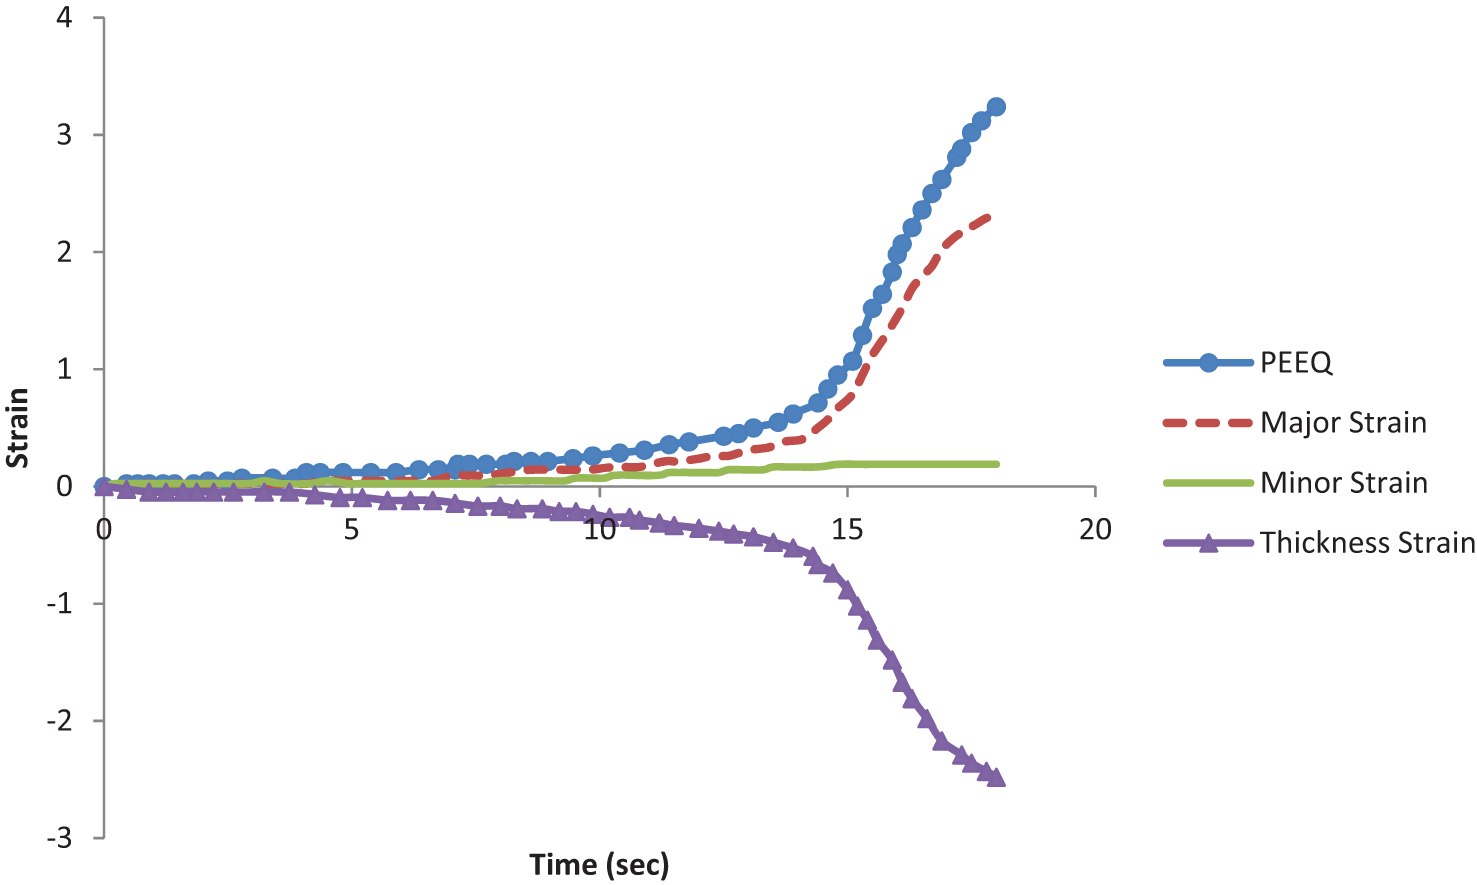
Comparison between the strain histories of PEEQ, major strain and thickness strain.
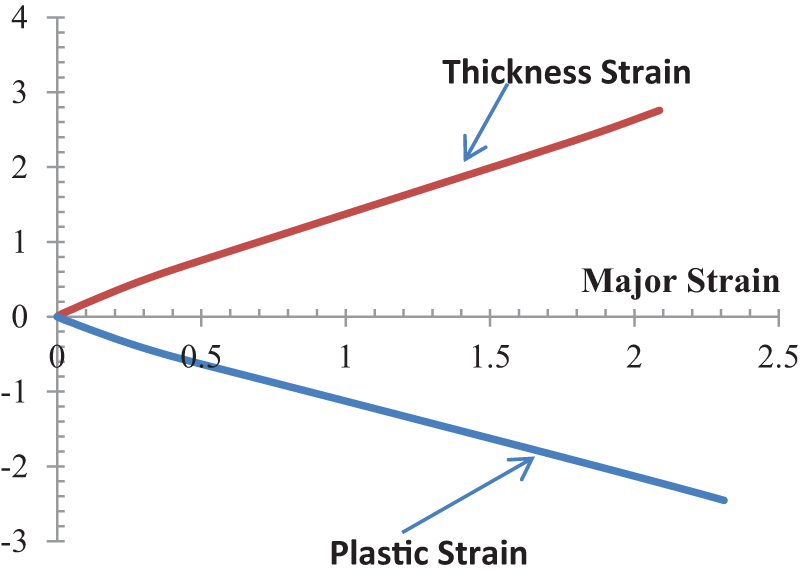
Relation of plastic strain and thickness strain with major strain.
Figure 11 shows a strain path from an element in the FE model used in this study. The strain path shows to be almost linear until the onset of necking, which indicates that the FLDs obtained in this work are acceptable.
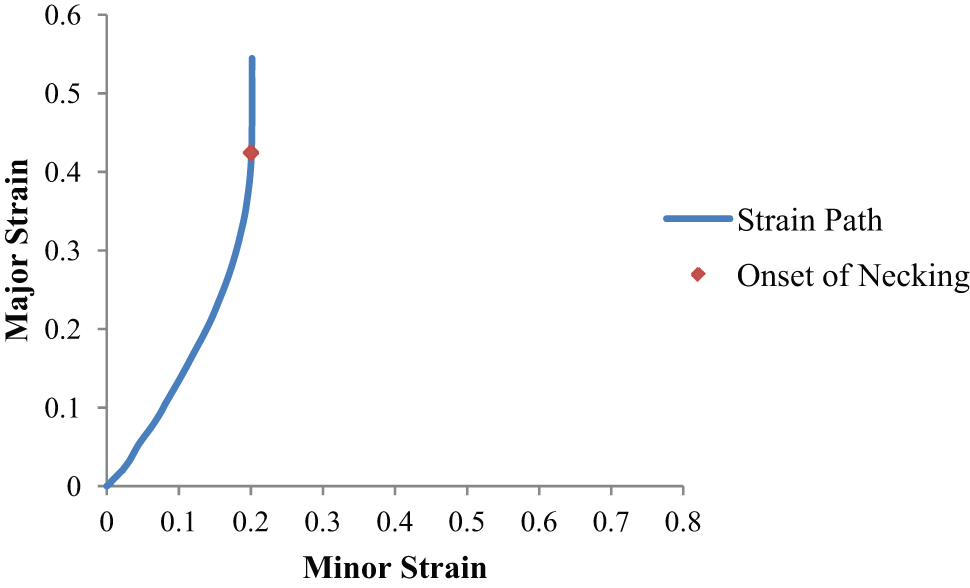
Linearity of strain path.
The M–K method
Calculations of sheet metal limit strains were based on the well-known M–K model in this study. In the M–K model, it has been assumed that there is a geometrical inhomogeneity in a sheet. Thus, the sheet is composed of an ideally perfect region (e.g. a safe zone) and a region that contains a geometrical inhomogeneity (a groove zone). This geometrical inhomogeneity leads to localized necking in the sheet. Imposing of stress components at rolling and transverse directions in the ideally perfect region causes the progression of strain increments in both the safe and the groove zones. More explanation and detailed procedure of the FLD computations could be found in Hashemi et al. 19
Results and discussion
This study presents the results of simulated hemispherical die stretching for ST12 and ST14 sheets with thicknesses 1.0 and 1.25 mm. The simulations were designed to produce FLDs. Multiple criteria, including the second time derivatives of major strain, thickness strain and equivalent plastic strain extracted from the strain history of simulations, were used to accurately detect the start of necking in FLDs. This is to say that necking starts when the second derivative of the thickness strain, major strain or plastic strain reaches its maximum value. Knowing the onset of necking, one can measure the major and minor strains at the critical area and produce the corresponding FLD. The results from the proposed method and those from experimental tests are compared to demonstrate the efficiency of the proposed method.
Comparison of necking positions
Figure 12 compares necking positions or failure locations from sheets predicted by FE simulations for five different strain paths with experimental results.
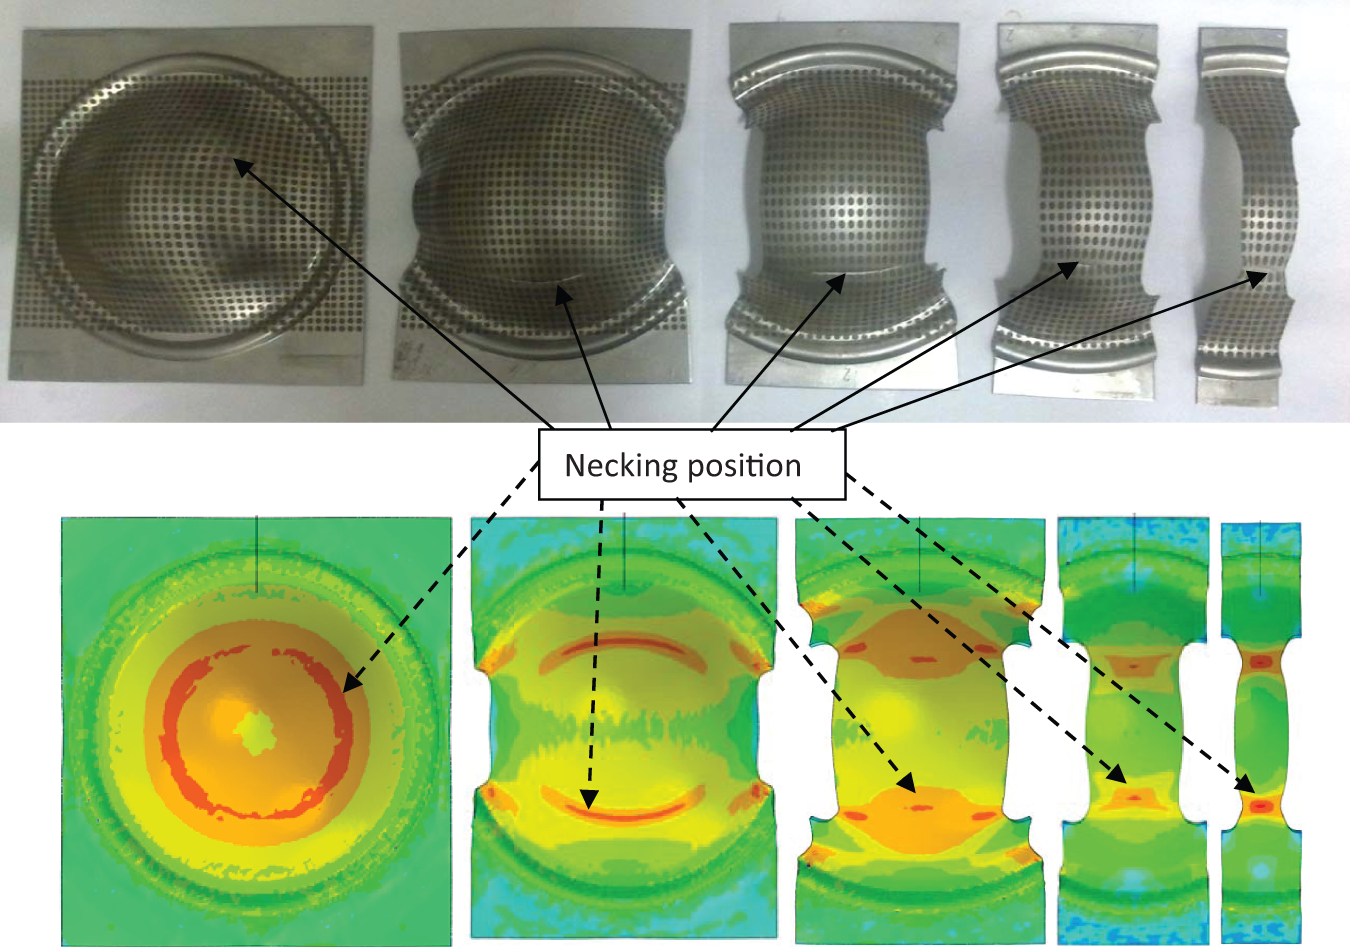
Comparison of necking positions from simulation and experiment.
Comparison of experimental and predicted FLDs
Figure 13 compares FLDs from ST12 low-carbon steel sheets of different thicknesses. Figure 14 compares FLDs from ST14 low-carbon steel sheets of different thicknesses. The difference between predicted and experimental results could be attributed to errors in strain measurements by the conventional “circle grid analysis” method.27–32 Moreover, the second derivative numerically calculated would be strongly influenced by the small perturbations on the original data. To reduce this sensitivity, big step intervals have been selected in order to obtain more accurate FLDs. However, error originated from this sensitivity was inevitable. Table 5 compares experimental FLD0s with those from FE analysis (PEEQ criterion) and the M–K method. It could be seen that FE simulation results from various strain paths are in fairly good agreement with experimental ones. In the plane strain mode, FEM gives better results than the M–K method. This phenomenon could be explained by pointing to a role of calibration method in the M–K model.
33
The main drawback of the M–K approach for prediction of the limit strains in sheet metal forming processes is requirement of an experimental point of the FLC in order to calibrate the curve. In this study, it was difficult to assume a proper value for the initial inhomogeneity factor (e.g.
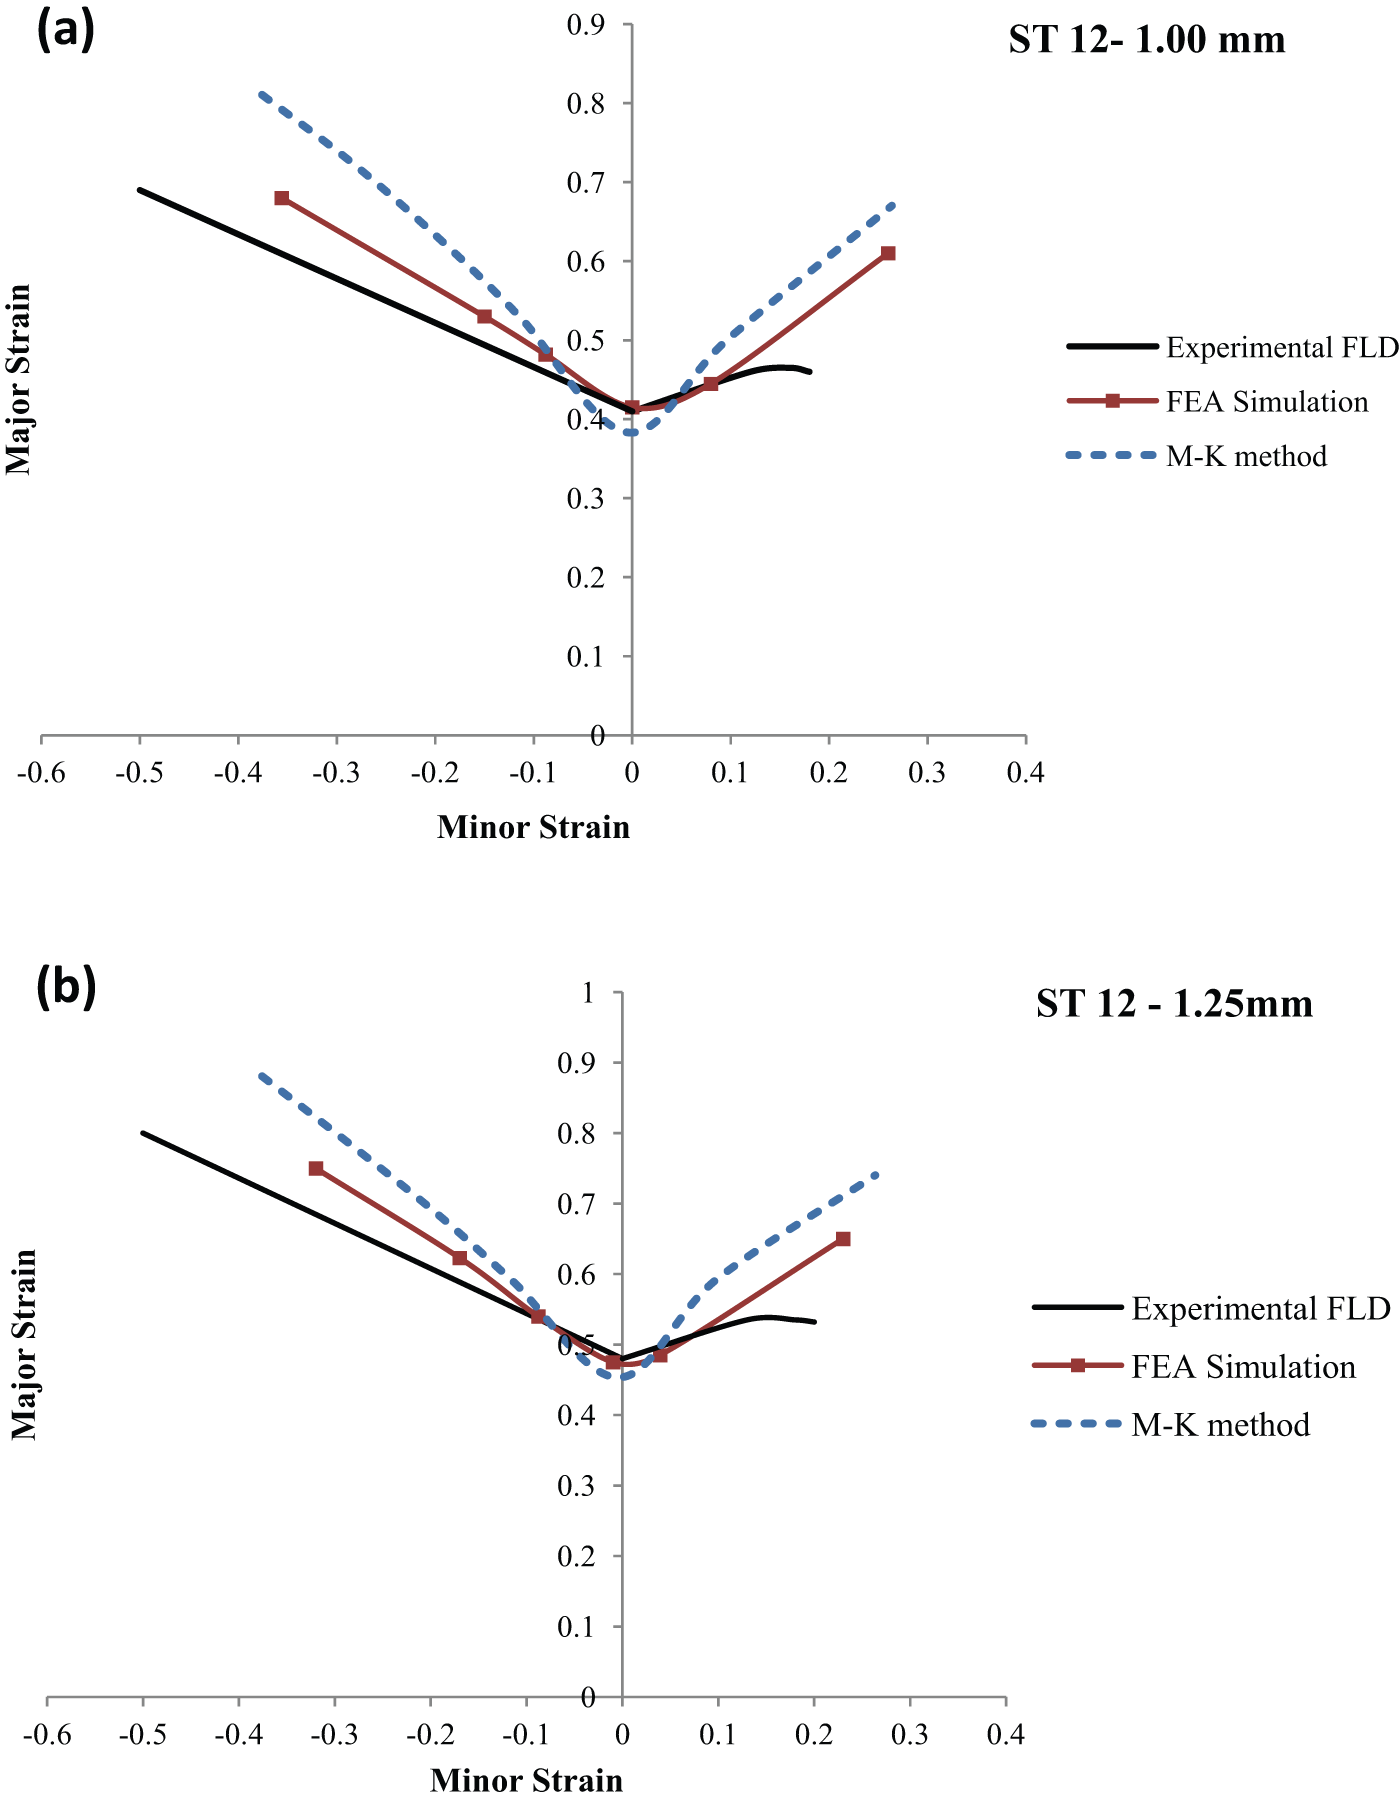
Comparison of FLDs: (a) ST12 specimens 1.00 mm thick and (b) ST12 specimens 1.25 mm thick.
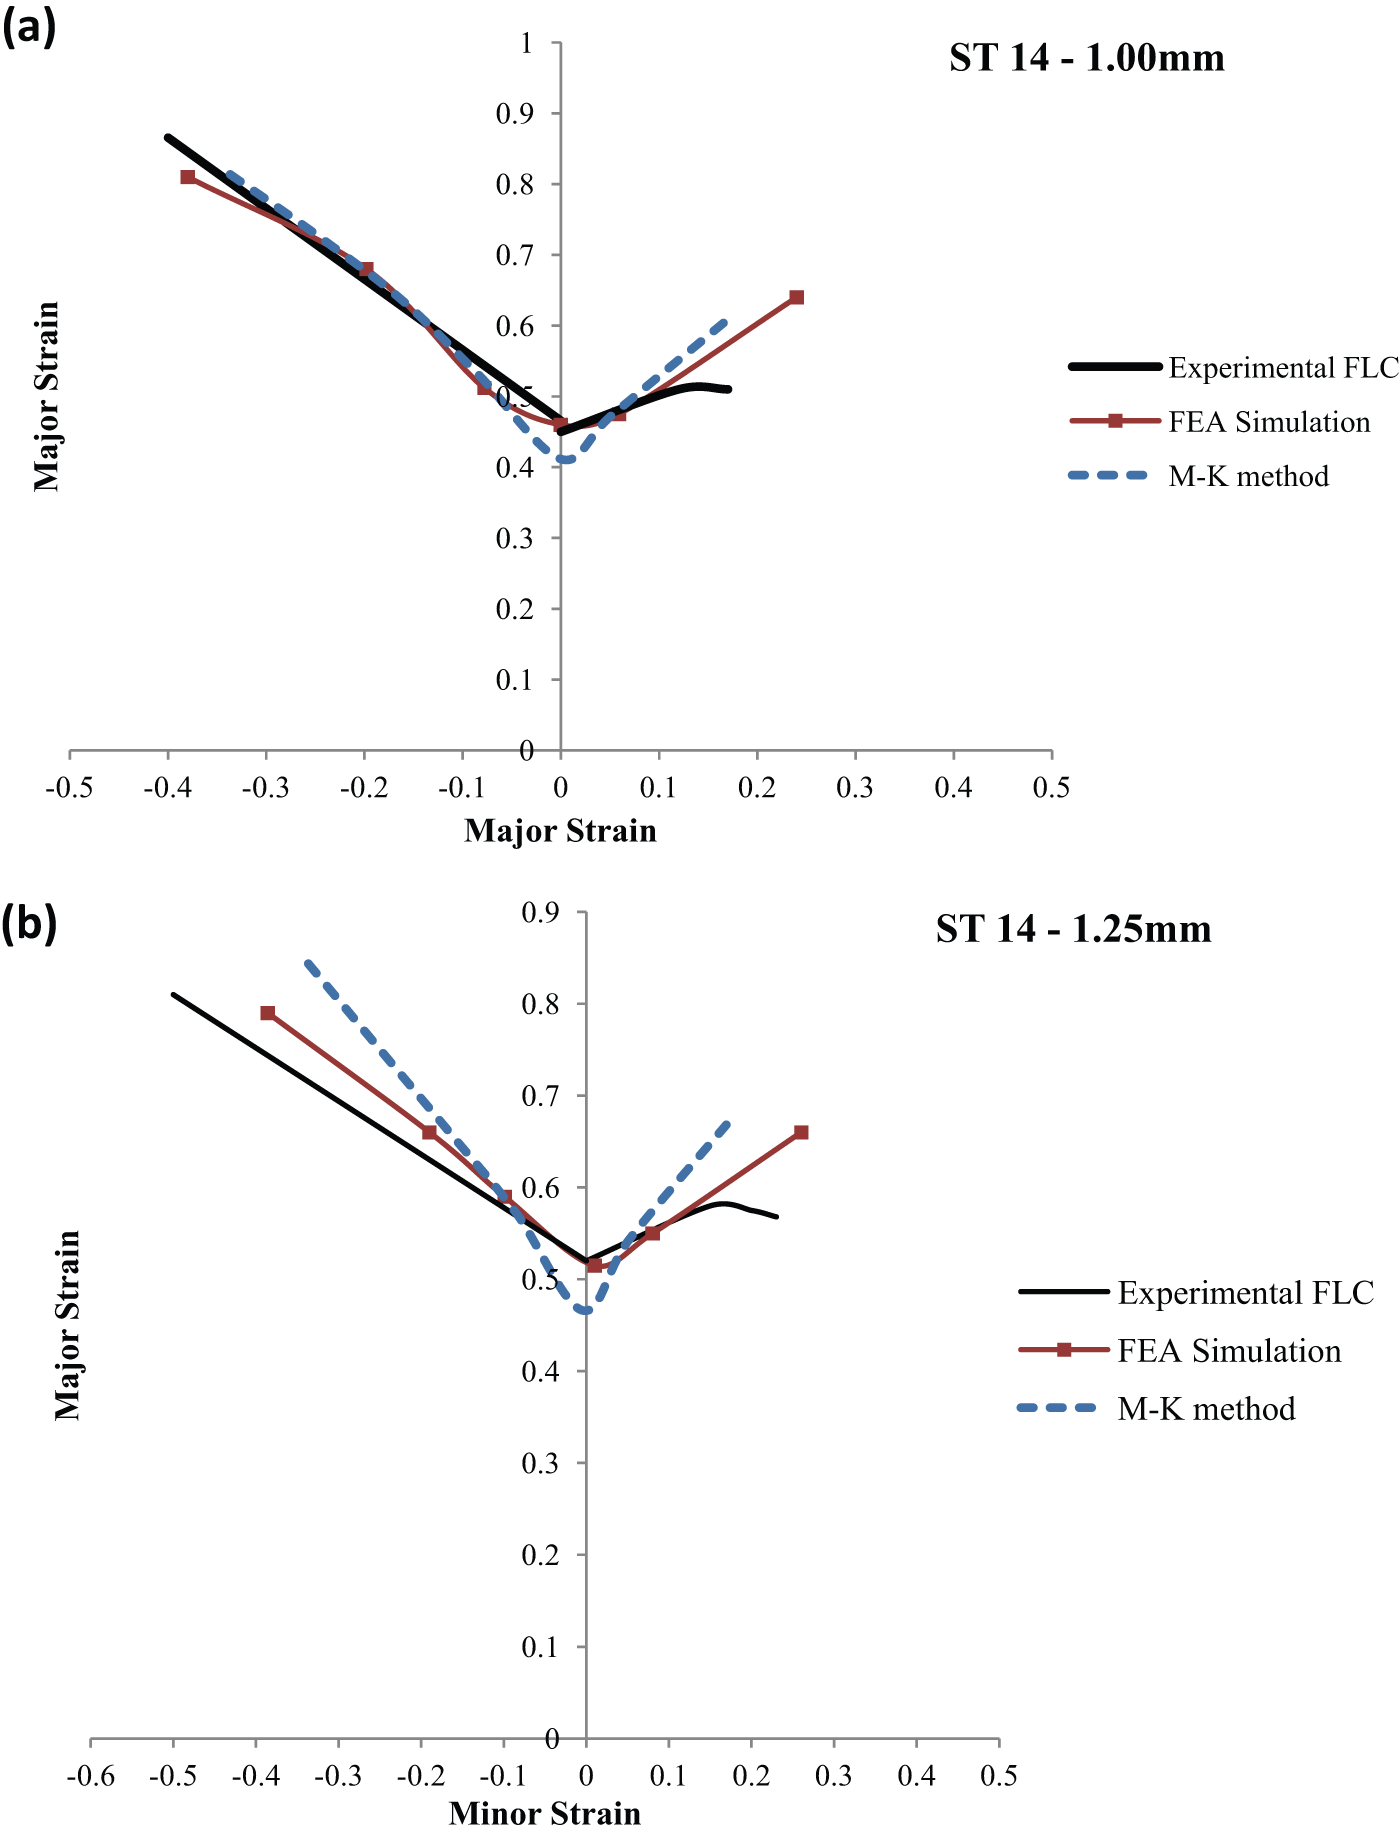
Comparison of FLDs: (a) ST14 specimens 1.00 mm thick and (b) ST14 specimens 1.25 mm thick.
Comparison of FLD0 from various sheets.
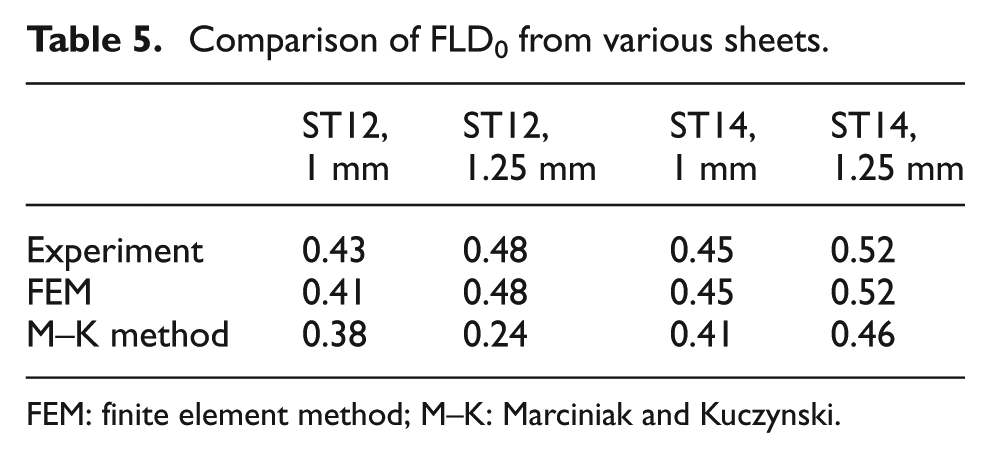
FEM: finite element method; M–K: Marciniak and Kuczynski.
The FLDs obtained from the so-called SDM, SDT and PEEQ criteria have been illustrated in Figure 15. The three criteria show the same results.
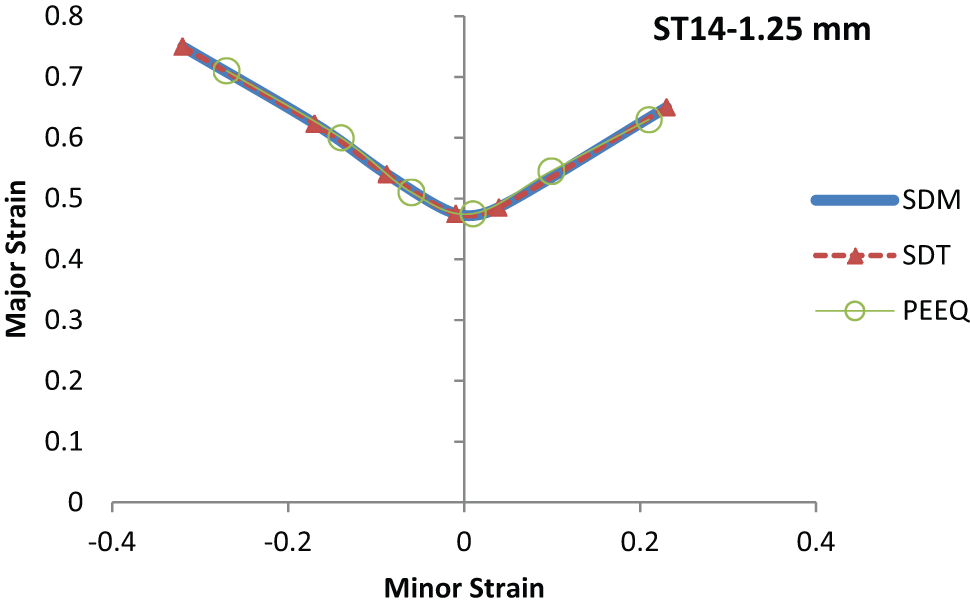
The FLDs obtained from so-called SDM, SDT and PEEQ criteria.
The comparison of FLC results from two, four and six elements (e.g. through-thickness elements) with experiment for ST14-1 mm has been illustrated in Figure 16.
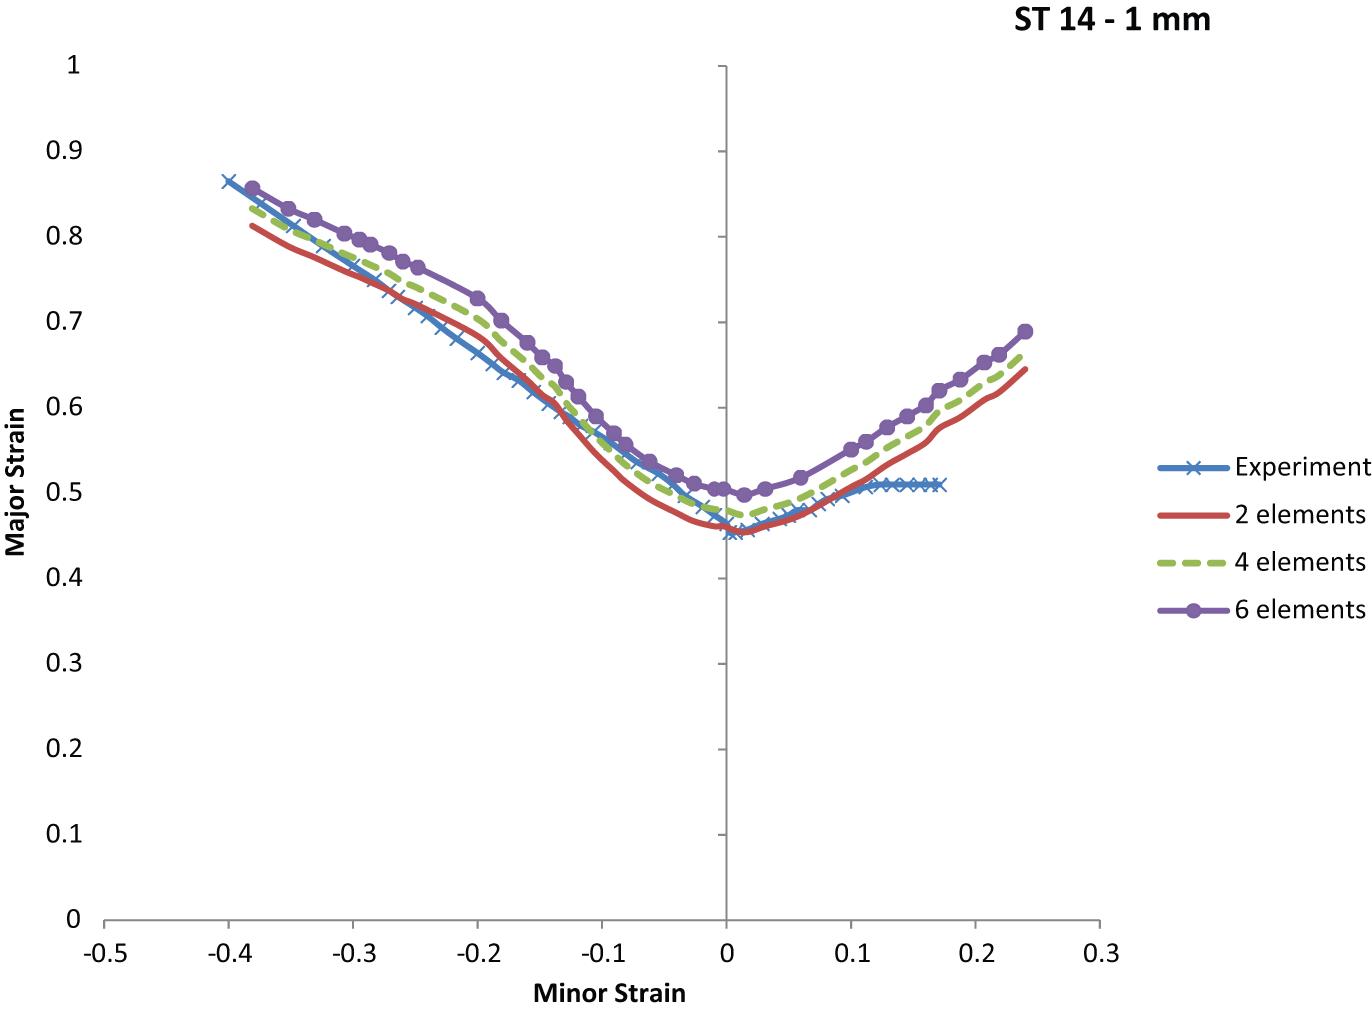
The comparison of results from two elements to four elements and six elements.
Conclusion
In this article, a novel numerical method to determine the FLD was introduced and validated through comparison of its results with experimental ones. Three different criteria (SDM, SDT and PEEQ) were proposed to detect the start of necking and to determine the FLDs, with PEEQ being used for this purpose for the first time. All three criteria based on FE analysis show the similar results. The proposed method is fairly accurate and computationally inexpensive. It could be easily implemented for FLD generation in a laboratory setting with little need for user input and subjectivity. The results from the proposed simulation-based method are in good agreement with experimental ones.
Footnotes
Appendix 1
Acknowledgements
The authors would like to express their deepest gratitude to Dr Masoud Shariat Panahi for his help.
Declaration of conflicting interests
The authors declare that there is no conflict of interest.
Funding
The author would like to acknowledge the financial support of Iran National Science Foundation (INSF).